Vvojov diagramy a procesn mapy Ekonomika a zen


 l chovejte se tak, jako")


 Information: Introduction to BPMN: http: //www. bpmn.")
- Slides: 18
Vývojové diagramy a procesní mapy Ekonomika a řízení podniku
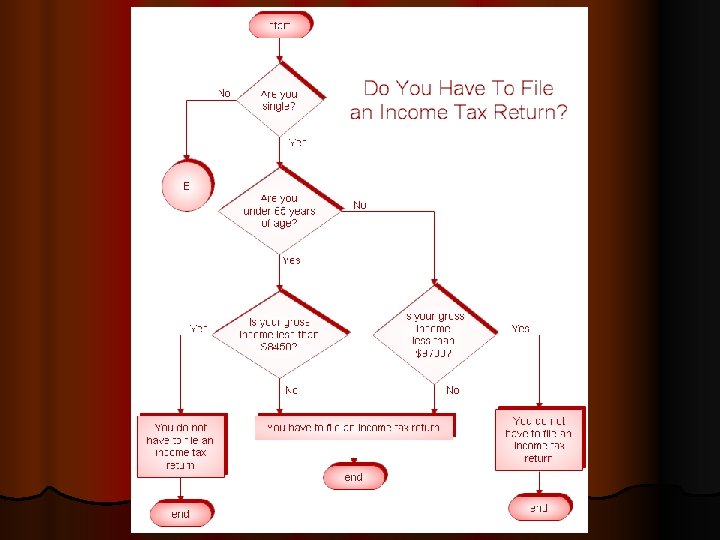
Algoritmus řešení kvadratické rovnice pomocí vývojového diagramu
Flowcharts help to identify all the key tasks involved and the finished chart can be used, l l l l as a springboard for further discussion of the process to connect with other flowcharts explaining related activities to identify points where data can be usefully collected analysed to isolate possible problem areas to communicate the process to those unfamiliar with it develops a common understanding of the situation contributes a larger pool of knowledge than an individual can (assuming team members are well chosen for their knowledge and experience) can agree a common approach to solving problems, resolving ambiguities and making improvements
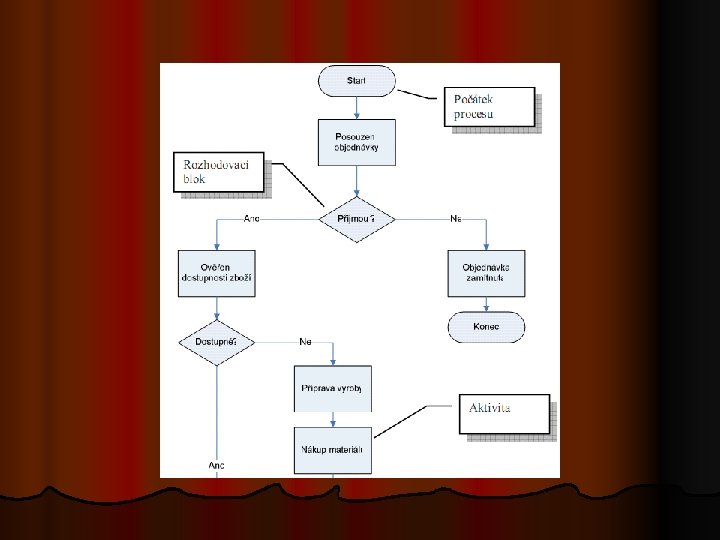
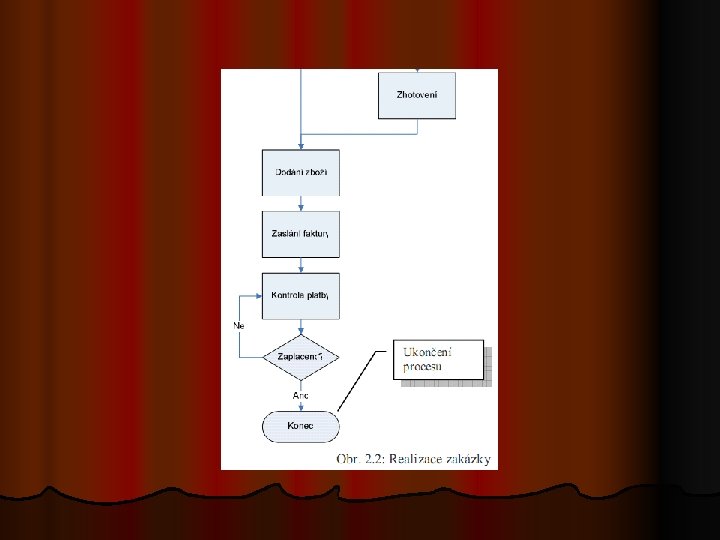
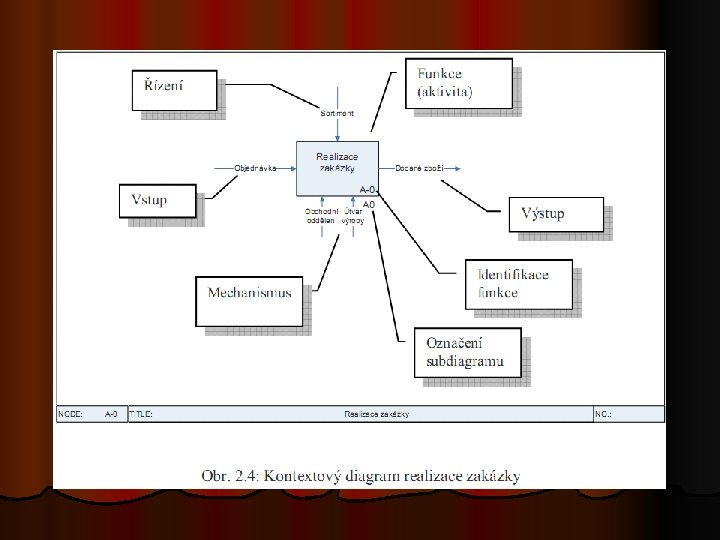
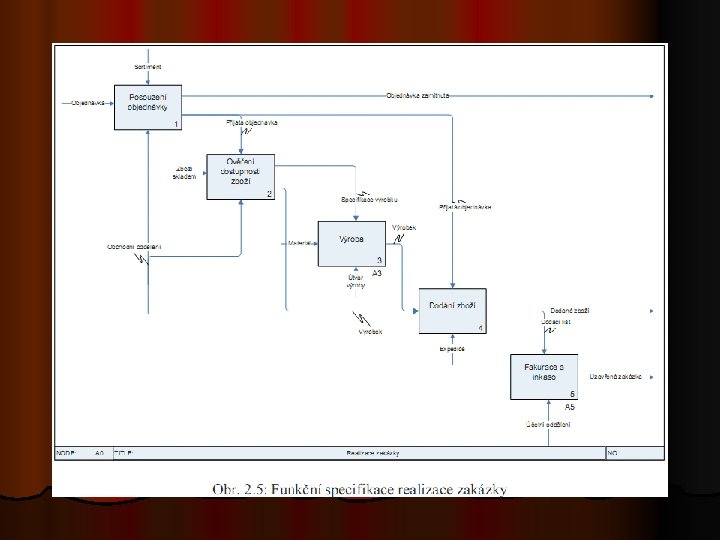
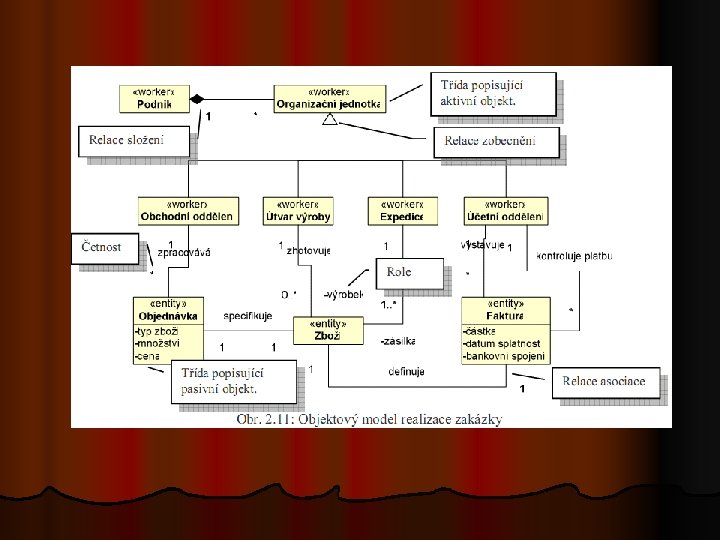
Realizace zakázky pomocí událostmi řízeného procesu
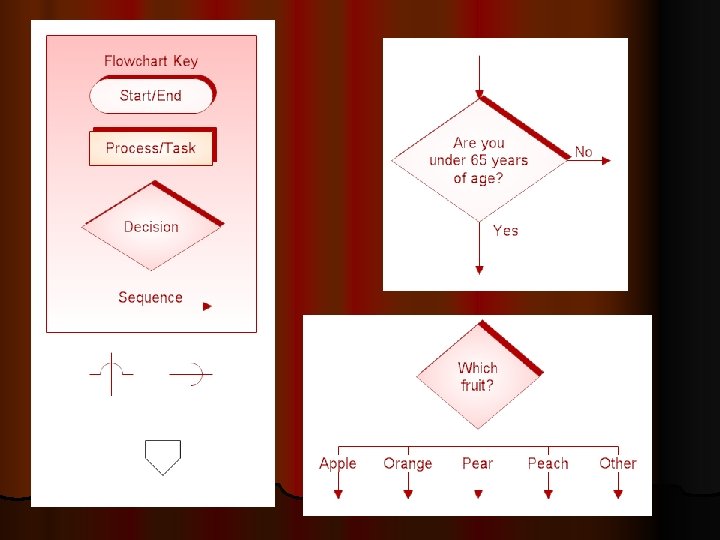
How to draw a flowchart 1. 2. 3. 4. 5. 6. describe the process to be charted (this is a one-line statement such as, "How to fill the car's petrol tank") (určit si rozsah) start with a 'trigger' event (co spouští procesy? ) note each successive action concisely and clearly (jednotný stupeň abstrakce) go with the main flow (put extra detail in other charts) make cross references to supporting information follow the process through to a useful conclusion (end at a 'target' point)
Pokyny pro zpracování vývojových diagramů (H. Kučerová a další) l chovejte se tak, jako byste připravovali program pro počítač (tj. nespoléhejte na intuitivní rozhodování nebo navyklé postupy) pokud se jedná o složitější problém, vytvořte několik jednodušších diagramů l l l l každý diagram musí mít alespoň jeden začátek a alespoň jeden konec každý proces zobrazujte pouze jednou každý proces musí mít alespoň jeden vstup a alespoň jeden výstup každý rozhodovací proces musí mít pouze jeden vstup a více než jeden výstup každý proces musí směřovat k jasně definovanému ukončení jakmile na proces nic dalšího nenavazuje, je to KONEC snažte se o přehlednost, srozumitelnost, úpravnost l validace (potvrzení správnosti) vývojového diagramu: průchod všemi větvemi (každá cesta by měla vést od začátku ke konci), průchod testovacích dat l a) postupně řešených na různých úrovních podrobnosti (nejprve obecné blokové schéma, pak detailnější členění jednotlivých bloků) – pozor na rozlišovací úrovně b) rozdělte rozsáhlé detailní schéma do více dílů – stránek a) toky dat zobrazujte: shora dolů a zleva doprava b) nepřekřižujte čáry toků dat c) nespojujte dvě vstupní čáry do jedné výstupní ve stejném bodu d) Používejte komentující poznámky
Questions for Evaluating the Map and Identifying Areas for Improvement 1. 2. 3. 4. 5. 6. 7. Is this map comprehensive? What are other key outputs not captured on this map? What activities lead to this output? What are the major inputs into these activities? (Think of inputs as both physical entities and information. ) How is information tracked? On written specs? Paper invoices? What percentage of this information is automated? What technology is used to convert a particular input into an output? What equipment or job aids are used? Is a computer used? What are the major decisions made with the process? Where and when within the process are these decisions made? Who makes the decisions? How many people is part of the decision-making process? Who are they? Are their signatures required? When?
Questions for Evaluating the Map and Identifying Areas for Improvement 8. 9. 10. 11. 12. 13. 14. 15. How long does this step take? Why does it take this long? Is there a range? Why is there a range? Why does it sometimes take longer to perform a step? What is the cost of performing these activities? Can you give me an estimate? What are the problems you encounter in performing this step? What causes these problems? What are the roadblocks in this process? What are the strengths of this process? Why are we better at x (developing new products, getting orders to customers, etc. ) than our competitors? What works? When we redesign, we want to make sure we build on our strengths. How do we know when this process is successful? Is this process successful as it currently exists? How do you know? If we said we had to be five or twenty times faster in performing this process, with the same level of quality or better, what are the critical items we should eliminate or retain? (Designing Cross-Functional Business Processes by Bernard Johann, p. 96 )
Nejčastější chyby l l l Nezávislé subjekty nebyly odděleny v samostatných bazénech. Pro přenos dokumentů chybně používána čárkovaná čára místo tečkované. Pro komunikaci mezi nezávislými subjekty chybně používána plná či tečkovaná čára místo čárkované. Zpětná vazba velmi často zobrazována mezi 2 nezávislými subjekty (což jsme se shodli že by mělo být jen v rámci 1 subjektu). Chybně použité symboly pro začátek a konec procesu, proces začínal akcí/činností a nebyl ukončen respektive byl ukončen akcí/činností. Obecně docela často POTy neodpovídaly zadání, ať už chyběla zpětná vazba, předávaný dokument a podobně.
Software Use the best flowchart tool for the job (Visio vs. Power. Point: http: //office. microsoft. com/enus/visio/HA 010348321033. aspx? pid=CH 010717201033 Draw flowcharts with Word and Power. Point: http: //office. microsoft. com/enus/word/HA 010552661033. aspx? pid=CH 010716481033 Concept. Draw, Smart. Draw, EDraw Flowchart, Visio, and Omni. Graffle.
Literatura l Business Process Modeling Notation (BPMN) Information: Introduction to BPMN: http: //www. bpmn. org/ l KUČEROVÁ, Helena. Projektování informačních systémů. Sylaby ke kurzu. Praha : Vyšší odborná škola informačních služeb, 2007. 116 s. http: //info. sks. cz/users/ku/DOKUMENTY/pri_syl. pdf l Vondrák: Metody byznys modelování: l David Straker. Syque. com: l Flowcharting: vondrak. cs. vsb. cz/download/Metody_byznys_modelovani. pdf http: //syque. com/quality_tools/toolbook/Flowchart/flowchart. htm http: //www. hci. com. au/hcisite 2/toolkit/flowchar. htm