
Vorlesung 6 Roter Faden 1 Cosmic Microwave Background
Vorlesung 6: Roter Faden: 1. Cosmic Microwave Background radiation (CMB) 30. 11. 2007 Kosmologie, WS 07/08, Prof. W. de Boer 1
Zum Mitnehmen Pfeiler der Urknalltheorie: 1) 2) 3) Hubble Expansion CMB Kernsynthese 1) beweist dass es Urknall gab und 2, 3) beweisen, dass Univ. am Anfang heiss war 30. 11. 2007 Kosmologie, WS 07/08, Prof. W. de Boer 2
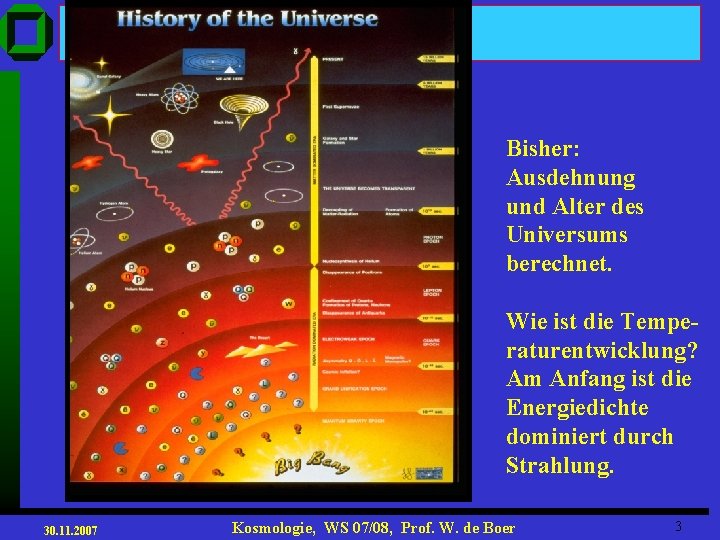
Bisher: Ausdehnung und Alter des Universums berechnet. Wie ist die Temperaturentwicklung? Am Anfang ist die Energiedichte dominiert durch Strahlung. 30. 11. 2007 Kosmologie, WS 07/08, Prof. W. de Boer 3
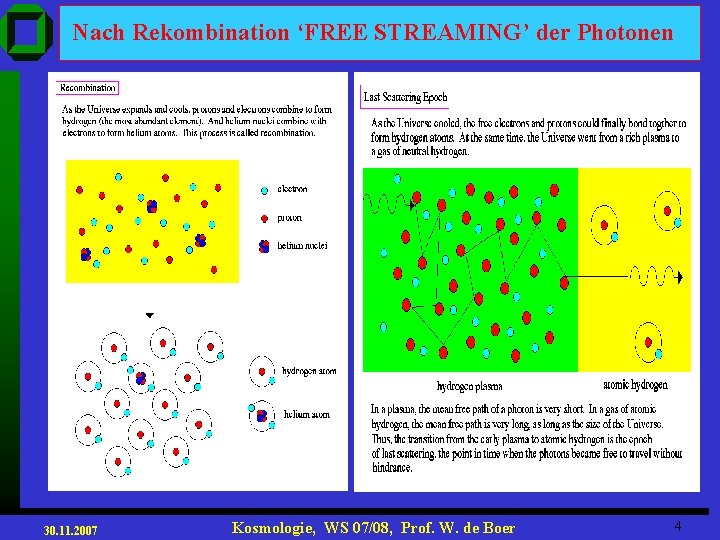
Nach Rekombination ‘FREE STREAMING’ der Photonen 30. 11. 2007 Kosmologie, WS 07/08, Prof. W. de Boer 4
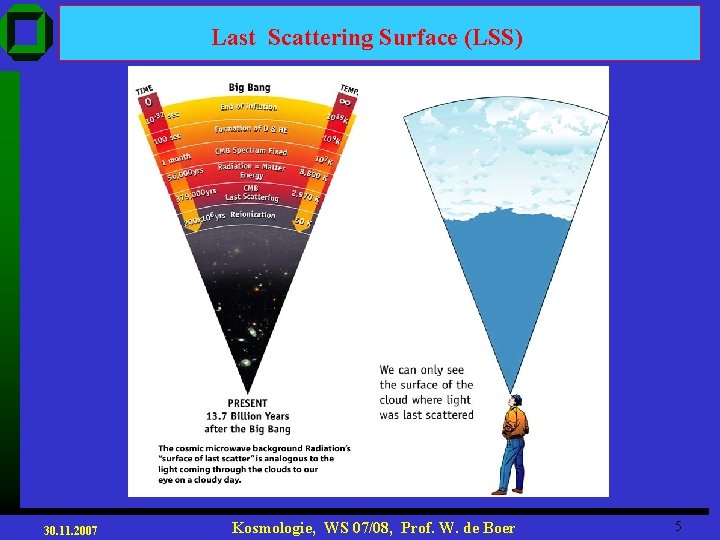
Last Scattering Surface (LSS) 30. 11. 2007 Kosmologie, WS 07/08, Prof. W. de Boer 5
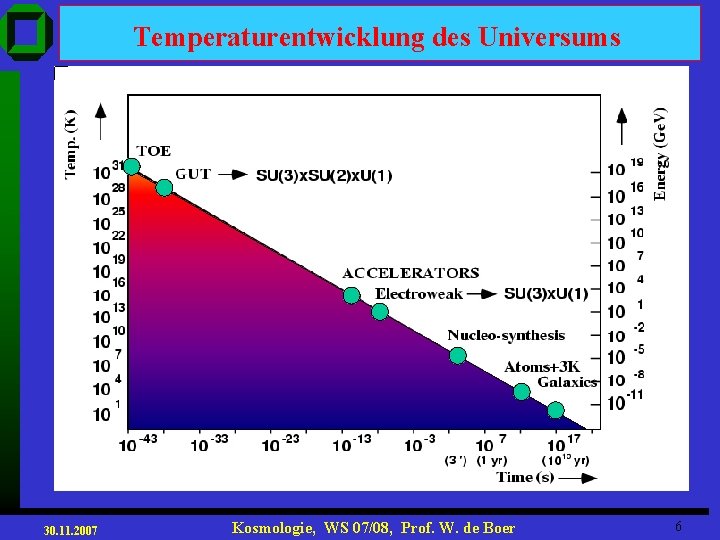
Temperaturentwicklung des Universums 30. 11. 2007 Kosmologie, WS 07/08, Prof. W. de Boer 6
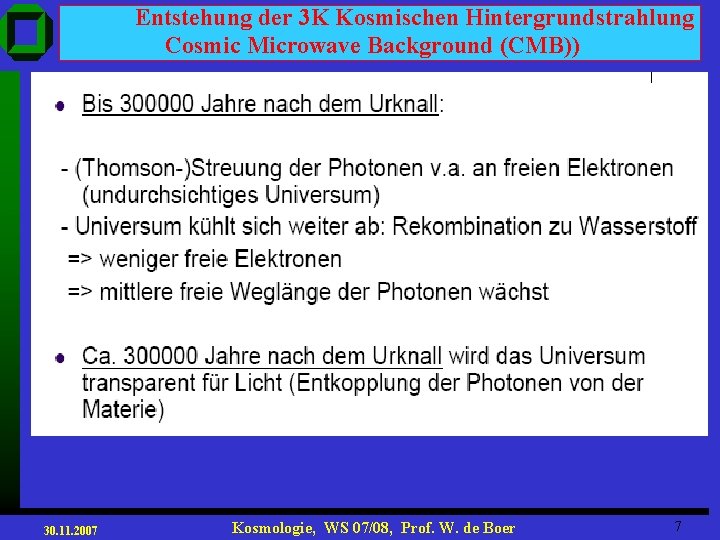
Entstehung der 3 K Kosmischen Hintergrundstrahlung Cosmic Microwave Background (CMB)) 30. 11. 2007 Kosmologie, WS 07/08, Prof. W. de Boer 7
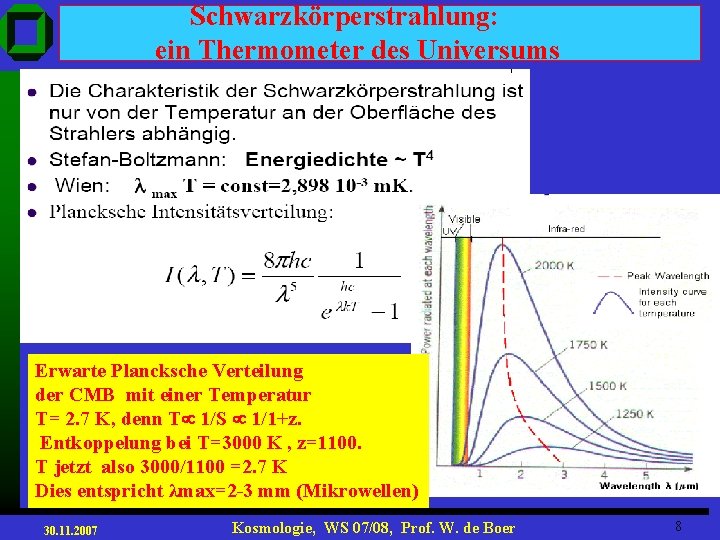
Schwarzkörperstrahlung: ein Thermometer des Universums Erwarte Plancksche Verteilung der CMB mit einer Temperatur T= 2. 7 K, denn T 1/S 1/1+z. Entkoppelung bei T=3000 K , z=1100. T jetzt also 3000/1100 =2. 7 K Dies entspricht λmax=2 -3 mm (Mikrowellen) 30. 11. 2007 Kosmologie, WS 07/08, Prof. W. de Boer 8
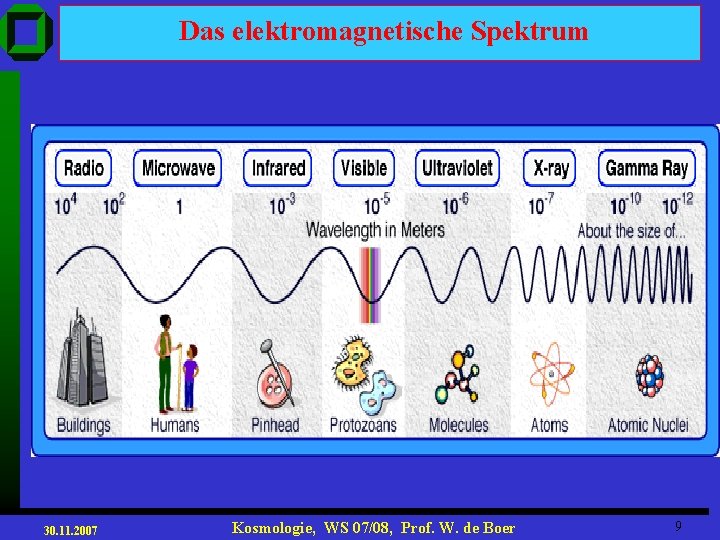
Das elektromagnetische Spektrum 30. 11. 2007 Kosmologie, WS 07/08, Prof. W. de Boer 9
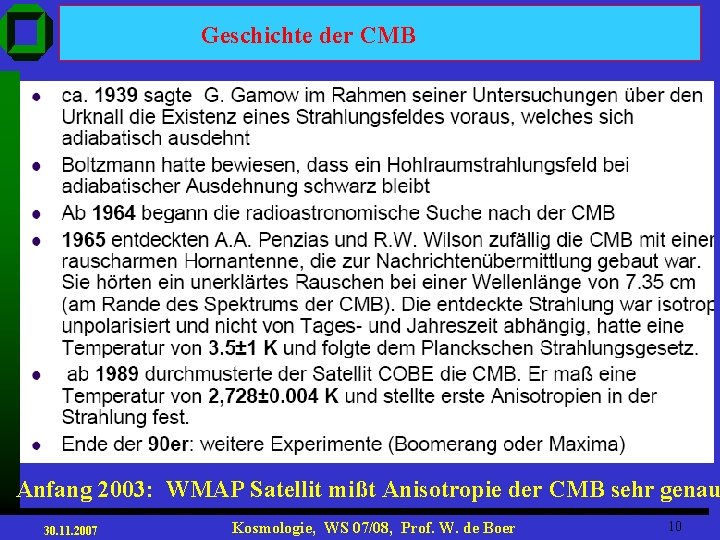
Geschichte der CMB Anfang 2003: WMAP Satellit mißt Anisotropie der CMB sehr genau 30. 11. 2007 Kosmologie, WS 07/08, Prof. W. de Boer 10
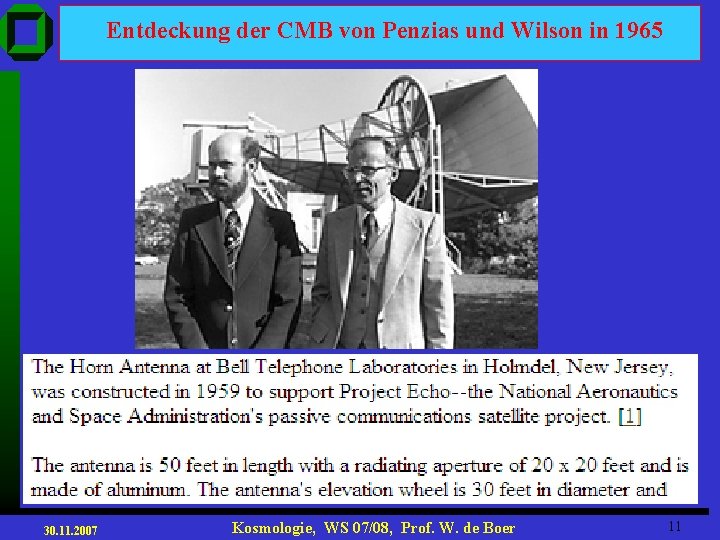
Entdeckung der CMB von Penzias und Wilson in 1965 30. 11. 2007 Kosmologie, WS 07/08, Prof. W. de Boer 11
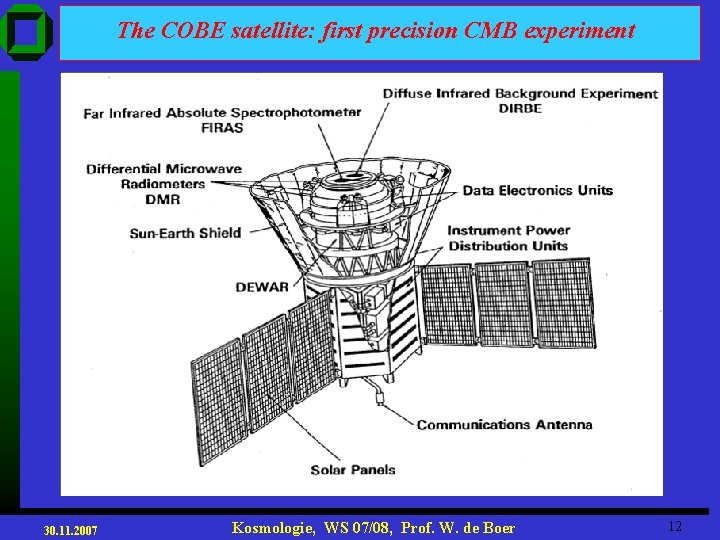
The COBE satellite: first precision CMB experiment 30. 11. 2007 Kosmologie, WS 07/08, Prof. W. de Boer 12
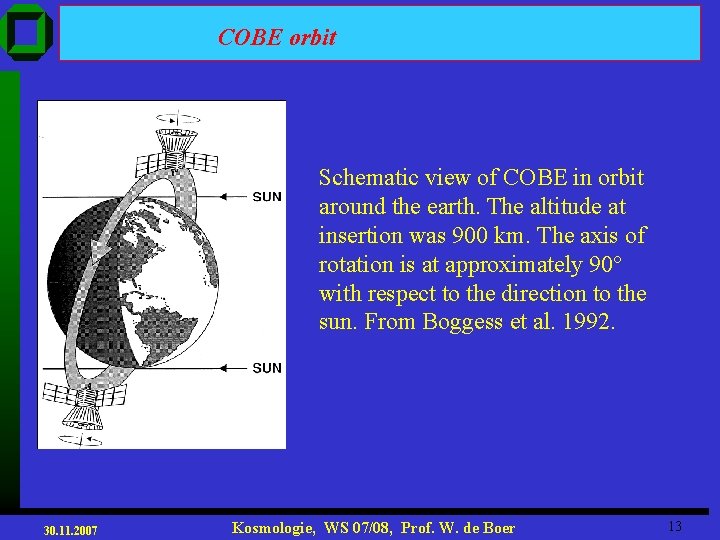
COBE orbit Schematic view of COBE in orbit around the earth. The altitude at insertion was 900 km. The axis of rotation is at approximately 90° with respect to the direction to the sun. From Boggess et al. 1992. 30. 11. 2007 Kosmologie, WS 07/08, Prof. W. de Boer 13
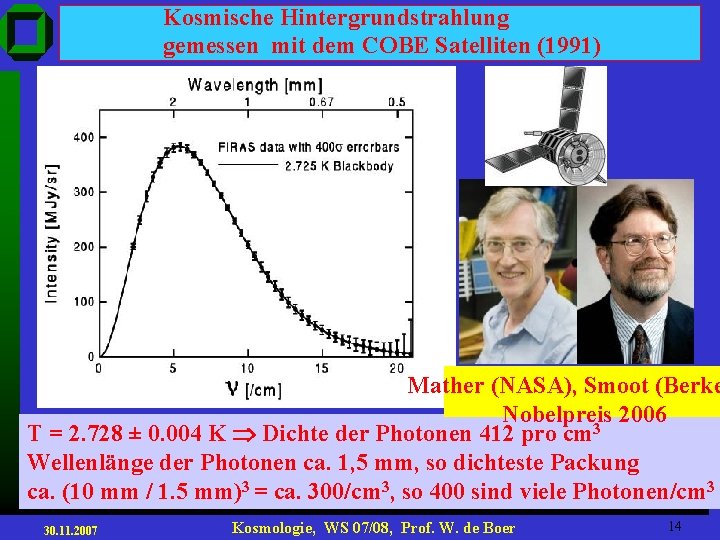
Kosmische Hintergrundstrahlung gemessen mit dem COBE Satelliten (1991) Mather (NASA), Smoot (Berke Nobelpreis 2006 T = 2. 728 ± 0. 004 K Dichte der Photonen 412 pro cm 3 Wellenlänge der Photonen ca. 1, 5 mm, so dichteste Packung ca. (10 mm / 1. 5 mm)3 = ca. 300/cm 3, so 400 sind viele Photonen/cm 3 30. 11. 2007 Kosmologie, WS 07/08, Prof. W. de Boer 14
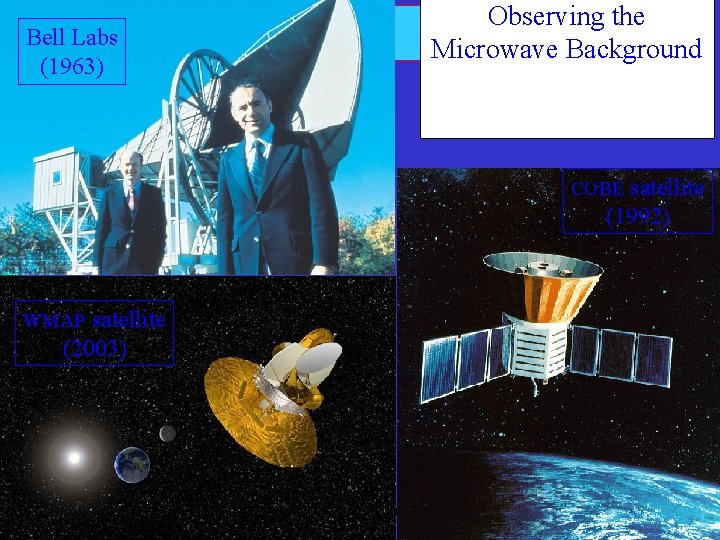
Bell Labs (1963) Observing the Microwave Background (highlights, there are many others) satellite (1992) COBE satellite (2003) WMAP 30. 11. 2007 Kosmologie, WS 07/08, Prof. W. de Boer 15
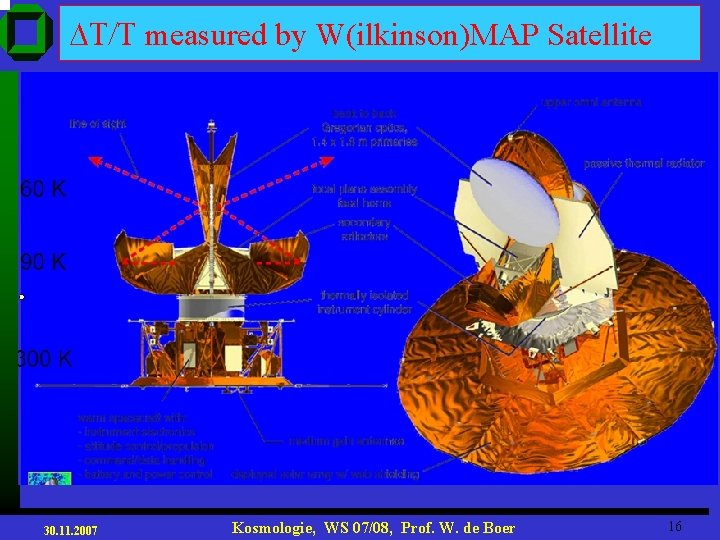
DT/T measured by W(ilkinson)MAP Satellite 60 K 90 K 30. 11. 2007 Kosmologie, WS 07/08, Prof. W. de Boer 16
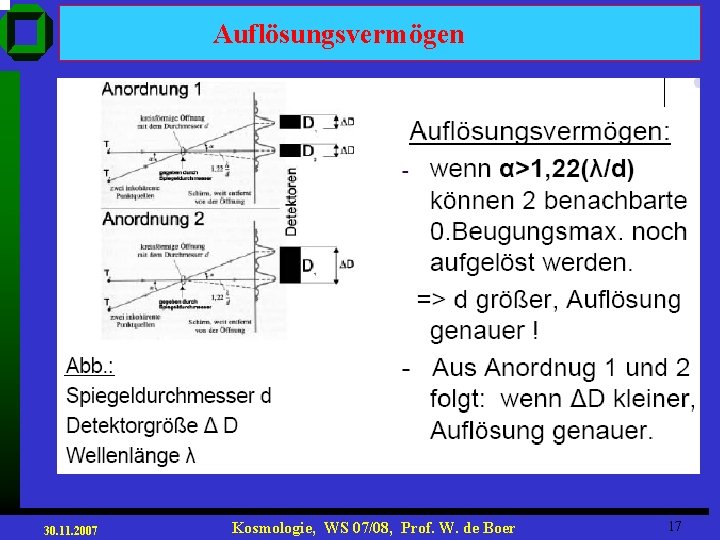
Auflösungsvermögen 30. 11. 2007 Kosmologie, WS 07/08, Prof. W. de Boer 17
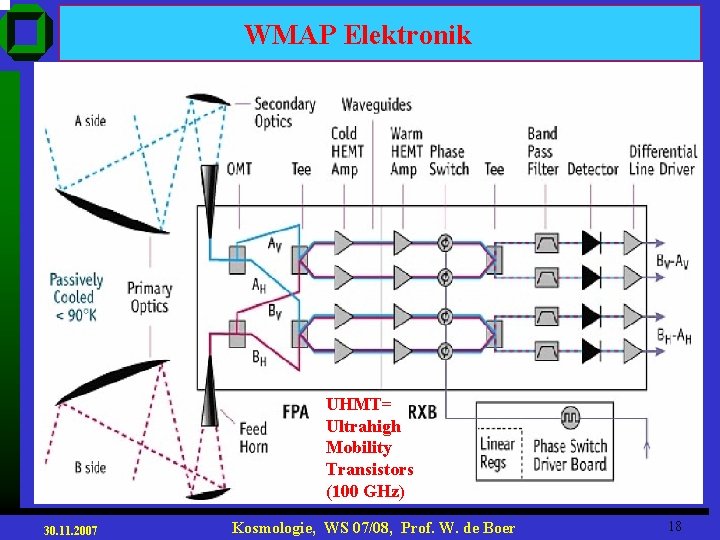
WMAP Elektronik UHMT= Ultrahigh Mobility Transistors (100 GHz) 30. 11. 2007 Kosmologie, WS 07/08, Prof. W. de Boer 18
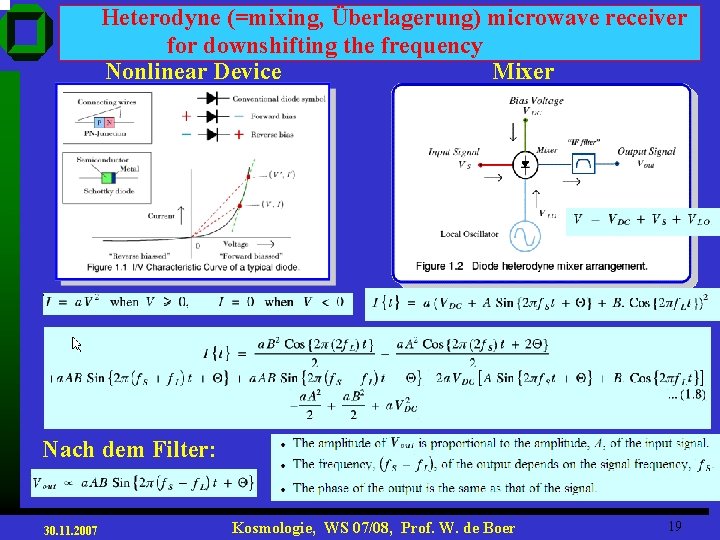
Heterodyne (=mixing, Überlagerung) microwave receiver for downshifting the frequency Nonlinear Device Mixer Nach dem Filter: 30. 11. 2007 Kosmologie, WS 07/08, Prof. W. de Boer 19
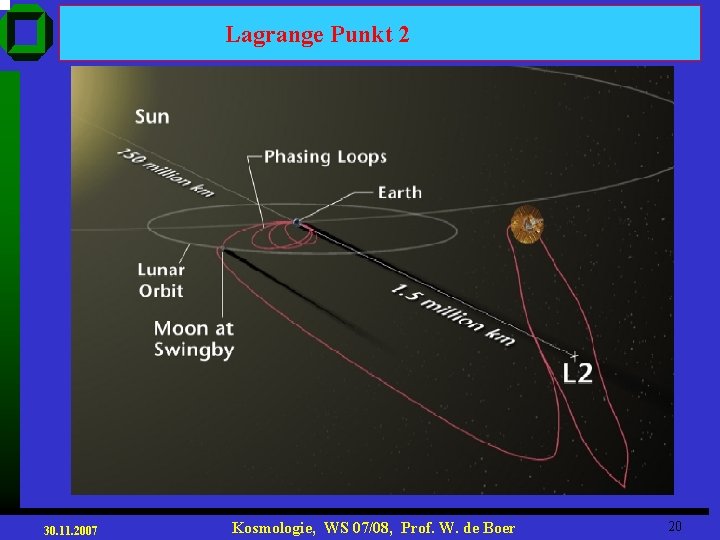
Lagrange Punkt 2 30. 11. 2007 Kosmologie, WS 07/08, Prof. W. de Boer 20
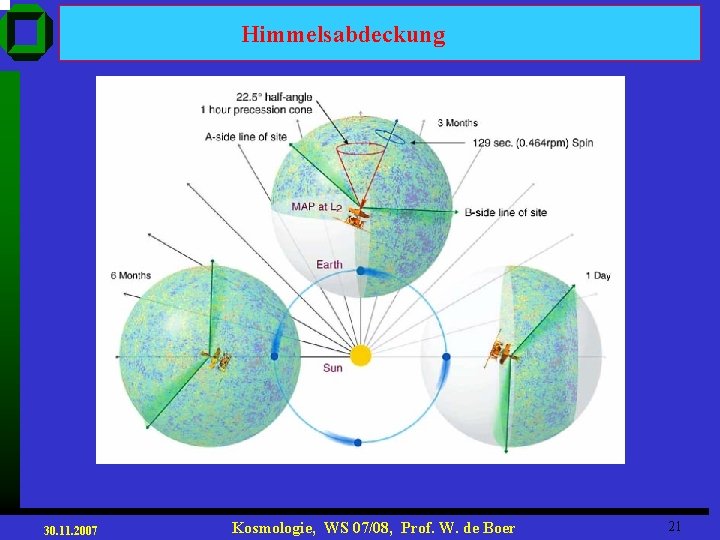
Himmelsabdeckung 30. 11. 2007 Kosmologie, WS 07/08, Prof. W. de Boer 21
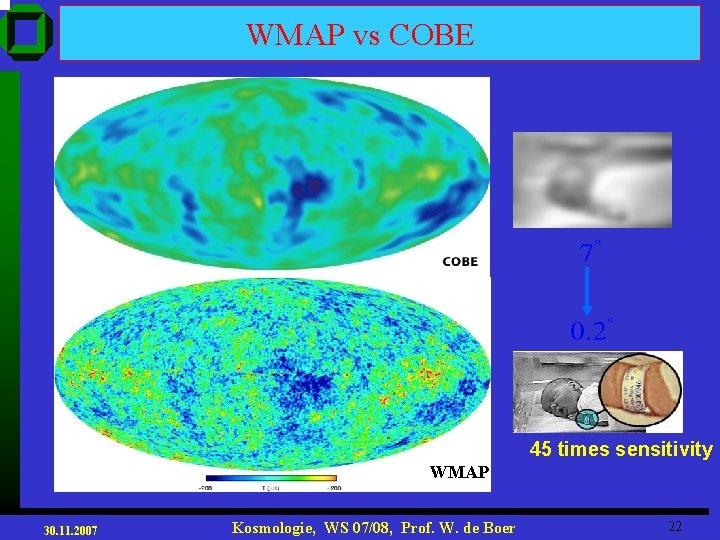
WMAP vs COBE 45 times sensitivity WMAP 30. 11. 2007 Kosmologie, WS 07/08, Prof. W. de Boer 22
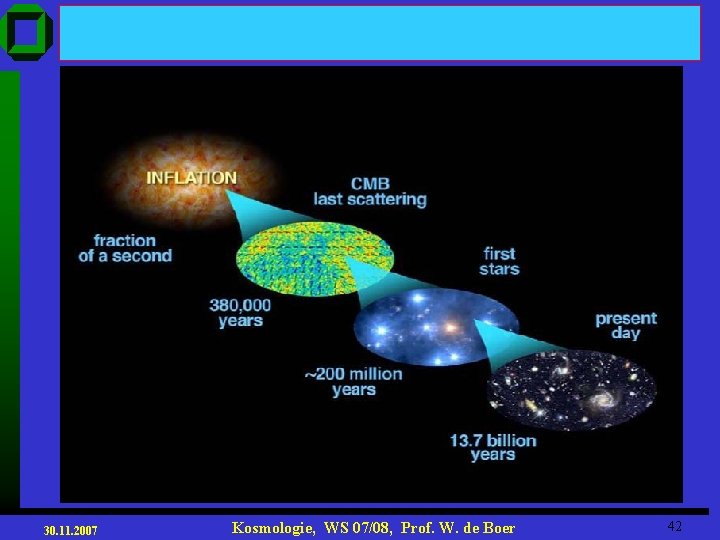
Cosmology and the Cosmic Microwave Background The Universe is approximately about 13. 7 billion years old, according to the standard cosmological Big Bang model. At this time, it was a state of high uniformity, was extremely hot and dense was filled with elementary particles and was expanding very rapidly. About 380, 000 years after the Big Bang, the energy of the photons had decreased and was not sufficient to ionise hydrogen atoms. Thereafter the photons “decoupled” from the other particles and could move through the Universe essentially unimpeded. The Universe has expanded and cooled ever since, leaving behind a remnant of its hot past, the Cosmic Microwave Background radiation (CMB). We observe this today as a 2. 7 K thermal blackbody radiation filling the entire Universe. Observations of the CMB give a unique and detailed information about the early Universe, thereby promoting cosmology to a precision science. Indeed, as will be discussed in more detail below, the CMB is probably the best recorded blackbody spectrum that exists. Removing a dipole anisotropy, most probably due our motion through the Universe, the CMB is isotropic to about one part in 100, 000. The 2006 Nobel Prize in physics highlights detailed observations of the CMB performed with the COBE (COsmic Background Explorer) satellite. From Nobel prize 2006 announcement 30. 11. 2007 Kosmologie, WS 07/08, Prof. W. de Boer 23
Early work The discovery of the cosmic microwave background radiation has an unusual and interesting history. The basic theories as well as the necessary experimental techniques were available long before the experimental discovery in 1964. The theory of an expanding Universe was first given by Friedmann (1922) and Lemaître (1927). An excellent account is given by Nobel laureate Steven Weinberg (1993). Around 1960, a few years before the discovery, two scenarios for the Universe were discussed. Was it expanding according to the Big Bang model, or was it in a steady state? Both models had their supporters and among the scientists advocating the latter were Hannes Alfvén (Nobel prize in physics 1970), Fred Hoyle and Dennis Sciama. If the Big Bang model was the correct one, an imprint of the radiation dominated early Universe must still exist, and several groups were looking for it. This radiation must be thermal, i. e. of blackbody form, and isotropic. 30. 11. 2007 Kosmologie, WS 07/08, Prof. W. de Boer 24
First observations of CMB The discovery of the cosmic microwave background by Penzias and Wilson in 1964 (Penzias and Wilson 1965, Penzias 1979, Wilson 1979, Dicke et al. 1965) came as a complete surprise to them while they were trying to understand the source of unexpected noise in their radio-receiver (they shared the 1978 Nobel prize in physics for the discovery). The radiation produced unexpected noise in their radio receivers. Some 16 years earlier Alpher, Gamow and Herman (Alpher and Herman 1949, Gamow 1946), had predicted that there should be a relic radiation field penetrating the Universe. It had been shown already in 1934 by Tolman (Tolman 1934) that the cooling blackbody radiation in an expanding Universe retains its blackbody form. It seems that neither Alpher, Gamow nor Herman succeeded in convincing experimentalists to use the characteristic blackbody form of the radiation to find it. In 1964, however, Doroshkevich and Novikov (Doroshkevich and Novikov 1964) published an article where they explicitly suggested a search for the radiation focusing on its blackbody characteristics. One can note that some measurements as early as 1940 had found that a radiation field was necessary to explain energy level transitions in interstellar molecules CN=Cyan (Mc. Kellar 1941). Following the 1964 discovery of the CMB, many, but not all, of the steady state proponents gave up, accepting the hot Big Bang model. The early theoretical work is discussed by Alpher, Herman and Gamow 1967, Penzias 1979, Wilkinson and Peebles 1983, Weinberg 1993, and Herman 1997. 30. 11. 2007 Kosmologie, WS 07/08, Prof. W. de Boer 25
Further observations of CMB Following the 1964 discovery, several independent measurements of the radiation were made by Wilkinson and others, using mostly balloon-borne, rocket-borne or ground based instruments. The intensity of the radiation has its maximum for a wavelength of about 2 mm where the absorption in the atmosphere is strong. Although most results gave support to the blackbody form, few measurements were available on the high frequency (low wavelength) side of the peak. Some measurements gave results that showed significant deviations from the blackbody form (Matsumoto et al. 1988). The CMB was expected to be largely isotropic. However, in order to explain the large scale structures in the form of galaxies and clusters of galaxies observed today, small anisotropies should exist. Gravitation can make small density fluctuations that are present in the early Universe grow and make galaxy formation possible. A very important and detailed general relativistic calculation by Sachs and Wolfe showed how three-dimensional density fluctuations can give rise to two-dimensional large angle (> 1°) temperature anisotropies in the cosmic microwave background radiation (Sachs and Wolfe 1967). 30. 11. 2007 Kosmologie, WS 07/08, Prof. W. de Boer 26
Dipol Anisotropy Because the earth moves relative to the CMB, a dipole temperature anisotropy of the level of ΔT/T = 10 -3 is expected. This was observed in the 1970’s (Conklin 1969, Henry 1971, Corey and Wilkinson 1976 and Smoot, Gorenstein and Muller 1977). During the 1970 -ties the anisotropies were expected to be of the order of 10 -2 – 10 -4, but were not observed experimentally. When dark matter was taken into account in the 1980 -ties, the predicted level of the fluctuations was lowered to about 10 -5, thereby posing a great experimental challenge. 30. 11. 2007 Kosmologie, WS 07/08, Prof. W. de Boer 27
The COBE mission Because of e. g. atmospheric absorption, it was long realized that measurements of the high frequency part of the CMB spectrum (wavelengths shorter than about 1 mm) should be performed from space. A satellite instrument also gives full sky coverage and a long observation time. The latter point is important for reducing systematic errors in the radiation measurements. A detailed account of measurements of the CMB is given in a review by Weiss (1980). The COBE story begins in 1974 when NASA made an announcement of opportunity for small experiments in astronomy. Following lengthy discussions with NASA Headquarters the COBE project was born and finally, on 18 November 1989, the COBE satellite was successfully launched into orbit. More than 1, 000 scientists, engineers and administrators were involved in the mission. COBE carried three instruments covering the wavelength range 1 μm to 1 cm to measure the anisotropy and spectrum of the CMB as well as the diffuse infrared background radiation: DIRBE (Diffuse Infra. Red Background Experiment), DMR (Differential Microwave Radiometer) and FIRAS (Far Infra. Red Absolute Spectrophotometer). COBE’s mission was to measure the CMB over the entire sky, which was possible with the chosen satellite orbit. All previous measurements from ground were done with limited sky coverage. John Mather was the COBE Principal Investigator and the project leader from the start. He was also responsible for the FIRAS instrument. George Smoot was the DMR principal investigator and Mike Hauser was the DIRBE principal investigator. 28 Kosmologie, WS 07/08, Prof. W. de Boer 30. 11. 2007
The COBE mission For DMR the objective was to search for anisotropies at three wavelengths, 3 mm, 6 mm, and 10 mm in the CMB with an angular resolution of about 7°. The anisotropies postulated to explain the large scale structures in the Universe should be present between regions covering large angles. For FIRAS the objective was to measure the spectral distribution of the CMB in the range 0. 1 – 10 mm and compare it with the blackbody form expected in the Big Bang model, which is different from, e. g. , the forms expected from starlight or bremsstrahlung. For DIRBE, the objective was to measure the infrared background radiation. The mission, spacecraft and instruments are described in detail by Boggess et al. 1992. Figures 1 and 2 show the COBE orbit and the satellite, respectively. 30. 11. 2007 Kosmologie, WS 07/08, Prof. W. de Boer 29
The COBE success COBE was a success. All instruments worked very well and the results, in particular those from DMR and FIRAS, contributed significantly to make cosmology a precision science. Predictions of the Big Bang model were confirmed: temperature fluctuations of the order of 10 -5 were found and the background radiation with a temperature of 2. 725 K followed very precisely a blackbody spectrum. DIRBE made important observations of the infrared background. The announcement of the discovery of the anisotropies was met with great enthusiasm worldwide. 30. 11. 2007 Kosmologie, WS 07/08, Prof. W. de Boer 30
CMB Anisotropies The DMR instrument (Smoot et al. 1990) measured temperature fluctuations of the order of 10 -5 for three CMB frequencies, 90, 53 and 31. 5 GHz (wavelengths 3. 3, 5. 7 and 9. 5 mm), chosen near the CMB intensity maximum and where the galactic background was low. The angular resolution was about 7°. After a careful elimination of instrumental background, the data showed a background contribution from the Milky Way, the known dipole amplitude ΔT/T = 10 -3 probably caused by the Earth’s motion in the CMB, and a significant long sought after quadrupole amplitude, predicted in 1965 by Sachs and Wolfe. The first results were published in 1992. The data showed scale invariance for large angles, in agreement with predictions from inflation models. Figure 5 shows the measured temperature fluctuations in galactic coordinates, a figure that has appeared in slightly different forms in many journals. The RMS cosmic quadrupole amplitude was estimated at 13 ± 4 μK (ΔT/T = 5× 10 -6) with a systematic error of at most 3 μK (Smoot et al. 1992). The DMR anisotropies were compared and found to agree with models of structure formation by Wright et al. 1992. The full 4 year DMR observations were published in 1996 (see Bennett et al. 1996). COBE’s results were soon confirmed by a number of balloon-borne experiments, and, more recently, by the 1° resolution WMAP (Wilkinson Microwave Anisotropy Probe) satellite, launched in 2001 (Bennett et al. 2003). 30. 11. 2007 Kosmologie, WS 07/08, Prof. W. de Boer 31
Outlook The 1964 discovery of the cosmic microwave background had a large impact on cosmology. The COBE results of 1992, giving strong support to the Big Bang model, gave a much more detailed view, and cosmology turned into a precision science. New ambitious experiments were started and the rate of publishing papers increased by an order of magnitude. Our understanding of the evolution of the Universe rests on a number of observations, including (before COBE) the darkness of the night sky, the dominance of hydrogen and helium over heavier elements, the Hubble expansion and the existence of the CMB. COBE’s observation of the blackbody form of the CMB and the associated small temperature fluctuations gave very strong support to the Big Bang model in proving the cosmological origin of the CMB and finding the primordial seeds of the large structures observed today. However, while the basic notion of an expanding Universe is well established, fundamental questions remain, especially about very early times, where a nearly exponential expansion, inflation, is proposed. This elegantly explains many cosmological questions. However, there are other competing theories. Inflation may have generated gravitational waves that in some cases could be detected indirectly by measuring the CMB polarization. Figure 8 shows the different stages in the evolution of the Universe according to the standard cosmological model. The first stages after the Big Bang are still speculations. 30. 11. 2007 Kosmologie, WS 07/08, Prof. W. de Boer 32
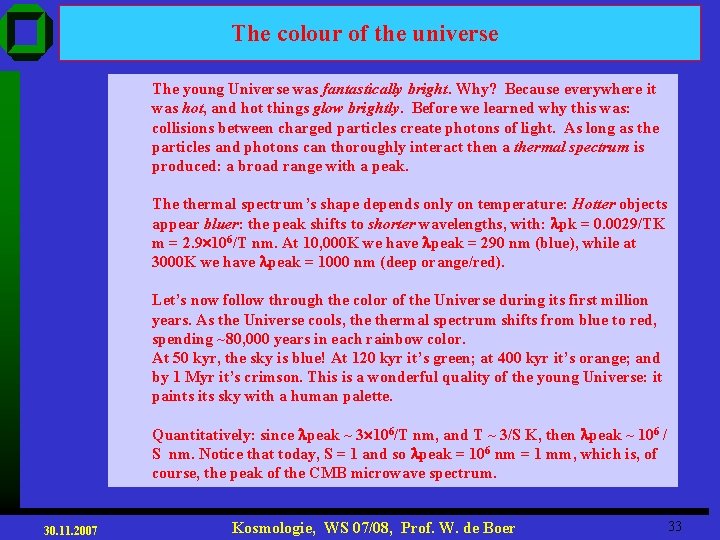
The colour of the universe The young Universe was fantastically bright. Why? Because everywhere it was hot, and hot things glow brightly. Before we learned why this was: collisions between charged particles create photons of light. As long as the particles and photons can thoroughly interact then a thermal spectrum is produced: a broad range with a peak. The thermal spectrum’s shape depends only on temperature: Hotter objects appear bluer: the peak shifts to shorter wavelengths, with: pk = 0. 0029/TK m = 2. 9 106/T nm. At 10, 000 K we have peak = 290 nm (blue), while at 3000 K we have peak = 1000 nm (deep orange/red). Let’s now follow through the color of the Universe during its first million years. As the Universe cools, thermal spectrum shifts from blue to red, spending ~80, 000 years in each rainbow color. At 50 kyr, the sky is blue! At 120 kyr it’s green; at 400 kyr it’s orange; and by 1 Myr it’s crimson. This is a wonderful quality of the young Universe: it paints its sky with a human palette. Quantitatively: since peak ~ 3 106/T nm, and T ~ 3/S K, then peak ~ 106 / S nm. Notice that today, S = 1 and so peak = 106 nm = 1 mm, which is, of course, the peak of the CMB microwave spectrum. 30. 11. 2007 Kosmologie, WS 07/08, Prof. W. de Boer 33
Light Intensity Hotter objects appear brighter. There are two reasons for this: More violent particle collisions make more energetic photons. Converting pk ~ 0. 003/T m to the equivalent energy units, it turns out that in a thermal spectrum, the average photon energy is ~ k. T. So, for systems in thermal equilibrium, the mean energy per particle or per photon is ~k. T. Faster particles collide more frequently, so make more photons. In fact the number density of photons, nph T 3. Combining these, we find that the intensity of thermal radiation increases dramatically with temperature Itot = 2. 2 10 -7 T 4 Watt /m 2 inside a gas at temperature T. At high temperatures, thermal radiation has awesome power – the multitude of particle collisions is incredibly efficient at creating photons. To help feel this, consider the light falling on you from a noontime sun – 1400 Watt/m 2 – enough to feel sunburned quite quickly. Let’s write this as Isun. Float in outer space, exposed only to the CMB, and you experience a radiation field of I 3 K = 2. 2 10 -7 2. 74 = 10 W/m 2 = 10 -8 Isun – not much! Here on Earth at 300 K we have I 300 K ~ 1. 8 k. W/m 2 (fortunately, our body temperature is 309 K so you radiate 2. 0 k. W/m 2, and don’t quickly boil!). A blast furnace at 1500 C (~1800 K) has I 1800 K = 2. 3 MW/m 2 = 1600 Isun (you boil away in ~1 minute). At the time of the CMB (380 kyr), the radiation intensity was I 3000 K = 17 MW/m 2 = 12, 000 Isun – you evaporate in 10 seconds. In the Sun’s atmosphere, we have I 5800 K = 250 MW/m 2 = 210, 000 Isun. That’s a major city’s power usage, falling on each square meter. Radiation in the Sun’s 14 million K core has: I = 8 1021 W/m 2 ~ 1019 Isun (you boil away in much less than a nano-second). 34 Kosmologie, WS 07/08, Prof. W. de Boer 30. 11. 2007

Warum ist die CMB so wichtig in der Kosmologie? a) Die CMB beweist, dass das Universum früher heiß war und das die Temperaturentwicklung verstand ist b) Alle Wellenlängen ab eine bestimmte Länge (=oberhalb den akustischen Wellenlängen) kommen alle gleich stark vor, wie von der Inflation vorhergesagt. c) Bei kleinen Wellenlängen (akustische Wellen) zeigen ein sehr spezifisches Leistungsspektrum, woraus man schließen kann, dass das Universum FLACH ist und die baryonische Dichte nur 4 -5% der Gesamtdichte ausmacht. 30. 11. 2007 Kosmologie, WS 07/08, Prof. W. de Boer 35
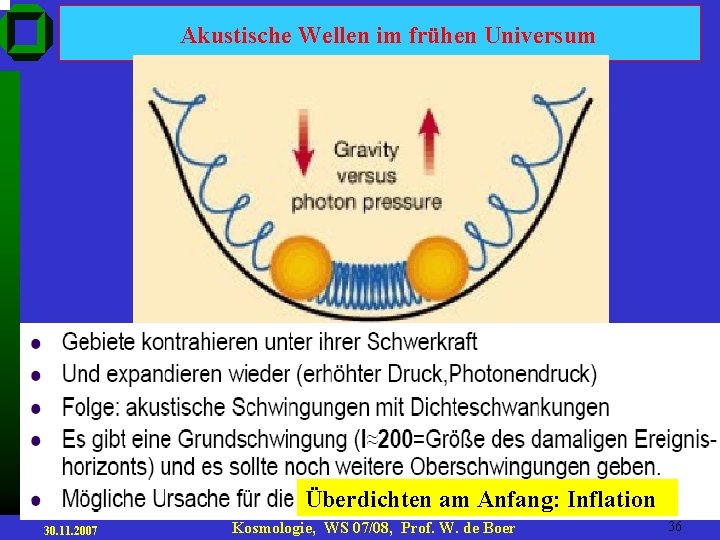
Akustische Wellen im frühen Universum Überdichten am Anfang: Inflation 30. 11. 2007 Kosmologie, WS 07/08, Prof. W. de Boer 36
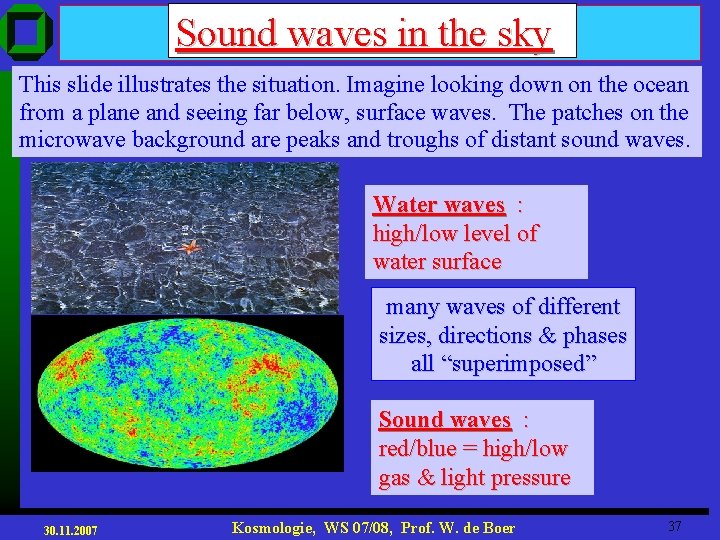
Sound waves in the sky This slide illustrates the situation. Imagine looking down on the ocean from a plane and seeing far below, surface waves. The patches on the microwave background are peaks and troughs of distant sound waves. Water waves : high/low level of water surface many waves of different sizes, directions & phases all “superimposed” Sound waves : red/blue = high/low gas & light pressure 30. 11. 2007 Kosmologie, WS 07/08, Prof. W. de Boer 37
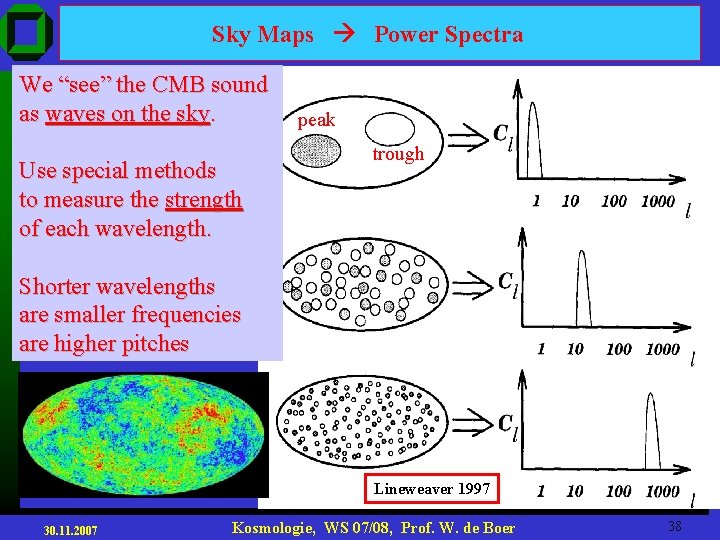
Sky Maps Power Spectra We “see” the CMB sound as waves on the sky. Use special methods to measure the strength of each wavelength. peak trough Shorter wavelengths are smaller frequencies are higher pitches Lineweaver 1997 30. 11. 2007 Kosmologie, WS 07/08, Prof. W. de Boer 38
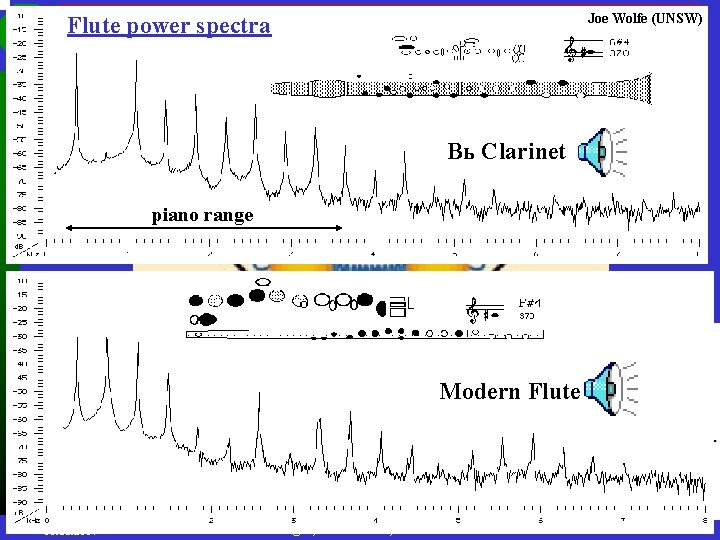
Flute power. Akustische spectra Wellen im frühen Universum. Joe Wolfe (UNSW) Bь Clarinet piano range Modern Flute Überdichten am Anfang: Inflation 30. 11. 2007 Kosmologie, WS 07/08, Prof. W. de Boer 39
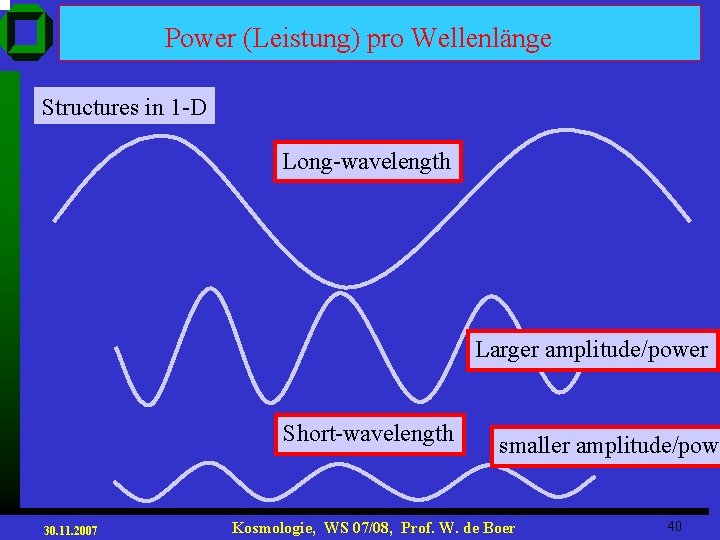
Power (Leistung) pro Wellenlänge Structures in 1 -D Long-wavelength Larger amplitude/power Short-wavelength 30. 11. 2007 smaller amplitude/powe Kosmologie, WS 07/08, Prof. W. de Boer 40
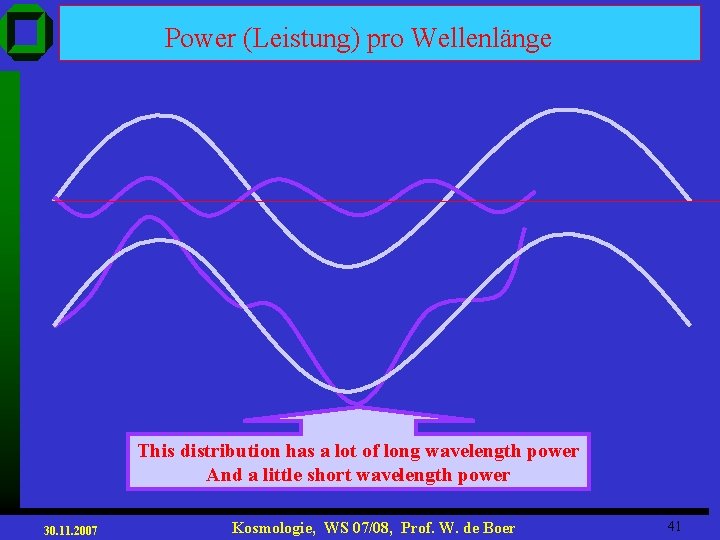
Power (Leistung) pro Wellenlänge This distribution has a lot of long wavelength power And a little short wavelength power 30. 11. 2007 Kosmologie, WS 07/08, Prof. W. de Boer 41
30. 11. 2007 Kosmologie, WS 07/08, Prof. W. de Boer 42
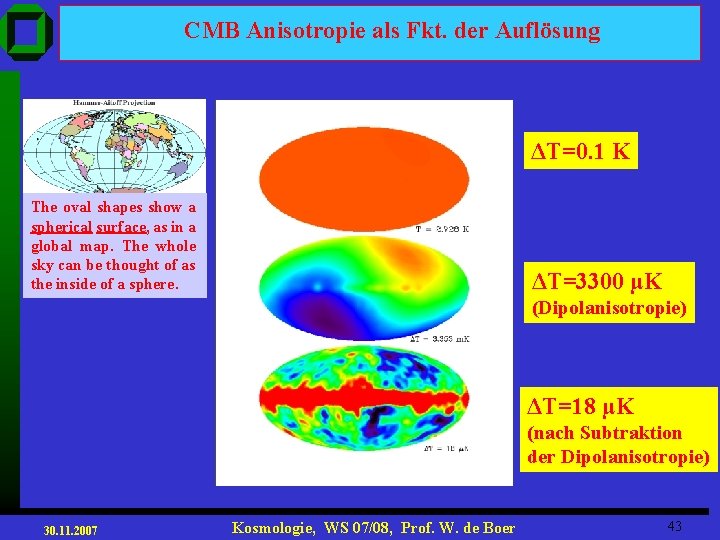
CMB Anisotropie als Fkt. der Auflösung ΔT=0. 1 K The oval shapes show a spherical surface, as in a global map. The whole sky can be thought of as the inside of a sphere. ΔT=3300 µK (Dipolanisotropie) ΔT=18 µK (nach Subtraktion der Dipolanisotropie) 30. 11. 2007 Kosmologie, WS 07/08, Prof. W. de Boer 43
Mark Whittle University of Virginia http: //www. astro. virginia. edu/~dmw 8 f See also: “full presentation” Viele Plots und sounds von Whittles Webseite 30. 11. 2007 Kosmologie, WS 07/08, Prof. W. de Boer 44
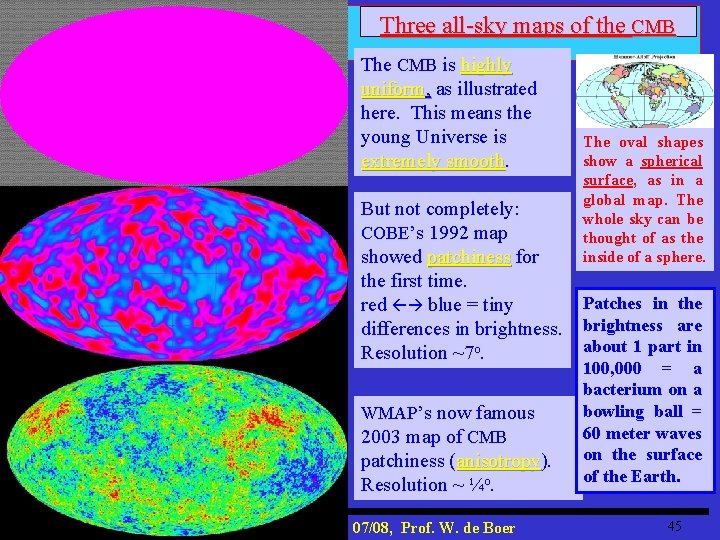
Three all-sky maps of the CMB The CMB is highly uniform, as illustrated here. This means the young Universe is extremely smooth But not completely: COBE’s 1992 map showed patchiness for the first time. red blue = tiny differences in brightness. Resolution ~7 o. WMAP’s now famous 2003 map of CMB patchiness (anisotropy). anisotropy Resolution ~ ¼o. 30. 11. 2007 Kosmologie, WS 07/08, Prof. W. de Boer The oval shapes show a spherical surface, as in a global map. The whole sky can be thought of as the inside of a sphere. Patches in the brightness are about 1 part in 100, 000 = a bacterium on a bowling ball = 60 meter waves on the surface of the Earth. 45
Sound in space !? ! • Surely, the vacuum of “space” must be silent ? Not for the young Universe: • Shortly after the big bang (eg @ CMB: 380, 000 yrs) • • • all matter is spread out evenly (no stars or galaxies yet) Universe is smaller everything closer together (by × 1000) the density is much higher (by × 109 = a billion) 7 trillion photons & 7000 protons/electrons per cubic inch all at 5400ºF with pressure 10 -7 (ten millionth) Earth’s atm. There is a hot thin atmosphere for sound waves • • unusual fluid intimate mix of gas & light sound waves propagate at ~50% speed of light 30. 11. 2007 Kosmologie, WS 07/08, Prof. W. de Boer 46
Big Bang Akustik http: //astsun. astro. virginia. edu/~dmw 8 f/teachco/ While the universe was still foggy, atomic matter was trapped by light's pressure and prevented from clumping up. In fact, this high-pressure gas of light and atomic matter responds to the pull of gravity like air responds in an organ pipe – it bounces in and out to make sound waves. This half-million year acoustic era is a truly remarkable and useful period of cosmic history. To understand it better, we'll discuss the sound's pitch, volume, and spectral form, and explain how these sound waves are visible as faint patches on the Cosmic Microwave Background. Perhaps most bizarre: analyzing the CMB patchiness reveals in the primordial sound a fundamental and harmonics – the young Universe behaves like a musical instrument! We will, of course, hear acoustic versions, suitably modified for human ears. 30. 11. 2007 Kosmologie, WS 07/08, Prof. W. de Boer 47
Akustik Ära Since it is light which provides the pressure, the speed of pressure waves (sound) is incredibly fast: vs ~ 0. 6 c! This makes sense: the gas is incredibly lightweight compared to its pressure, so the pressure force moves the gas very easily. Equivalently, the photon speeds are, of course, c – hence vs ~ c. In summary: we have an extremely lightweight foggy gas of brilliant light and a trace of particles, all behaving as a single fluid with modest pressure and very high sound speed. With light dominating the pressure, the primordial sound waves can also be thought of as great surges in light’s brilliance. After recombination, photons and particles decouple; the pressure drops by 10 -9 and sound ceases. The acoustic era only lasts 400 kyr, and is then over. 30. 11. 2007 Kosmologie, WS 07/08, Prof. W. de Boer 48
Where the sound comes from? A too-quick answer might be: “of course there’s sound, it was a “big bang” after all, and the explosion must have been very loud”. This is completely wrong. The big bang was not an explosion into an atmosphere; it was an expansion of space itself. The Hubble law tells us that every point recedes from every other – there is no compression – no sound. Paradoxically, the big bang was totally silent! How, then, does sound get started? Later we’ll learn that although the Universe was born silent, it was also born very slightly lumpy. On all scales, from tiny to gargantuan, there are slight variations in density, randomly scattered, everywhere – a 3 D mottle of slight peaks and troughs in density. We’ll learn how this roughness grows over time, but for now just accept this framework. The most important component for generating sound is dark matter. Recall that after equality ( m = r at 57 kyr) dark matter dominates the density, so it determines the gravitational landscape. 30. 11. 2007 Kosmologie, WS 07/08, Prof. W. de Boer 49
Where the sound comes from? Everywhere, the photon-baryon gas feels the pull of dark matter. How does it respond? It begins to “fall” towards the over-dense regions, and away from the under-dense regions. Soon, however, its pressure is higher in the over-dense regions and this halts and reverses the motion; pushing the gas back out. This time it overshoots, only to turn around and fall back in again. The cycle repeats, and we have a sound wave! The situation resembles a spherical organ pipe: gas bounces in and out of a roughly spherical region. [One caveat: “falling in” and “bouncing out” of the regions is only relative to the overall expansion, which continues throughout the acoustic era. ] Notice there is a quite different behavior between dark matter and the photon-baryon gas. Because the dark matter has no pressure (it interacts with nothing, not even itself), it is free to clump up under its own gravity. In contrast, the photon-baryon gas has pressure, which tries to keep it uniform (like air in a room). However, in the lumpy gravitational field of dark matter, it falls and bounces this way and that in a continuing oscillation. 30. 11. 2007 Kosmologie, WS 07/08, Prof. W. de Boer 50
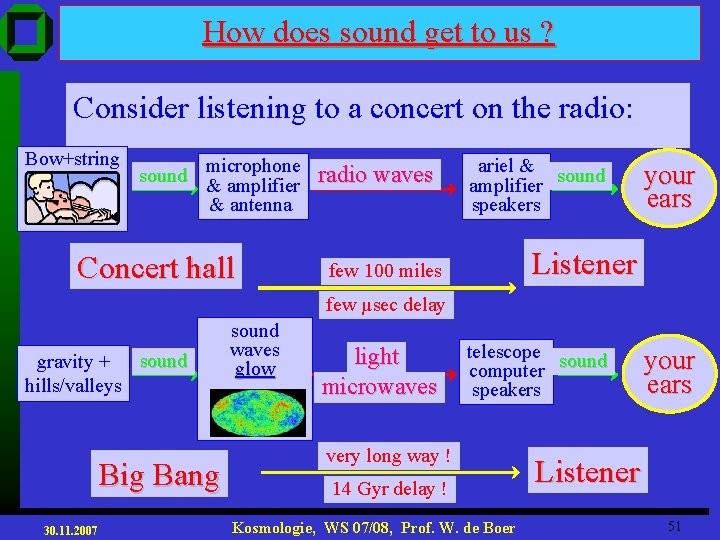
How does sound get to us ? Consider listening to a concert on the radio: Bow+string sound microphone & amplifier & antenna Concert hall radio waves ariel & sound amplifier speakers your ears Listener few 100 miles few µsec delay gravity + sound hills/valleys Big Bang 30. 11. 2007 sound waves glow light microwaves telescope sound computer speakers very long way ! 14 Gyr delay ! Kosmologie, WS 07/08, Prof. W. de Boer your ears Listener 51
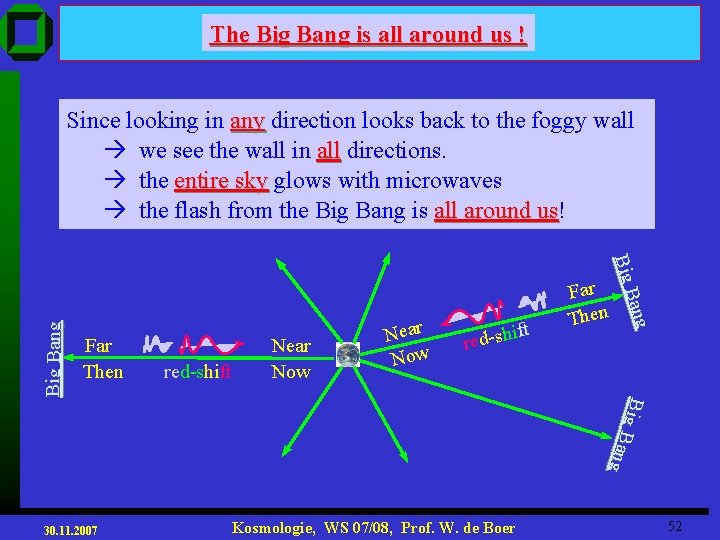
The Big Bang is all around us ! Far Then red-shift Near Now ft i h s d re Far Then Ba ng Big Bang Since looking in any direction looks back to the foggy wall we see the wall in all directions. the entire sky glows with microwaves the flash from the Big Bang is all around us! us Big B a ng 30. 11. 2007 Kosmologie, WS 07/08, Prof. W. de Boer 52
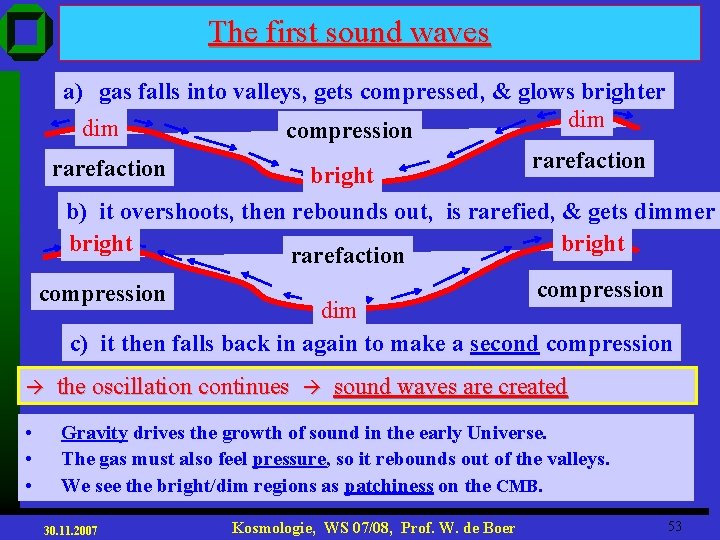
The first sound waves a) gas falls into valleys, gets compressed, & glows brighter dim compression rarefaction bright b) it overshoots, then rebounds out, is rarefied, & gets dimmer bright rarefaction compression dim c) it then falls back in again to make a second compression the oscillation continues sound waves are created • • • Gravity drives the growth of sound in the early Universe. The gas must also feel pressure, so it rebounds out of the valleys. We see the bright/dim regions as patchiness on the CMB. 30. 11. 2007 Kosmologie, WS 07/08, Prof. W. de Boer 53
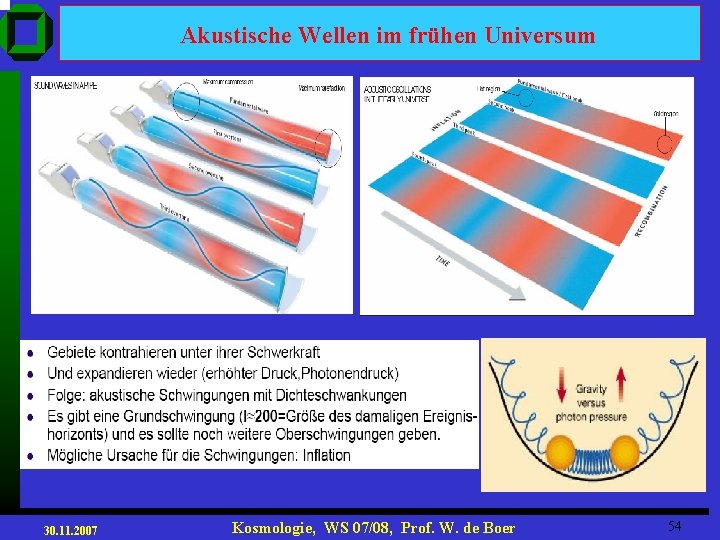
Akustische Wellen im frühen Universum 30. 11. 2007 Kosmologie, WS 07/08, Prof. W. de Boer 54
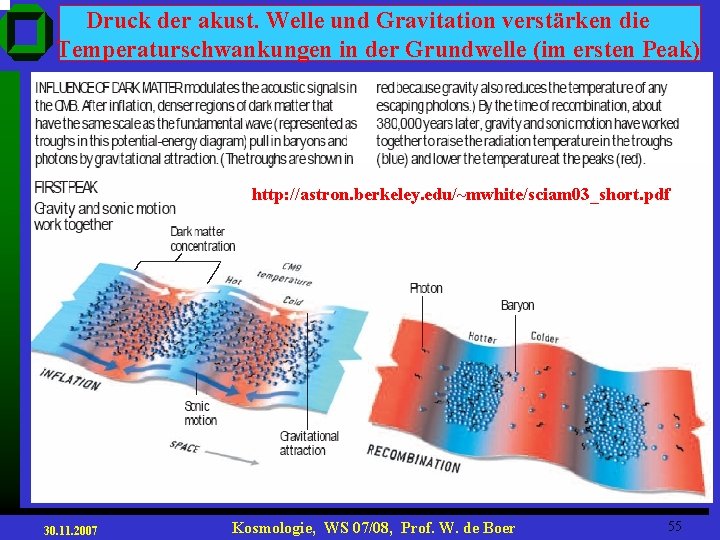
Druck der akust. Welle und Gravitation verstärken die Temperaturschwankungen in der Grundwelle (im ersten Peak) http: //astron. berkeley. edu/~mwhite/sciam 03_short. pdf 30. 11. 2007 Kosmologie, WS 07/08, Prof. W. de Boer 55
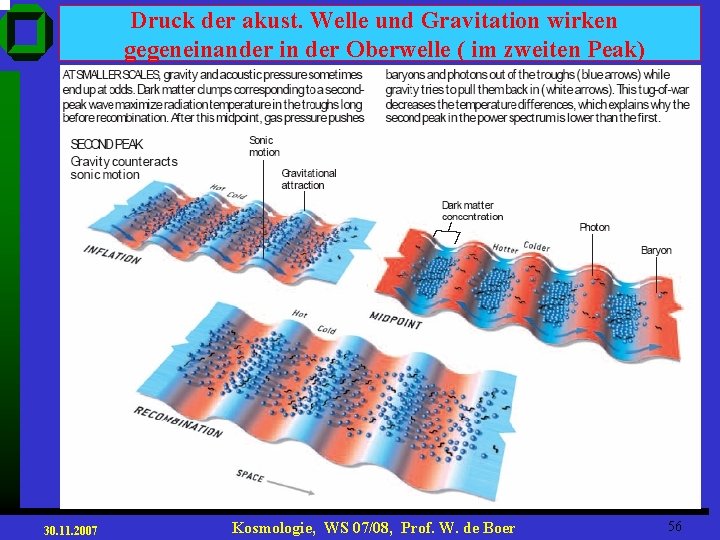
Druck der akust. Welle und Gravitation wirken gegeneinander in der Oberwelle ( im zweiten Peak) 30. 11. 2007 Kosmologie, WS 07/08, Prof. W. de Boer 56
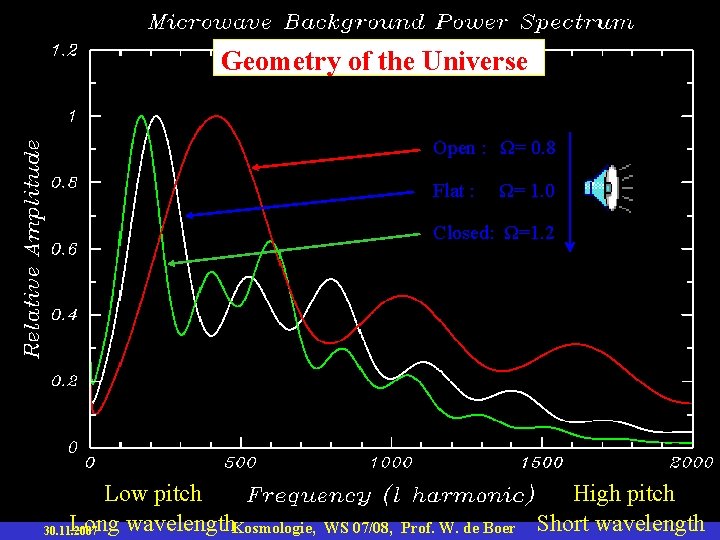
Geometry of the Universe Open : Ω= 0. 8 Flat : Ω= 1. 0 Closed: Ω=1. 2 Low pitch Long wavelength. Kosmologie, 30. 11. 2007 WS 07/08, Prof. W. de Boer High pitch Short wavelength 57
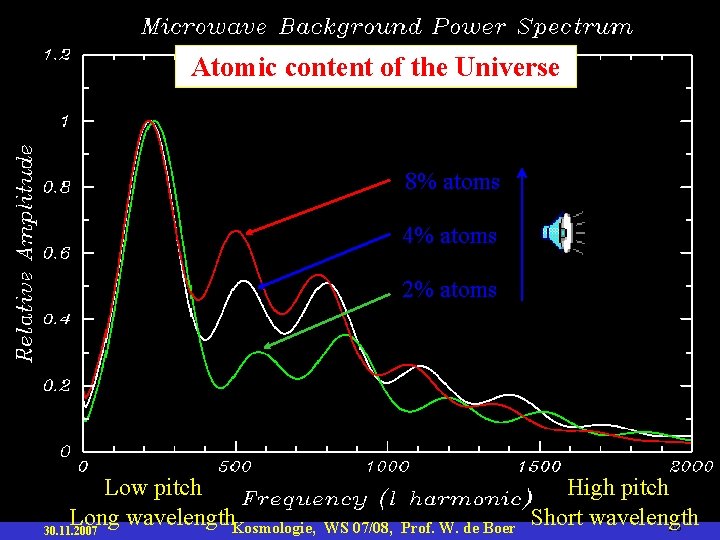
Atomic content of the Universe 8% atoms 4% atoms 2% atoms Low pitch Long wavelength. Kosmologie, 30. 11. 2007 WS 07/08, Prof. W. de Boer High pitch Short wavelength 58
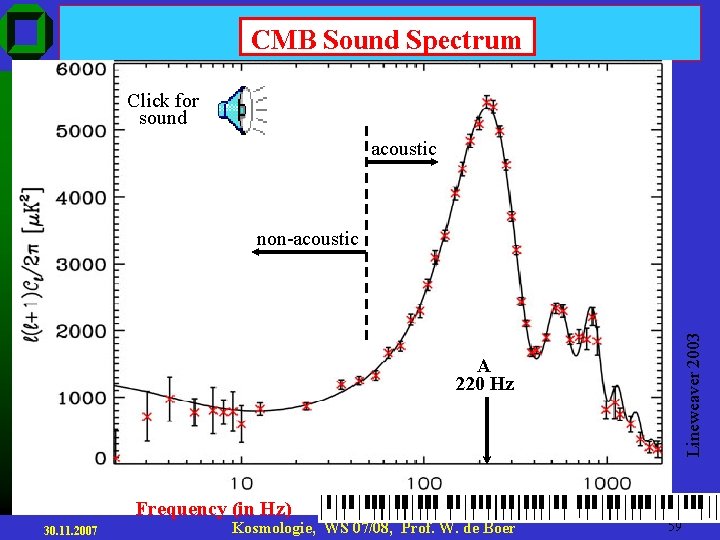
CMB Sound Spectrum Click for sound acoustic Lineweaver 2003 non-acoustic A 220 Hz Frequency (in Hz) 30. 11. 2007 Kosmologie, WS 07/08, Prof. W. de Boer 59
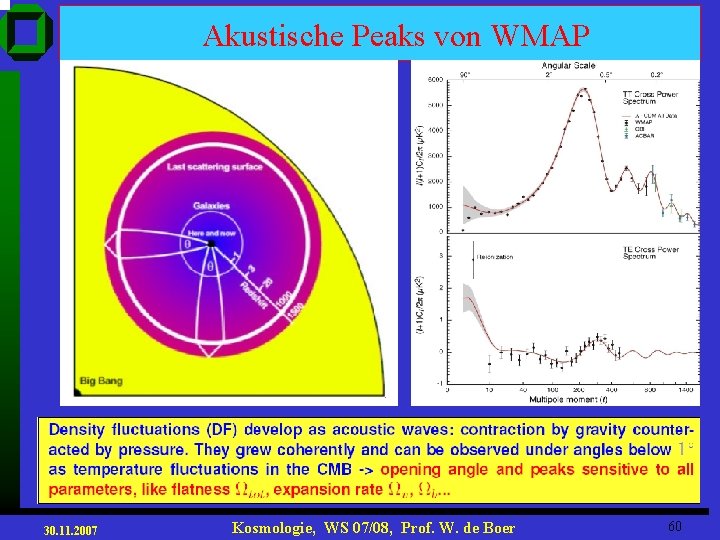
Akustische Peaks von WMAP 30. 11. 2007 Kosmologie, WS 07/08, Prof. W. de Boer 60
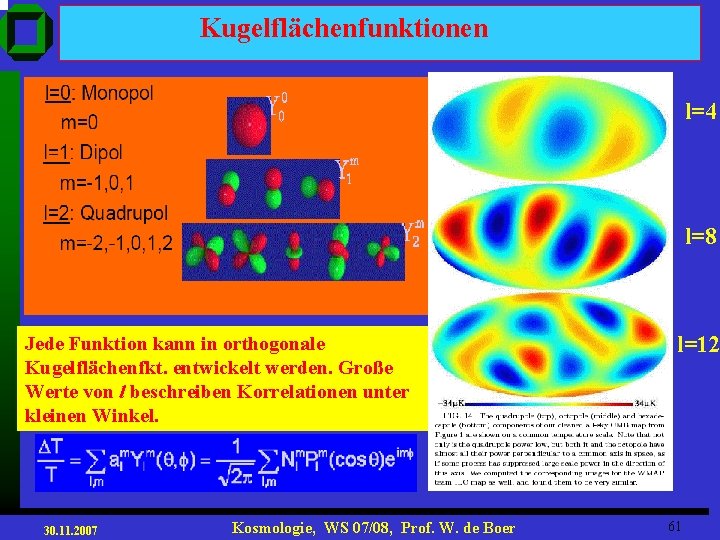
Kugelflächenfunktionen l=4 l=8 Jede Funktion kann in orthogonale Kugelflächenfkt. entwickelt werden. Große Werte von l beschreiben Korrelationen unter kleinen Winkel. 30. 11. 2007 Kosmologie, WS 07/08, Prof. W. de Boer l=12 61
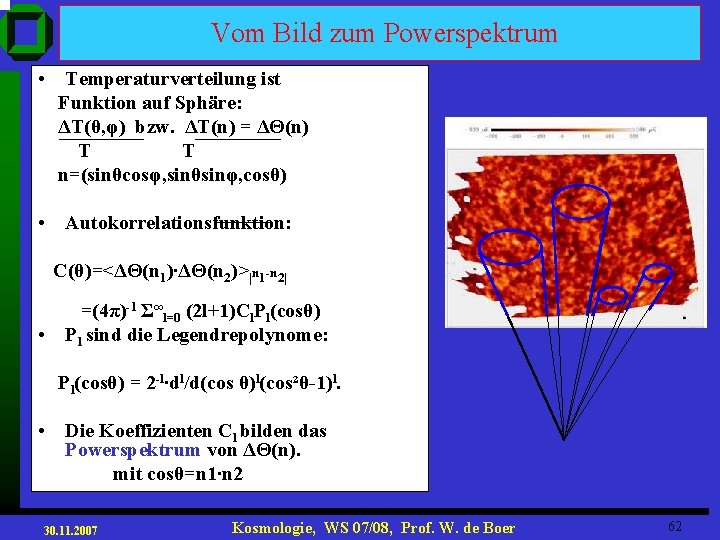
Vom Bild zum Powerspektrum • Temperaturverteilung ist Funktion auf Sphäre: ΔT(θ, φ) bzw. ΔT(n) = ΔΘ(n) T T n=(sinθcosφ, sinθsinφ, cosθ) • Autokorrelationsfunktion: C(θ)=<ΔΘ(n 1)∙ΔΘ(n 2)>|n 1 -n 2| =(4π)-1 Σ∞l=0 (2 l+1)Cl. Pl(cosθ) • Pl sind die Legendrepolynome: Pl(cosθ) = 2 -l∙dl/d(cos θ)l(cos²θ-1)l. • Die Koeffizienten Cl bilden das Powerspektrum von ΔΘ(n). mit cosθ=n 1∙n 2 30. 11. 2007 Kosmologie, WS 07/08, Prof. W. de Boer 62
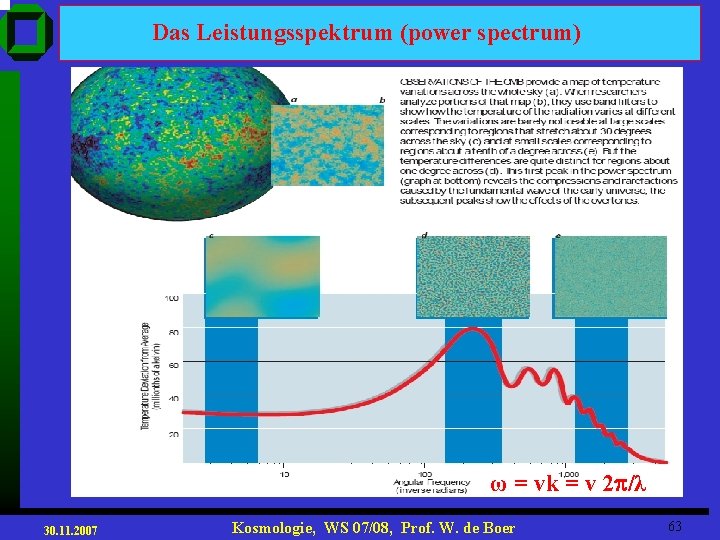
Das Leistungsspektrum (power spectrum) ω = vk = v 2 /λ 30. 11. 2007 Kosmologie, WS 07/08, Prof. W. de Boer 63
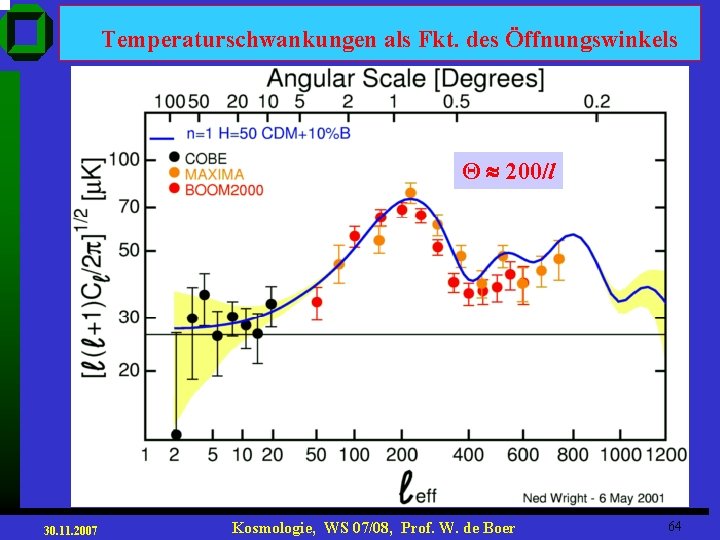
Temperaturschwankungen als Fkt. des Öffnungswinkels Θ 200/l 30. 11. 2007 Kosmologie, WS 07/08, Prof. W. de Boer 64
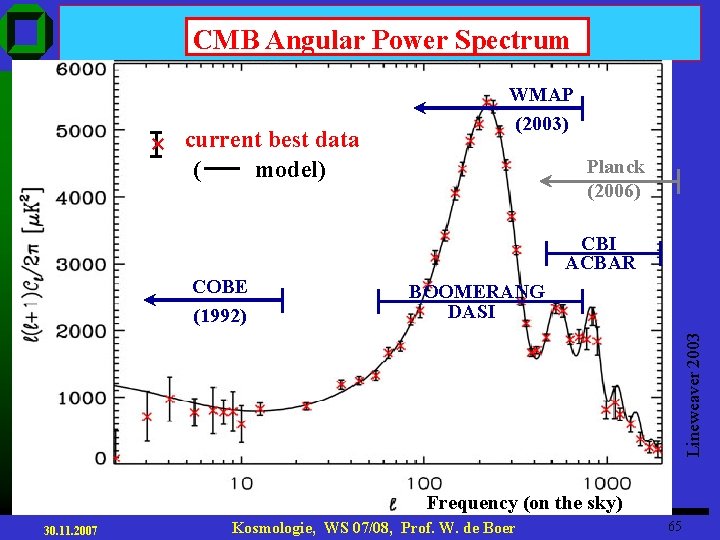
CMB Angular Power Spectrum × current best data ( model) WMAP (2003) Planck (2006) CBI ACBAR BOOMERANG DASI Lineweaver 2003 COBE (1992) Frequency (on the sky) 30. 11. 2007 Kosmologie, WS 07/08, Prof. W. de Boer 65
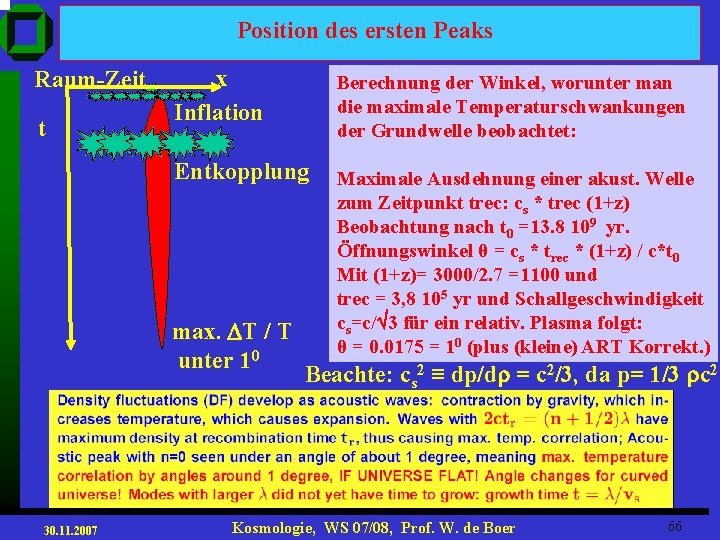
Position des ersten Peaks Raum-Zeit t x Inflation Berechnung der Winkel, worunter man die maximale Temperaturschwankungen der Grundwelle beobachtet: Entkopplung Maximale Ausdehnung einer akust. Welle zum Zeitpunkt trec: cs * trec (1+z) Beobachtung nach t 0 =13. 8 109 yr. Öffnungswinkel θ = cs * trec * (1+z) / c*t 0 Mit (1+z)= 3000/2. 7 =1100 und trec = 3, 8 105 yr und Schallgeschwindigkeit cs=c/ 3 für ein relativ. Plasma folgt: θ = 0. 0175 = 10 (plus (kleine) ART Korrekt. ) max. T / T unter 10 30. 11. 2007 Beachte: cs 2 ≡ dp/d = c 2/3, da p= 1/3 c 2 Kosmologie, WS 07/08, Prof. W. de Boer 66
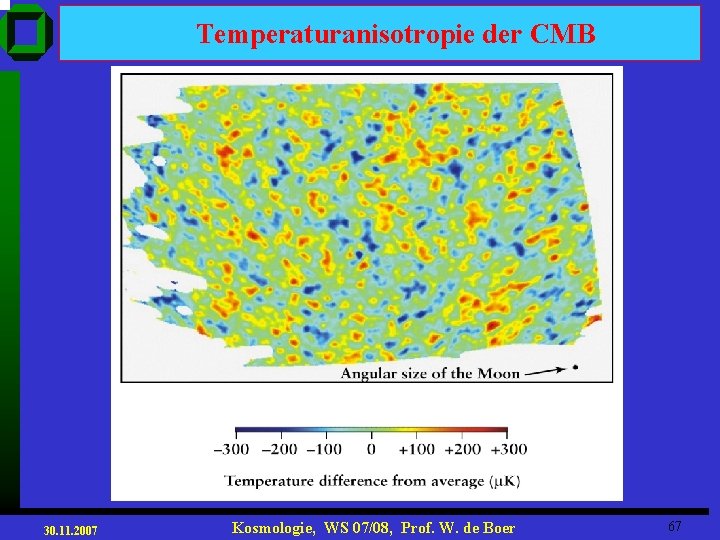
Temperaturanisotropie der CMB 30. 11. 2007 Kosmologie, WS 07/08, Prof. W. de Boer 67
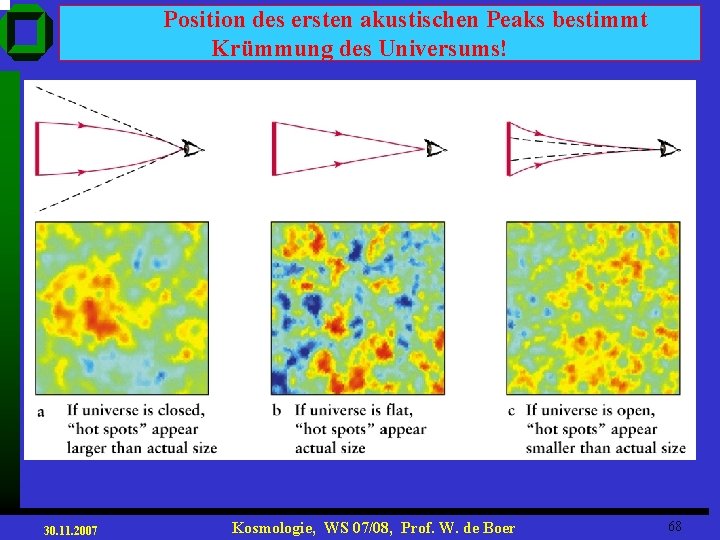
Position des ersten akustischen Peaks bestimmt Krümmung des Universums! 30. 11. 2007 Kosmologie, WS 07/08, Prof. W. de Boer 68
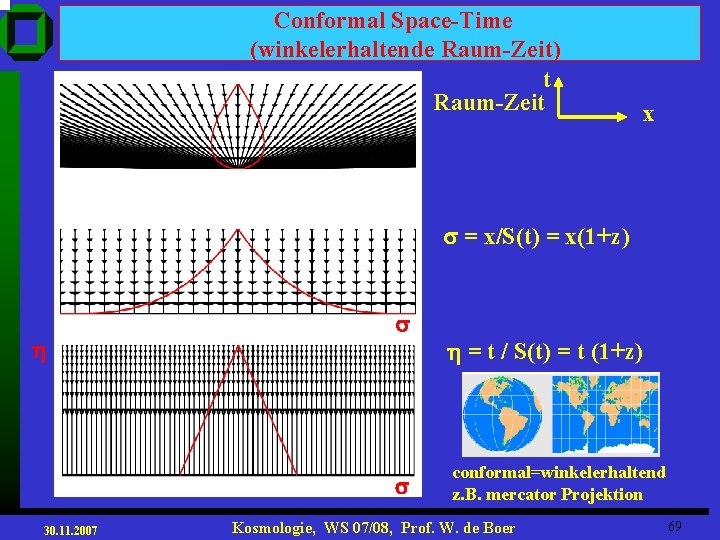
Conformal Space-Time (winkelerhaltende Raum-Zeit) t Raum-Zeit x = x/S(t) = x(1+z) 30. 11. 2007 = t / S(t) = t (1+z) conformal=winkelerhaltend z. B. mercator Projektion Kosmologie, WS 07/08, Prof. W. de Boer 69
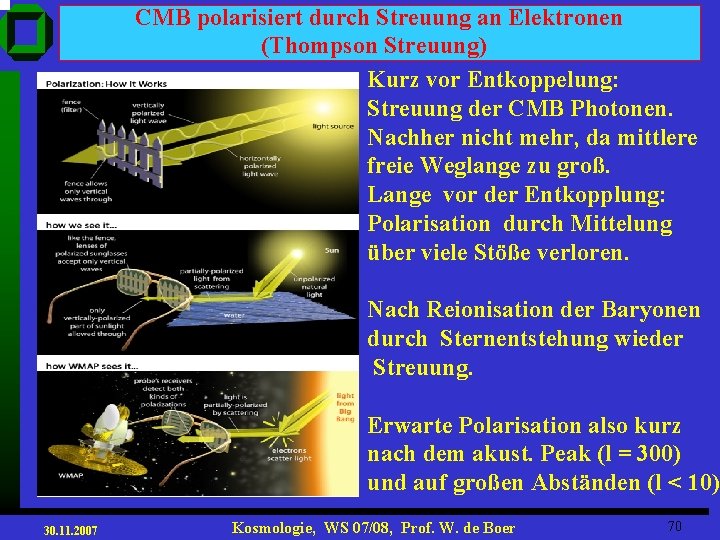
CMB polarisiert durch Streuung an Elektronen (Thompson Streuung) Kurz vor Entkoppelung: Streuung der CMB Photonen. Nachher nicht mehr, da mittlere freie Weglange zu groß. Lange vor der Entkopplung: Polarisation durch Mittelung über viele Stöße verloren. Nach Reionisation der Baryonen durch Sternentstehung wieder Streuung. Erwarte Polarisation also kurz nach dem akust. Peak (l = 300) und auf großen Abständen (l < 10) 30. 11. 2007 Kosmologie, WS 07/08, Prof. W. de Boer 70
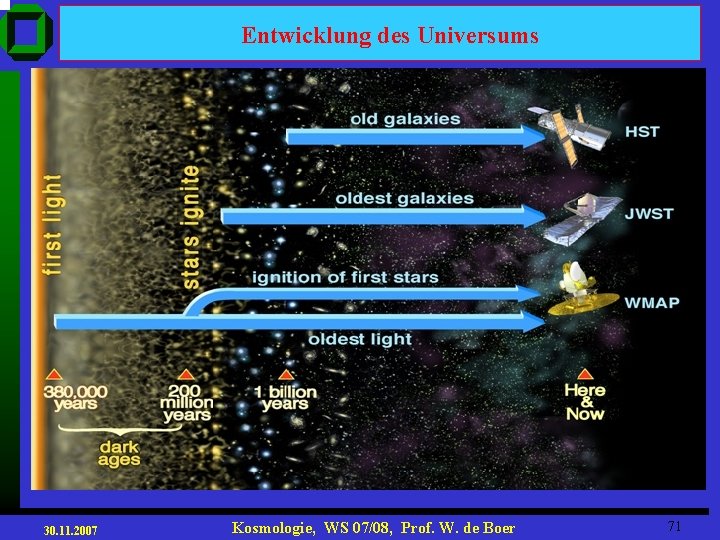
Entwicklung des Universums 30. 11. 2007 Kosmologie, WS 07/08, Prof. W. de Boer 71
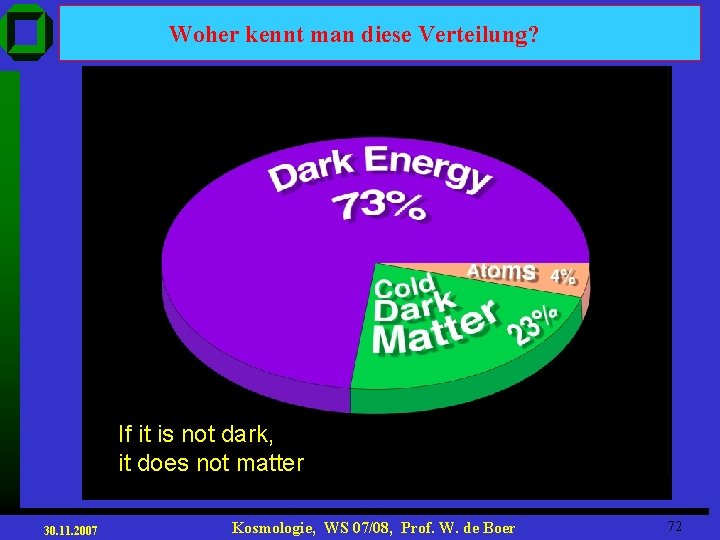
Woher kennt man diese Verteilung? If it is not dark, it does not matter 30. 11. 2007 Kosmologie, WS 07/08, Prof. W. de Boer 72
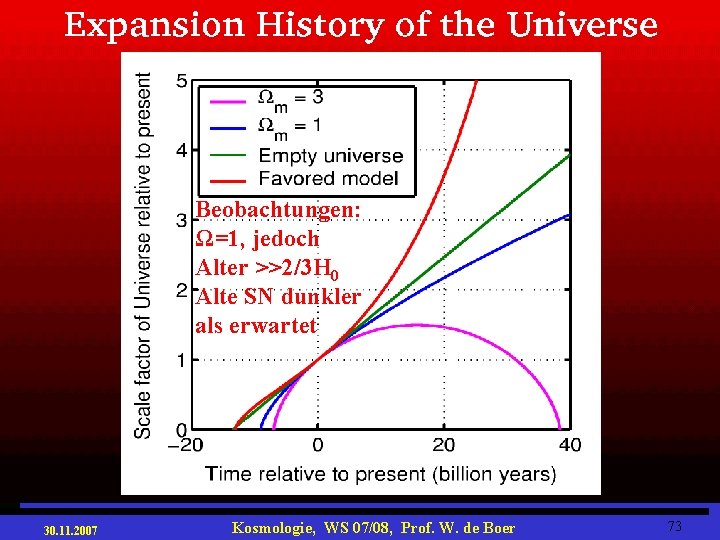
Beobachtungen: Ω=1, jedoch Alter >>2/3 H 0 Alte SN dunkler als erwartet 30. 11. 2007 Kosmologie, WS 07/08, Prof. W. de Boer 73
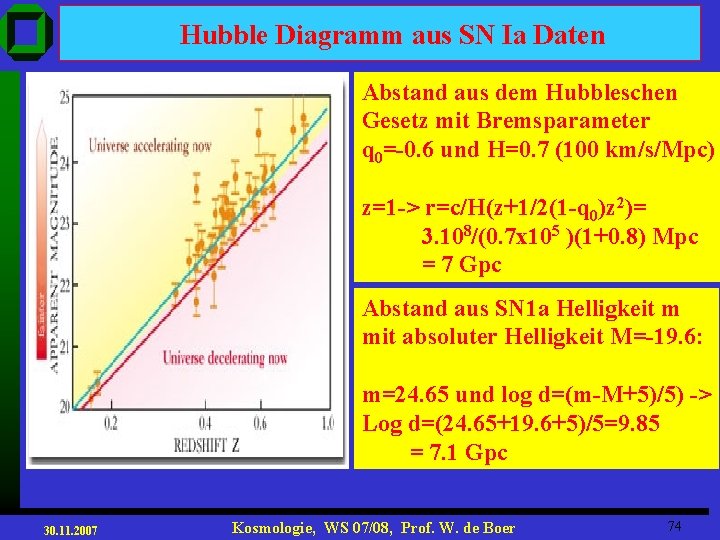
Hubble Diagramm aus SN Ia Daten Abstand aus dem Hubbleschen Gesetz mit Bremsparameter q 0=-0. 6 und H=0. 7 (100 km/s/Mpc) z=1 -> r=c/H(z+1/2(1 -q 0)z 2)= 3. 108/(0. 7 x 10⁵ )(1+0. 8) Mpc = 7 Gpc Abstand aus SN 1 a Helligkeit m mit absoluter Helligkeit M=-19. 6: m=24. 65 und log d=(m-M+5)/5) -> Log d=(24. 65+19. 6+5)/5=9. 85 = 7. 1 Gpc 30. 11. 2007 Kosmologie, WS 07/08, Prof. W. de Boer 74
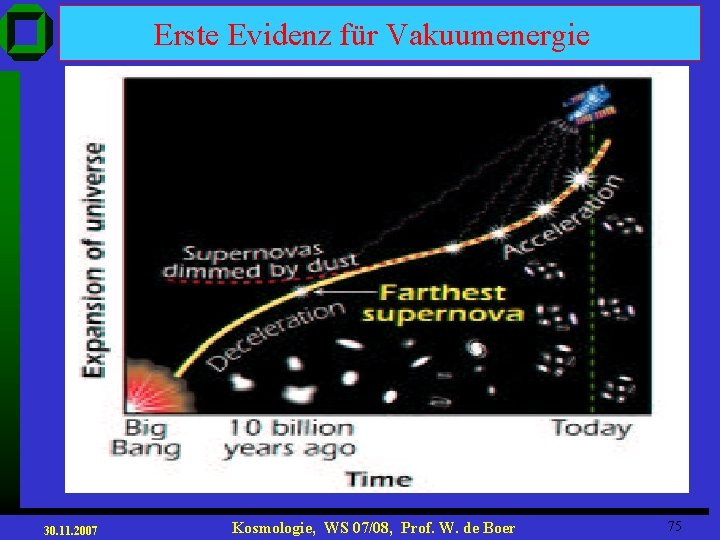
Erste Evidenz für Vakuumenergie 30. 11. 2007 Kosmologie, WS 07/08, Prof. W. de Boer 75
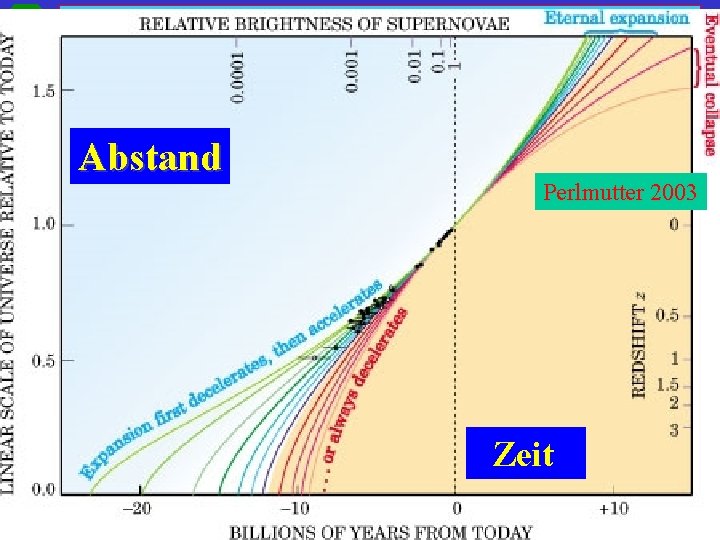
Abstand Perlmutter 2003 Zeit 30. 11. 2007 Kosmologie, WS 07/08, Prof. W. de Boer 76
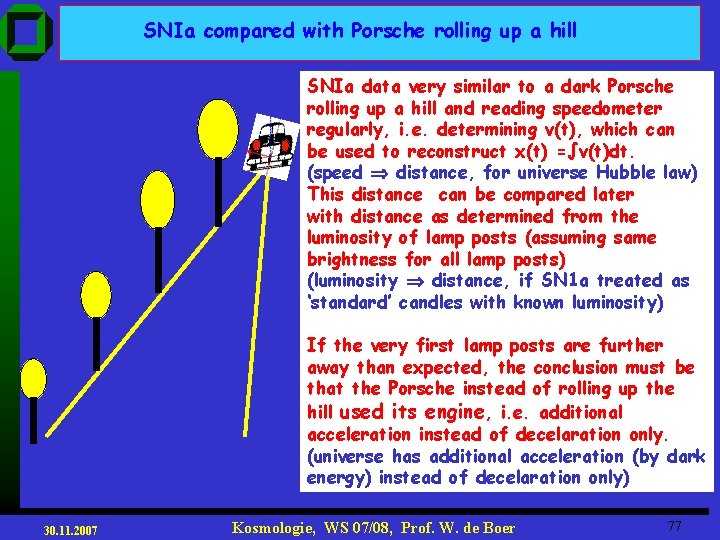
SNIa compared with Porsche rolling up a hill SNIa data very similar to a dark Porsche rolling up a hill and reading speedometer regularly, i. e. determining v(t), which can be used to reconstruct x(t) =∫v(t)dt. (speed distance, for universe Hubble law) This distance can be compared later with distance as determined from the luminosity of lamp posts (assuming same brightness for all lamp posts) (luminosity distance, if SN 1 a treated as ‘standard’ candles with known luminosity) If the very first lamp posts are further away than expected, the conclusion must be that the Porsche instead of rolling up the hill used its engine, i. e. additional acceleration instead of decelaration only. (universe has additional acceleration (by dark energy) instead of decelaration only) 30. 11. 2007 Kosmologie, WS 07/08, Prof. W. de Boer 77
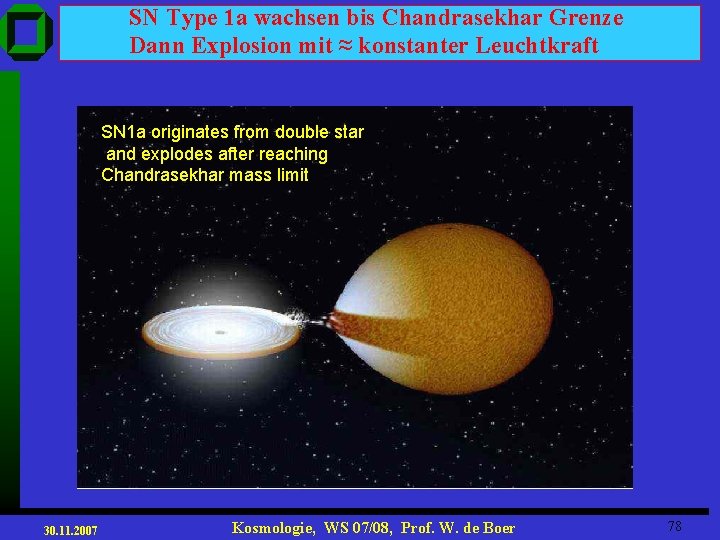
SN Type 1 a wachsen bis Chandrasekhar Grenze Dann Explosion mit ≈ konstanter Leuchtkraft SN 1 a originates from double star and explodes after reaching Chandrasekhar mass limit 30. 11. 2007 Kosmologie, WS 07/08, Prof. W. de Boer 78
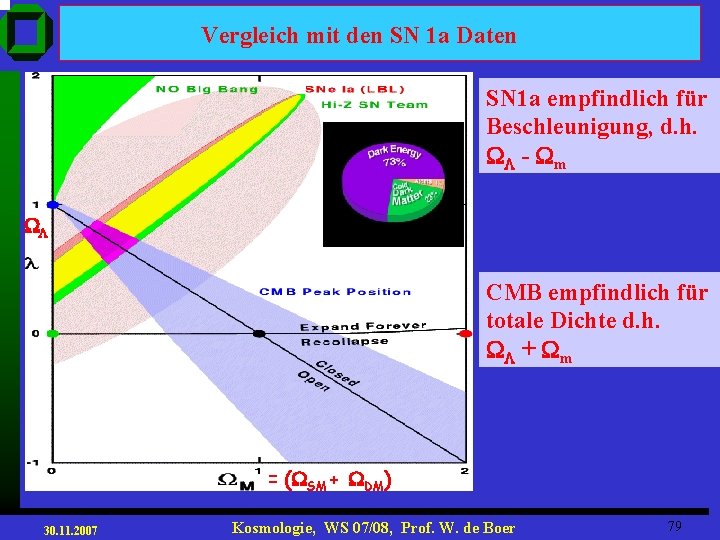
Vergleich mit den SN 1 a Daten SN 1 a empfindlich für Beschleunigung, d. h. - m CMB empfindlich für totale Dichte d. h. + m = ( SM+ DM) 30. 11. 2007 Kosmologie, WS 07/08, Prof. W. de Boer 79
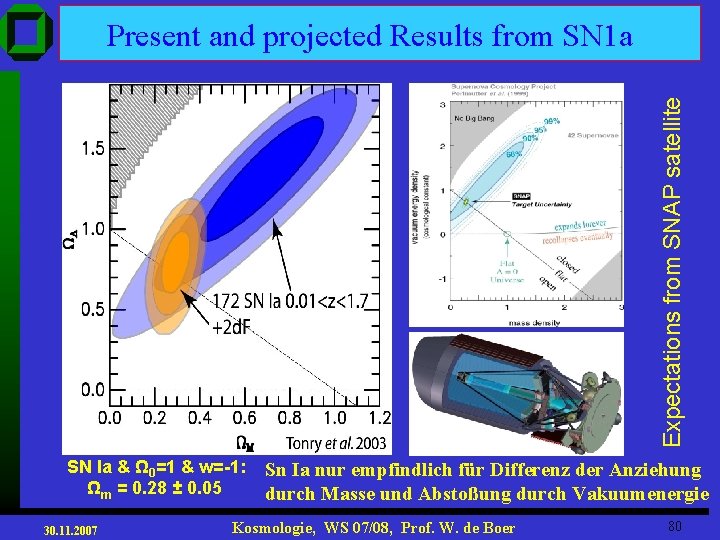
Expectations from SNAP satellite Present and projected Results from SN 1 a SN Ia & Ω 0=1 & w=-1: Ωm = 0. 28 ± 0. 05 30. 11. 2007 Sn Ia nur empfindlich für Differenz der Anziehung durch Masse und Abstoßung durch Vakuumenergie Kosmologie, WS 07/08, Prof. W. de Boer 80
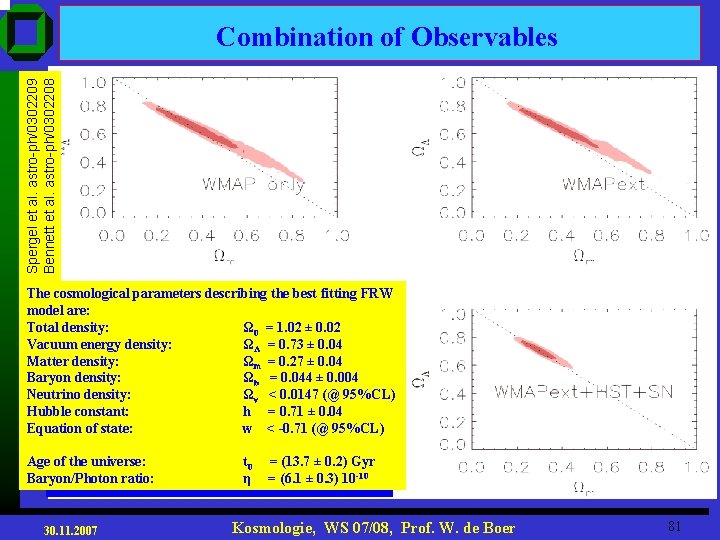
Spergel et al. astro-ph/0302209 Bennett et al. astro-ph/0302208 Combination of Observables The cosmological parameters describing the best fitting FRW model are: Total density: Ω 0 = 1. 02 ± 0. 02 Vacuum energy density: ΩΛ = 0. 73 ± 0. 04 Matter density: Ωm = 0. 27 ± 0. 04 Baryon density: Ωb = 0. 044 ± 0. 004 Neutrino density: Ων < 0. 0147 (@ 95%CL) Hubble constant: h = 0. 71 ± 0. 04 Equation of state: w < -0. 71 (@ 95%CL) Age of the universe: Baryon/Photon ratio: 30. 11. 2007 t 0 η = (13. 7 ± 0. 2) Gyr = (6. 1 ± 0. 3) 10 -10 Kosmologie, WS 07/08, Prof. W. de Boer 81
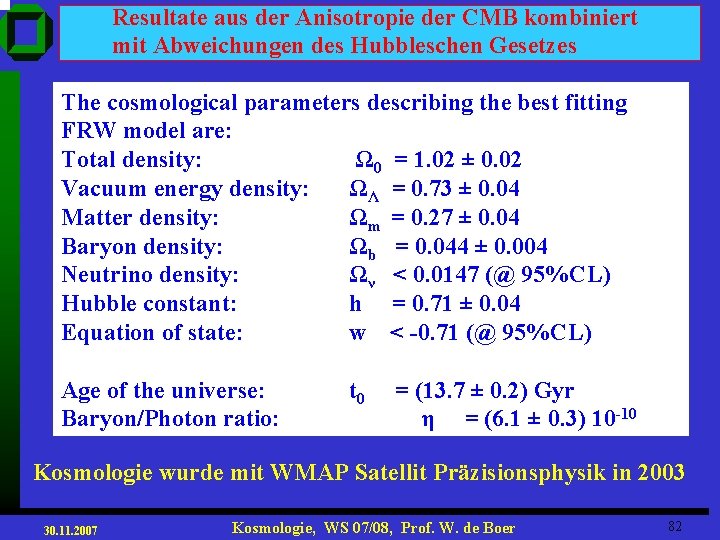
Resultate aus der Anisotropie der CMB kombiniert mit Abweichungen des Hubbleschen Gesetzes The cosmological parameters describing the best fitting FRW model are: Total density: Ω 0 = 1. 02 ± 0. 02 Vacuum energy density: ΩΛ = 0. 73 ± 0. 04 Matter density: Ωm = 0. 27 ± 0. 04 Baryon density: Ωb = 0. 044 ± 0. 004 Neutrino density: Ων < 0. 0147 (@ 95%CL) Hubble constant: h = 0. 71 ± 0. 04 Equation of state: w < -0. 71 (@ 95%CL) Age of the universe: Baryon/Photon ratio: t 0 = (13. 7 ± 0. 2) Gyr η = (6. 1 ± 0. 3) 10 -10 Kosmologie wurde mit WMAP Satellit Präzisionsphysik in 2003 30. 11. 2007 Kosmologie, WS 07/08, Prof. W. de Boer 82
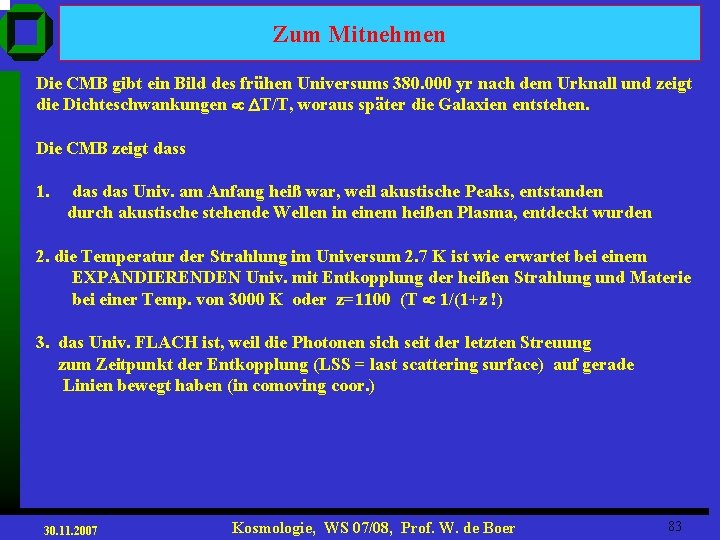
Zum Mitnehmen Die CMB gibt ein Bild des frühen Universums 380. 000 yr nach dem Urknall und zeigt die Dichteschwankungen T/T, woraus später die Galaxien entstehen. Die CMB zeigt dass 1. das Univ. am Anfang heiß war, weil akustische Peaks, entstanden durch akustische stehende Wellen in einem heißen Plasma, entdeckt wurden 2. die Temperatur der Strahlung im Universum 2. 7 K ist wie erwartet bei einem EXPANDIERENDEN Univ. mit Entkopplung der heißen Strahlung und Materie bei einer Temp. von 3000 K oder z=1100 (T 1/(1+z !) 3. das Univ. FLACH ist, weil die Photonen sich seit der letzten Streuung zum Zeitpunkt der Entkopplung (LSS = last scattering surface) auf gerade Linien bewegt haben (in comoving coor. ) 30. 11. 2007 Kosmologie, WS 07/08, Prof. W. de Boer 83
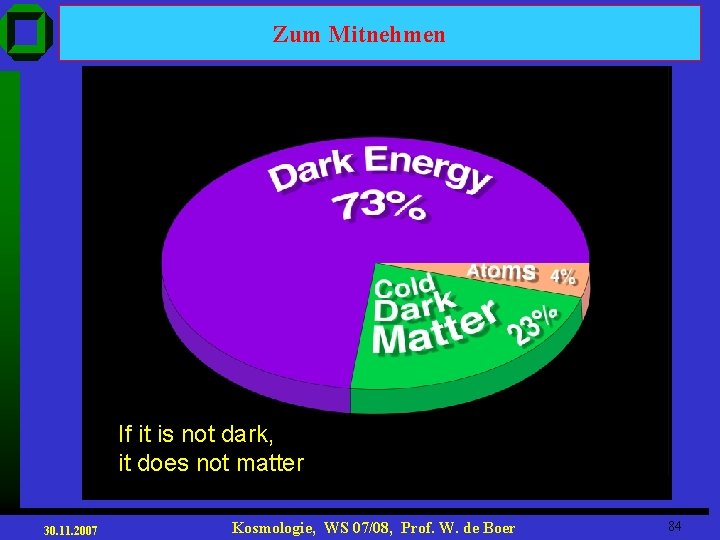
Zum Mitnehmen If it is not dark, it does not matter 30. 11. 2007 Kosmologie, WS 07/08, Prof. W. de Boer 84
- Slides: 84