Volcanic Hazard Maps at Yucca Mountain Nevada Volcanic


")
 Table 1. Overall Information ( Bernoulli and Poisson Model)")


- Slides: 47
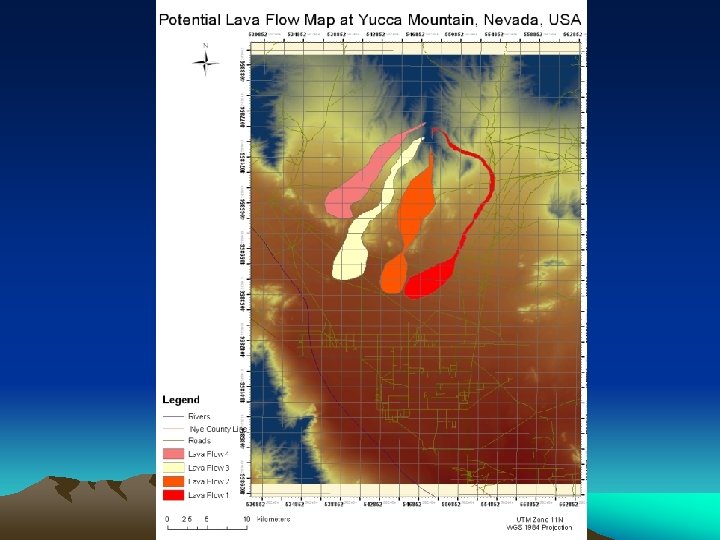
Volcanic Hazard Maps at Yucca Mountain, Nevada Volcanic hazards based on effusive and explosive volcanism Adam Toy Volcano Studies Group UB Department of Geology Geo 559
Expansion Plan for Kissing Bridge Ski Resort ~Becky Schalk Geo 479
Orthophotos were used to: • Digitize Houses, Ski lodges, ski trails, ravens and trees
Triangulated Irregular Network:
Emergency Cellular Network Coverage for Highways in Delaware County, NY Abstract This study attempts to determine optimal placement of cellular towers in order to maximize road coverage in Delaware County, NY. This is accomplished through the construction of a 3 D Viewshed and subesequent suitability map identifying prime areas for future tower placement. Bert Yagrich Geo 559 4/1/04
View Shed Analysis • Highways and towers clipped to study area. • DEM converted to grid in Arc. Toolbox and a TIN was constructed with 3 D Analyst. • Cell towers and highways overlaid in 3 D visualization in Arc. Scene. • Viewshed performed from cell tower location and overlaid on TIN.
Suitability Analysis • Elevation, Slope, Proximity to Road were variables chosen. • Grids were created based on these variables and reclassified. • Combined through raster calculations in Spatial Analyst to compute a final suitability analysis.
Preliminary Analysis/Validation • Prehistoric – as expected, many high sensitive areas • Historic – gaps in coverage • Ground Disturbance – moderate from agriculture
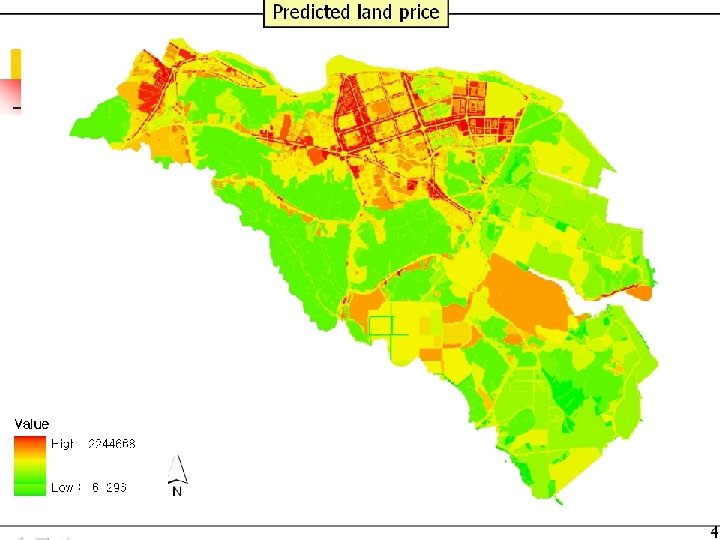
GEO 559 / Spring, 2004 Professor, Ling Bian Land Price Modeling Using Multiple Regression Analysis Apr. 8, 2004 Daejong Kim Dept. of Geography Geo 559
Summary Predicted Min. ~ Max. -61, 296 ~ 2, 244, 668 Appraised 1, 250 ~ 5, 000 CBD Area Underestimated: Overestimated: generalized linearly interaction effect autocorrelation Suburban Overestimated: applied linearly Underestimated: development restricted area Around road High in general High in CBD Alternative s Non-linear regression Expansion method, Geographically weighted
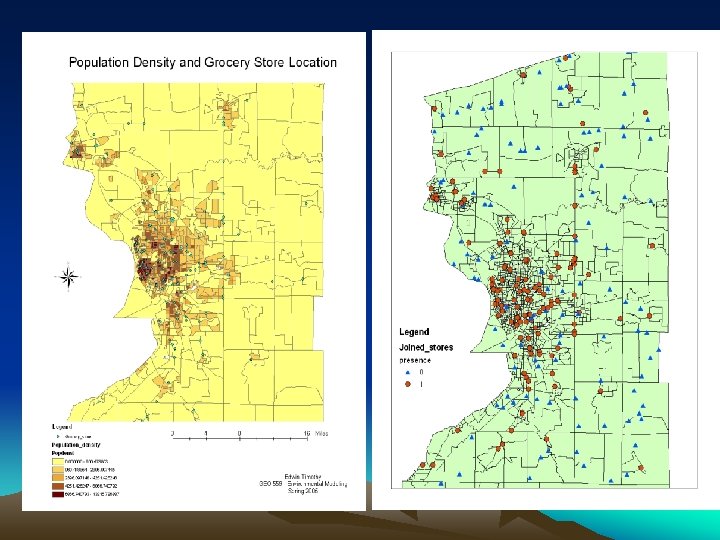
Purpose • The goal of this project is to determine which location is ideal for the Lexington Co-op, a small grocery store located in Buffalo • The choice of location is between two location choices. – The Current Location – A New Larger Location Gabriel Schmidbauer Geo 559 OR
High Income Population • High income was also considered to be a factor in current and potential customers. • Wealthier populations Tended to shop at the Co-op.
Detecting Spatial Pattern of Breast Cancer Clusters In Erie and Niagara county, 1993 – 1997. Presented by Gyoungju Lee Geo 559 q Study Objective §Detecting spatial clusters of breast cancer in Erie and Niagara county §Testing its statistical significance within GIS framework §Providing further research implications. q Methodology 1. Spatial scan statistic (Kulldorff, 1997) 2. Two models available, depending on study objective and data Bernoulli model Poisson model
q. Analysis Result Map of clusters detected (detail)
q. Analysis Result (Cont. ) Table 1. Overall Information ( Bernoulli and Poisson Model) Zips included in cluster Pop at-risk Obs Exp Relative Risk 1 st 14228 1051 54 7. 27 7. 43 2 nd 14026 14221 14043 14225 14086 14031 14227 14226 109470 935 756. 72 1. 24 3 rd 14217 14223 27664 256 191. 23 1. 34 Table 2. LLR : Bernoulli Model Log Likelihood Ratio P-value 1 st 62. 9 0. 001 2 nd 24. 22 3 rd 10. 49 Table 3. LLR : Poisson Model Log Likelihood Ratio P-value 1 st 61. 84 0. 001 2 nd 24. 04 0. 001 0. 002 3 rd 10. 41 0. 001
Landslide Modeling Using GIS Jennifer Mussell Geo 55
Land Use/Land Cover Water Developed Barren Forested Upland Shrubland Non-Natural Woody Herbaceous Upland Herbaceous Planted/Cultivated Wetlands
DEM
Procedure to Compare Numerical Simulation of Geophysical Flow with Field Data Laércio M. Namikawa Geo 559 - Spring 2004 Objectives Develop a quantitative procedure to compare output of a numerical simulation of geophysical flow with fieldwork data. Geophysical flow challenges for comparison: Large scale phenomena: Knowledge of variables is limited. Low recurrence Small number of real cases. Dynamic nature: Requires analysis of a series of data, each from different time
Quantitative Analysis Using Statistics and Spatial Database Approach • Divide area in analysis units; • For each unit, acquire attributes: – Inside or outside flow footprint; – Mean: • • Pile height; Distance to flow center; Distance to flow outline; Composed distance (center+outline). • Fit Logistic Regression; • Performance measure: – Slope of Pile Height
Logistic Regression Dependent variable: In. Flow 1: Inside real event flow footprint; 0: Otherwise. Predictors: Pile height; Combined distance: center+outline sim 1 sim 2 feb 22 feb 10
Utilizing GIS for Trail Planning in the Town of Aurora Vector and Raster Analysis Maria Dolce Geo 559
Raster Analysis • My opinion – - vector analysis is best for this case - narrows location down better with buffer and clipping
Viewshed Analysis • 3 scenic lookouts • Field verify – may be natural or man made elements obstructing view
GEO 559 Presentation Assessing landslide susceptibility using logistic regression: Alameda County, CA April, 2004 Sanghoon Lee Geo 559
Result Probability > 0. 01 -0. 009 <0. 009 Category High Moderate Low
A DRASTIC Approach for Evaluating Pollution Potential in the Tonawanda Valley Aquifer Steve Knapp Geo 559
Results / Final Drastic Model
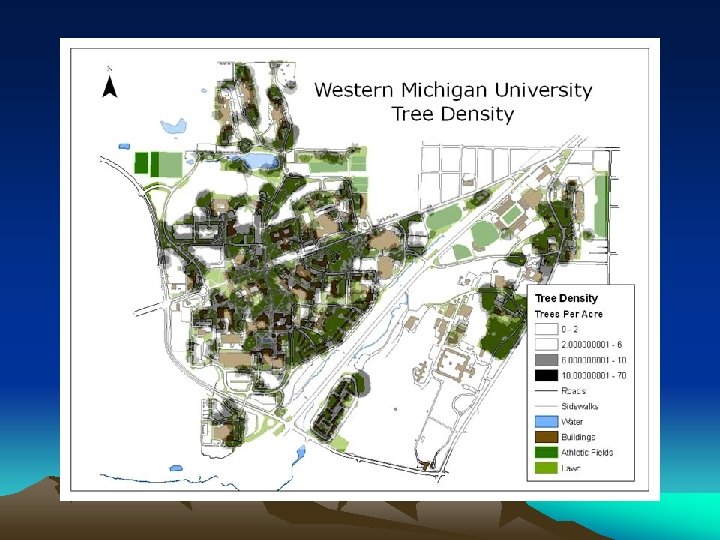
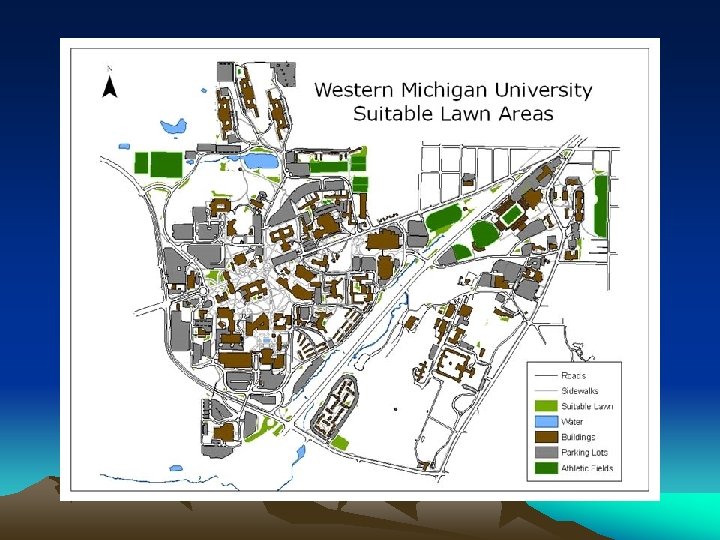
Purpose • Trees add levels of value to a campus – Beautification – Lowers stress of student – Provides shade for landscaped areas and buildings
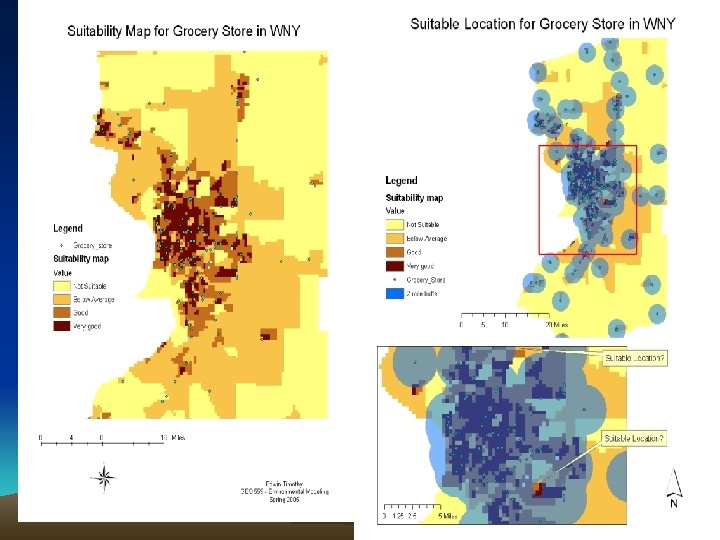
Suitability Map for Western New York’s Grocery Store Edwin Timothy GEO 559 Environmental Modeling
Modeling Phosphorus Hotspots Franklin County, Vermont Sue Roussie Geo 559 April 13, 2005
Result – Export Coefficient
Result – Export Coefficient
Ground Truthing Lineaments in the Eastern Finger Lakes Joshua Stroup Geo 559 4/18/2005
Hill Shade Lineaments
Skaneateles field area
Results
Commercial Building placement along Buffalo’s Waterfront. Ismaeal Naji Candice Au Geo 479
conclusions