Vocabulary Vocabulary Vocabulary Linear or Nonlinear xintercepts yintercepts

Vocabulary

Vocabulary

Vocabulary

� Linear or Nonlinear: � x-intercepts: � y-intercepts: Nonlinear 7. 4 This means that the object struck the ground after about 7. 4 seconds. 15 This means that the object started at an initial height of about 15 meters above the ground.

Line of symmetry x = 3. 5 The symmetry of this graph tells you that the time it took the object to go up is equal to the time it took to come down.

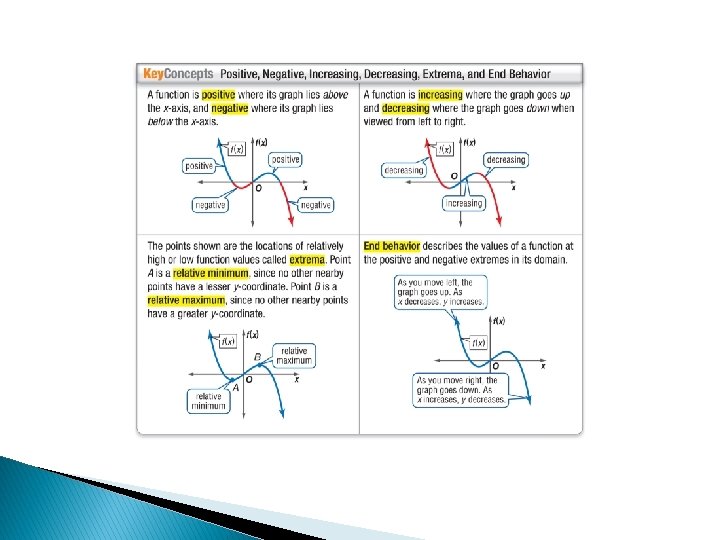
Positive: between about x = − 0. 6 and x = 10. 4 {x| -0. 6<x<10. 4} Negative: for about x < − 0. 6 and x > 10. 4 This means that there were positive sales between about 2000 and 2010, but the model predicts negative sales after about 2010. Increasing: for about x < 1. 5 and between about x = 3 and x = 8 Decreasing: between about x = 2 and x = 3 and for about x > 8 This means that sales increased from about 2000 to 2002, decreased from 2002 to 2003, increased from 2003 to 2008, and have been decreasing since 2008.

Relative Maximums: at about x = 1. 5 and x = 8 � � Relative Minimum: at about x = 3 The extrema of the graph indicate that the industry experienced two relative peaks in sales during this period: one around 2002 of approximately $10. 5 billion and another around 2008 of approximately $22 billion. A relative low of $10 billion in sales came in about 2003. End Behavior: As x increases or decreases, the value of y decreases. � The end behavior of the graph indicates negative sales several years prior to 2000 and several years after 2009, which is unlikely. This graph appears to only model sales well between 2000 and 2009 and can only be used to predict sales in 2010.

The graph shows the temperature y of a medical sample thawed at a controlled rate. � Linear or non linear: � x-Intercepts: � y-Intercepts: � Line of symmetry: � Positive: � Negative: � Increasing: � Decreasing: � x coordinate of any relative extremea: � End behavior
- Slides: 9