Visually Enhanced Composite Charts for Severe Weather Forecasting


 Specific Humidity")


 and Normalized Vcomp Wind Anomaly 08/12 UTC Eta: 33 hr")


- Slides: 44
Visually Enhanced Composite Charts for Severe Weather Forecasting and Real-time Diagnosis Josh Korotky NWS Pittsburgh PA NROW Annual Meeting 2002
Agenda § Composite Chart Approach and Diagnostic Templates § A Case study § LES 4 Panels § Cyclogenesis 4 Panels § GFS
The Forecaster’s Paradox The real atmosphere has great difficulty simulating the model atmosphere… …many good forecasts will continue to be ruined by atmospheric error!
Motivation § § Due to the growing volume of available data… …and the time intensive process of generating / disseminating forecast and warning products… …it is critical that forecasters extract relevant information quickly before and during severe weather forecast and warning operations Diagnostic and forecast methods that use visualization to highlight essential physical processes … ü ü Promote a better (and quicker) understanding of the real-time potential Allow forecasters to better anticipate the most probable range of convective evolutions for a given environment
Composite Chart Approach § Effective composite charts: ü ü ü § § Highlight important information…. not all information Reveal the physical processes that promote severe storm development, convective organization, and storm mode Lead to quick recognition of the convective potential Composite chart contents include: ü Measures of instability and vertical wind shear ü 3 D moisture content, distribution, and availability ü Synoptic and mesoscale forcing mechanisms Charts are enhanced visually by managing colors, images, and contours
Evaluating the Convective Potential Ingredient Diagnostic Instability Moisture Flux (role of LLJ) Specific Humidity Dew Point PW Layer RH Theta-e / Theta-e advection CAPE, LI Large Scale Lift / Forcing Model Omega / -Div Q Mesoscale Forcing Moisture Flux Convergence Topographic forcing Frontal forcing / Frontogenesis Moisture Vertical Wind Shear Pressure Storm-relative Helicity Low – level and deep shears EHI, VGP MSLP, Pressure tendency
Composite Chart Model Diagnostic Templates
Low – level Features PW > x. x inches MSL Pressure *Best Lifted Index < 0 *BL Moisture Flux Convergence Surface Dew Points > xxo F 1000 -850 mb Moist Flux Conv Specific Humidity Moisture Flux / Flux Magnitude Theta-e / Theta-e Advection EHI Index *2 D Frontogenesis Potential Temperature Surface Wind *0 -1 km / 0 -3 km AGL CAPE *0 -1 km / 0 -3 km AGL SRHelicity Convective Inhibition 0 -1 km / 0 -3 km Normalized Shear 0 -6 km Normalized Shear
Upper – level Features 850 mb Height / Temp 500 mb Height / Temperature *850 mb Isotachs *500 mb Isotachs 850 mb Wind Barbs 500 mb Wind barbs Div. Q MSLP *Accumulating Precipitation / 1000 -850 mb RH 250 mb Height / Wind Barbs 250 mb Isotachs 850 -300 mb Mean Wind 300 -200 mb Mean Divergence 1000 -850 mb/700 -500 mb Omega
RUC Analysis PW > x. x inches MSL Pressure and METARS *Best Lifted Index < 0 Surface Dew Points > xx o F *BL Moisture Flux Convergence 1000 -850 mb Moist Flux Conv Moisture Flux / Flux Magnitude K-Index BL Theta-e / Theta-e Advection *2 D Frontogenesis Potential Temperature Surface Wind EHI Index *0 -1 km / 1 -3 km AGL CAPE *0 -1 km / 1 -3 km AGL SRHelicity Convective Inhibition 0 -1 km / 1 -3 km Normalized Shear
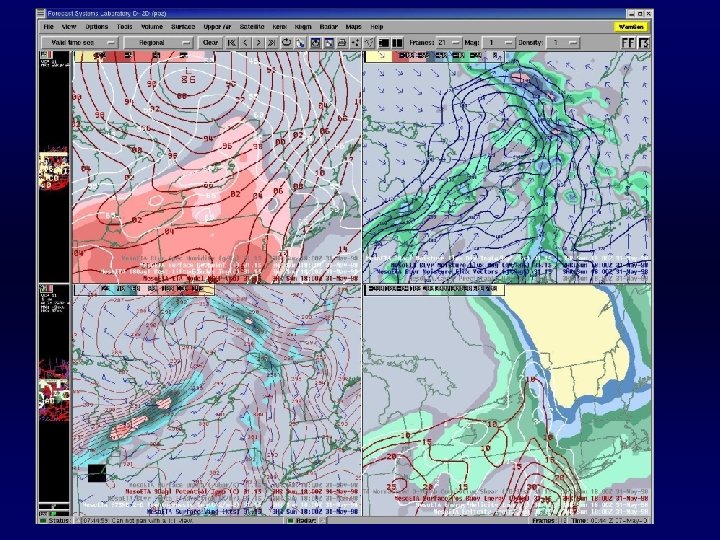
A Case Study § § Highlights a severe convective wind event that effected parts of Ohio, Pennsylvania, West Virginia, New York, and Maryland on 9 March 2002 Composite charts of model forecast fields (Eta) are supplemented with composite charts of hourly RUC surface analysis ü Eta for evaluating large scale convective potential ü Hourly RUC provides a critical link to the model forecasts
850 mb Wind (kt) and Normalized Vcomp Wind Anomaly 08/12 UTC Eta: 33 hr Forecast Valid 3/9/02 - 21 UTC 4 – 4. 5 SD
850 mb Wind and Normalized Vcomp Wind Anomaly 27 hr Forecast Valid 3/9/02 - 21 UTC > 4. 5 SD
Upper and Low-level Features § 33, 21, 9 hr forecasts valid at 21 UTC 9 March
Upper-level Features - 08/12 UTC Eta 33 hr Forecast Valid 3/9/02 - 21 UTC
Low-level Features - 08/12 UTC Eta 33 hr Forecast Valid 3/9/02 - 21 UTC
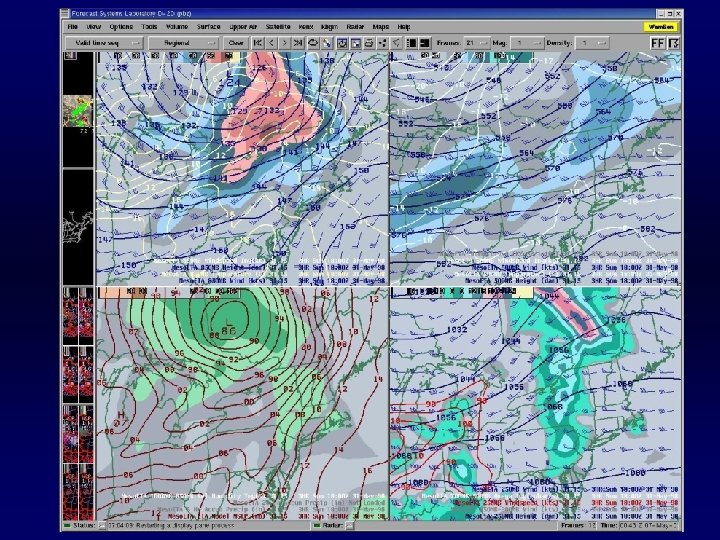
Upper-level Features – 09/00 UTC Eta 21 hr Forecast Valid 3/9/02 - 21 UTC
Low-level Features – 09/00 UTC Eta 21 hr Forecast Valid 3/9/02 - 21 UTC
Upper-level Features – 09/12 UTC Eta 9 hr Forecast Valid 3/9/02 - 21 UTC
Low-level Features – 09/12 UTC Eta 9 hr Forecast Valid 3/9/02 - 21 UTC
Summary of the Large Scale Potential Successive runs of the Eta indicate: § § Deep layer of strong flow ü 65 – 70 kts at 850 mb over Ohio Valley Significant vertical wind shear associated with vigorous lowlevel jet ü SRH 400 – 500 m 2 s 2 ü 0 -3 km normalized shear >. 014 s-1 Moderate moisture ü Warm sector surface dew points 55 – 57 o. F Narrow layer of deep moisture ü Potential for cloud breaks ahead of front ü Destabilizing potential
Summary of the Large Scale Potential § § § Considerable low-level forcing ü Strong moisture flux convergence ü Strong frontogenesis along a vigorous frontal system Significant pressure rise/fall couplet indicates deepening/dynamic system ü 10 mb/3 hr pressure rises behind front ü 8 mb/3 hr pressure falls ahead of front But…. only marginal instability ü ü CAPE forecast to remain less than 500 jkg-1 Best Lifted Index (BLI) expected to reduce no further than -2
A Range of Expectations § Expectations ü ü § Strong linear forcing will promote a narrow low-topped squall line Isolated/scattered wind damage the primary threat … unless the real-time environment destabilizes more than indicated The real time challenge ü ü Do observations / RUC / LAPS analysis indicate greater instability? Greater instability would indicate more widespread severe potential
Real Time RUC Surface Analysis 3/9/02/ 18 UTC – 3/9/02/ 21 UTC Linking the model forecast to real-time events…
18 UTC RUC Analysis
19 UTC RUC Analysis
20 UTC RUC Analysis
RUC / Observational Summary at 20 UTC § The moisture, forcing, vertical wind shear, pressure pattern, and pressure tendency substantiate initial expectations… § The environment has destabilized more than expected !! § Observations ü Winds gusting mid 30 s kts ahead of front ü Radar indicated a developing low-topped narrow squall line ü § Reports from CLE and ILN indicated wind gusts > 80 mph and wind damage associated with convective line New Expectations ü With indications of greater instability and real-time reports… • Damage is going to be widespread rather than scattered/isolated • Damage will be from winds…low probability of tornadoes
23 UTC Radar and Satellite
Conclusions § § A narrow, low-topped squall line produced significant wind damage throughout the NWS PBZ CWA Forecast (Eta) and diagnostic (RUC) methods that combine science and visualization… ü ü ü Allowed forecasters to better anticipate the most probable range of convective evolutions before the event Promoted a better (and quicker) understanding of the changing convective potential during the event Contributed to more effective warning decisions.
LES 4 Panels
Low – level Features Model Run Snow Accum 850 -700 mb Lapse Rate Model Run Accum Precip *1000 -850 LR / 850 -700 mb LR *1000 -850 mb/1000500 mb RH BL Moisture Flux Convergence Ptype Likely Icons 1000 -850 mb Moist Flux Conv 1000 -850 mb Thickness Sfc Td *1000 -950 mb/850 -700 mb Specific Humidity Fgen *Topo Omega / 700 -500 mb Omega Potential Temperature 900 mb Wind MSLP 900 mb Streamlines Surface Wind
Low-level Features – Valid 00 UTC
Low-level Features – Valid 00 UTC
Low-level Features – Valid 12 UTC
Low-level Features – Valid 12 UTC
Cyclogenesis 4 Panels
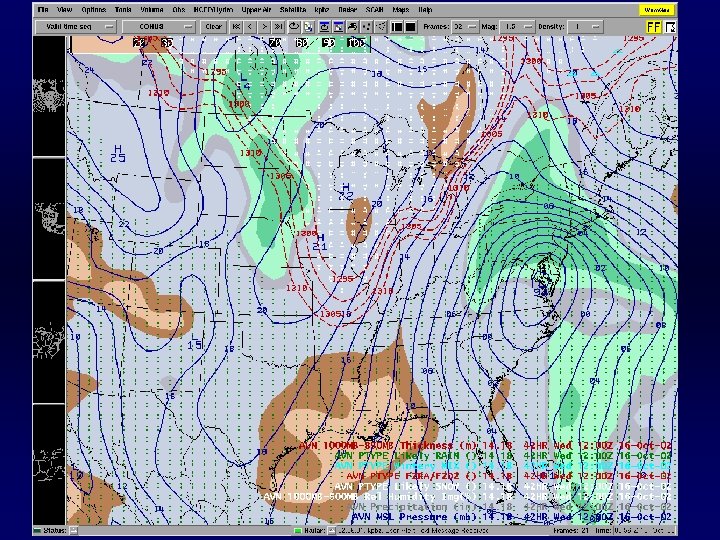
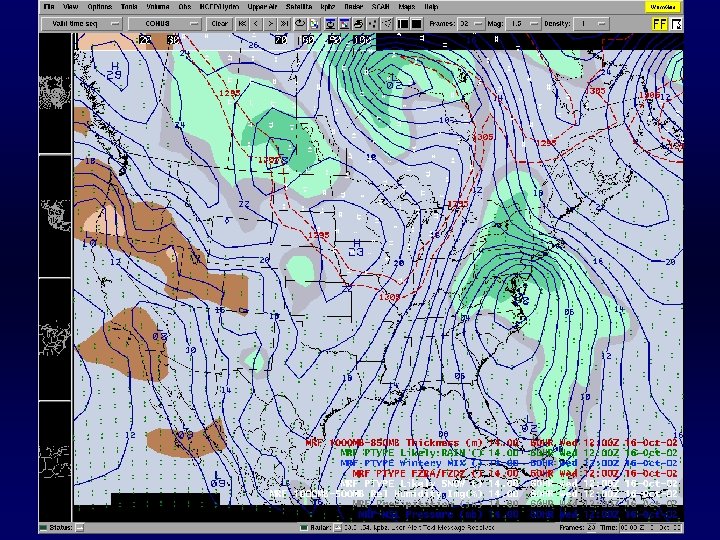
Upper-level Features – Valid 21 UTC 16 Oct 2002
Low-level Features – Valid 21 UTC 16 Oct 2002
GFS