VISUALIZING YOUR DATA EFFECTIVELY Kim Unger Fall 2017


 Bar Graph")
 Bar Graphs Quantitative scale must")
 OF A WHOLE Bar Graphs Quantitative scale must begin")


 Satisfactory, but strengths")
- Slides: 18
VISUALIZING YOUR DATA EFFECTIVELY Kim Unger – Fall 2017
ABOUT ME Senior Analytics Consultant, Data. Brains Former SSEF, ISEF, STS Finalist Science Fair Judge (regional, SSEF, ISEF) Data Visualization is my day-to-day job kunger@databrains. com @Wizard. Of. Viz
AGENDA Overview – four questions Choosing the right chart/graph Other visualizations Visual Best Practice Tableau – Visualization software FRE E
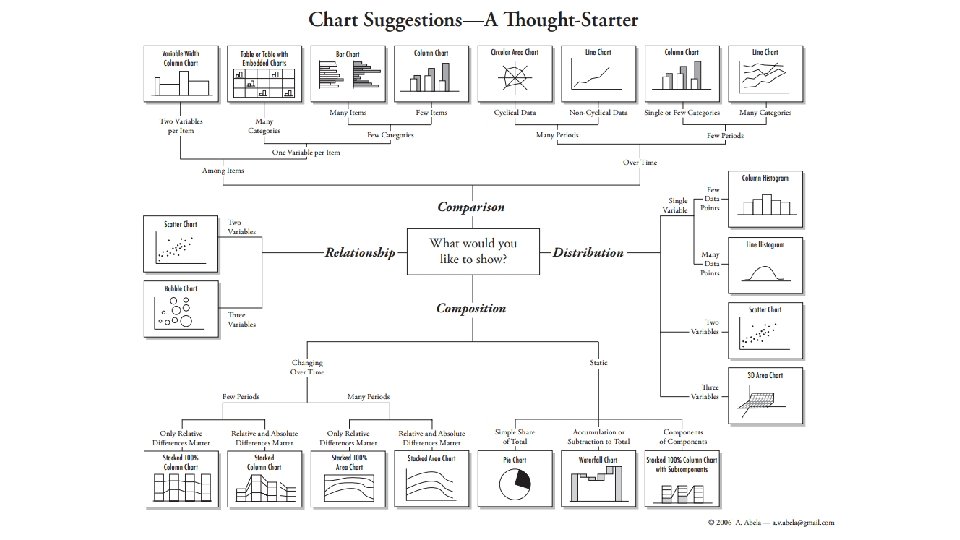
FOUR QUESTIONS 1. What data is important to show? 2. What do I want to emphasize in the data? 3. What options do I have for displaying this data? 4. Which option is most effective in communicating the data?
Time Series Ranking Distributio n Part-To. Whole Correlatio n Deviation Comparis on WHAT DO YOU WANT TO SHOW WITH YOUR DATA?
TIME SERIES VALUES DISPLAY HOW SOMETHING CHANGED OVER TIME Strip Plot (multiple) Bar Graph (vertical) To feature individual values and support their comparisons. Quantitative scale must begin at zero. Line Graph To feature overall trends and patterns and support their comparisons Dot Plot (vertical) When you do not have a value for every interval of time Only when also featuring distributions Box Plot (vertical)
RANKING VALUES ARE ORDERED BY SIZE (DESCENDING OR ASCENDING) Bar Graphs Quantitative scale must begin at zero Dot Plots
PART-TO-WHOLE VALUES REPRESENT PARTS (RATIOS) OF A WHOLE Bar Graphs Quantitative scale must begin at zero
WHAT ABOUT PIE CHARTS? Commonly used to show parts of a whole However… Ø Hard to judge relative size of pie slices – better at differentiating length Ø Take up a lot of space to present little information ØRequire labels and good color contrast to even be usable (often difficult) Best use is when one overwhelmingly larger value than the rest – no need to focus on actual values
DEVIATION DIFFERENCE BETWEEN TWO SETS OF VALUES Bar Graphs Quantitative scale must being at zero Line Graph Only when also featuring time series or single distribution
DISTRIBUTION COUNT OF VALUES PER INTERVAL ALONG QUANTITATIVE SCALE Bar Graphs Quantitative Scale, must begin at zero Line Graph To feature overall shape of distribution Strip Plot (single) When you want to see each value Strip Plot (multiple) When comparing multiple distributions AND you want to see each value Box Plots When Comparing Multiple Distributions
CORRELATION COMPARISON OF TWO PAIRED SETS OF VALUES TO DETERMINE IF THERE IS A RELATIONSHIP BETWEEN THEM Scatter Plot
NORMAL COMPARISON SIMPLE COMPARISON OF VALUES FOR A SET OF ORDERED ITEMS Bar Graphs Quantitative scale must begin at zero Dot Plots
Schematics Illustrations Flow Charts Raw data or statistical summaries in wellorganized manner. Convey important details. Photographs Explain how experiment was conducted or design concepts for engineering project Tables Great to show experimental setup, or examples of actual results OTHER VISUALIZ ATIONS A PICTURE IS WORTH A THOUSAND WORDS
ADHERE TO DATA PRESENTATION STANDARDS IN YOUR FIELD Judged by those often familiar with research field Expected presentations of data in that field Review scientific articles – how is data presented? Ø Ø Ø Are there graphs? What kind? What statistics are used? Review schematics – are there specific icons? Does the journal have a style guide?
Emphasize • most important data VISUAL BEST PRACTIC ES Orient • graphs for legibility Organize • graph/table Avoid • overloading graphs Limit • # of colors and shapes • Inform through important text
DATA ANALYSIS VS DATA VISUALIZATION Traditionally enter data into spreadsheet (Excel) Satisfactory, but strengths are in data analysis – not visualization Time consuming to create graph variations Alternative: Use data visualization software FREE to students and teachers with. edu email https: //www. tableau. com/academic/teaching