Visualizing HighDimensional Data Advanced Reading in DeepLearning and


 • Crowding Problem • t-SNE •")


 Hinton & Roweis, 2002, Advances in Neural Information Processing Systems")

")
 weight Error term Different errors have a different “cost” •")
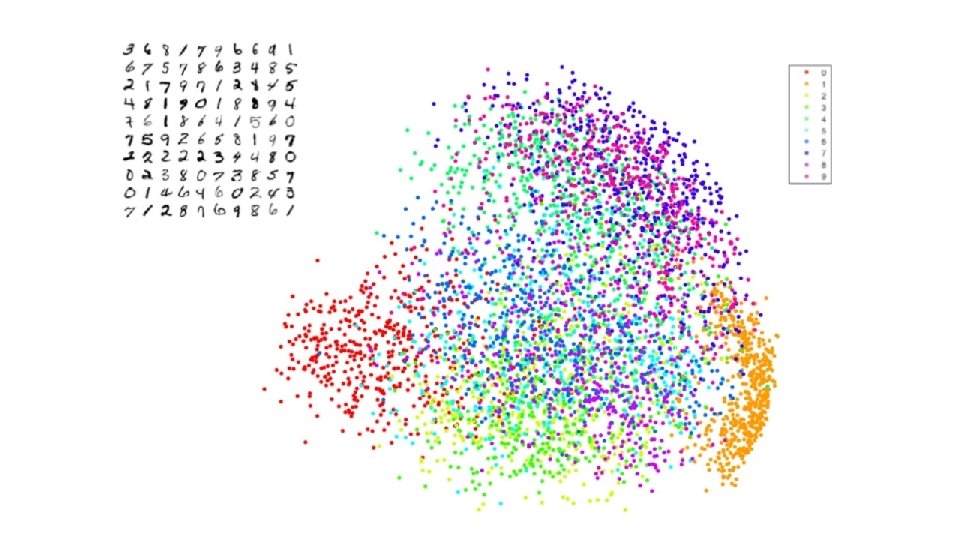
 SNE on MNIST (0 -5)")


 • Crowding Problem •")


 = first iteration last iteration")

 • Crowding Problem • t-SNE •")


 • Crowding Problem • t-SNE •")


 • Crowding Problem • t-SNE •")


 • Crowding Problem • t-SNE •")


- Slides: 63
Visualizing High-Dimensional Data Advanced Reading in Deep-Learning and Vision, Spring 2017 Gal Yona & Aviv Netanyahu
Where is 3 o’clock? Can you find a really happy smiley?
1053 emojies ordered by Visual Similarity Completely Unsupervised – Yet “labels” appear http: //prostheticknowledge. tumblr. com/post/11432984 8096/1053 -emojis-ordered-by-similarity-visualization-by
Topics • Motivation • SNE (Stochastic Neighbor Embedding) • Crowding Problem • t-SNE • O(n log n)-approximation • Applications • Multiple Maps t-SNE • Manifold Learning
Motivation Two sides to data visualization: • Data Exploration – Making sure you understand your data • Data Communication – Making sure others understand your insights and/or can use your data easily
Motivation • With high-dimensional data, both stages are potentially difficult. • Standard visualization methods can usually capture only one or two variables at a time
Problem Formulation So, how can we visualize high dimensional data? Learn an embedding, That preserves as much of the significant structure of the highdimensional data as possible in the low-dimensional map.
Formal Framework minimize an objective function that measures the discrepancy between similarities in the data and similarities in the map
Why not just PCA?
PCA • Recall the PCA objective: Project data onto a lower dimensional subspace, such that the variance is maximized • Why the bad results? 1. Linear projection 2. Mostly preserves distances between dissimilar points, But is that really what we want for the purpose of visualization?
In complex datasets, large distances are usually less indicative
SNE (Stochastic Neighbor Embedding) Hinton & Roweis, 2002, Advances in Neural Information Processing Systems • In contrast to PCA, SNE focuses on maintaining the nearest neighbors in the lower dimensional map. • SNE converts the pair-wise Euclidean distances between points into a probability density, high low
• Similarity of data points in high-dimension • Similarity of data points in low-dimension If we were able to perfectly preserve all the similarities in the data, and will be equivalent.
SNE (Stochastic Neighbor Embedding)
SNE (Stochastic Neighbor Embedding) weight Error term Different errors have a different “cost” • Close points mapped to far points ( high, low) high penalty • Far points mapped to close points ( low, high) low penalty SNE focuses on preserving the local structure of the data
PCA on MNIST (0 -9) SNE on MNIST (0 -5)
Optimization • Optimization is performed using Gradient Descent. • IMPORTANT: KL-divergence is not convex – no guaranties! • Techniques to avoid “bad” local minimum: • Large momentum (“keep going”) • Simulated Annealing (random noise) Good visualization require good choice of parameters
Are we overfitting? “classic” Machine Learning VS Visualization Goal: Generalization Goal: Visualization Given a Training set, Do well on a Test set. We just want to “do well” on our data (“training set”) Overfitting is undesirable “Overfitting” is desirable
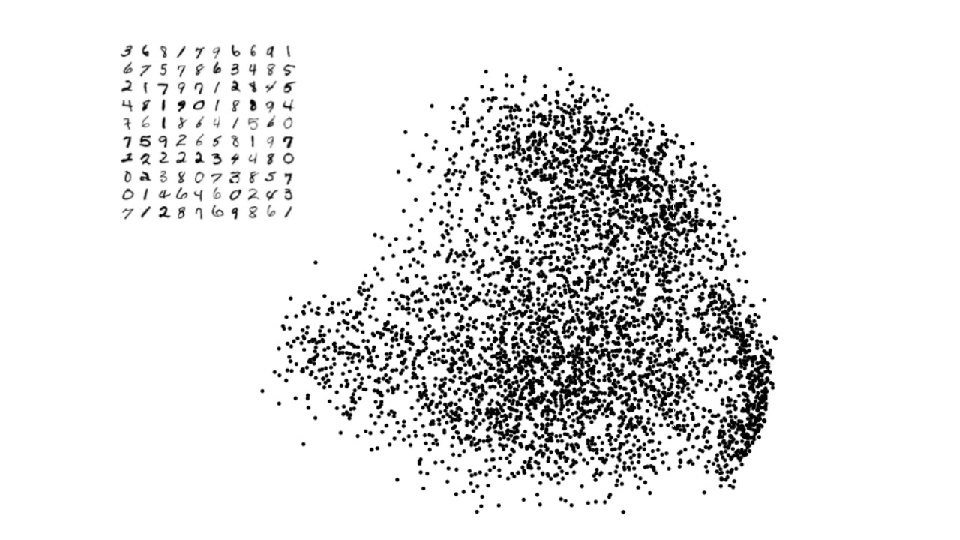
Crowding Problem The main problem with SNE: Points tend to “crowd” together in the center of the map
0 0 50 5000
0 0 50 5000
Reminder - Topics • Motivation • SNE (Stochastic Neighbor Embedding) • Crowding Problem • t-SNE • O(n log n)-approximation • Applications • Multiple Maps t-SNE • Manifold Learning
Mismatched tails can compensate for mismatched dimensionalities https: //github. com/oreillymedia/t-SNE-tutorial
t-SNE van der Maaten & Hinton, 2008, Journal of Machine Learning Research • Main difference: instead of:
https: //github. com/oreillymedia/t-SNE-tutorial
Entry (i, j) = first iteration last iteration
similarity matrix of the map points converges to the similarity matrix of the data points https: //github. com/oreillymedia/t-SNE-tutorial
Topics • Motivation • SNE (Stochastic Neighbor Embedding) • Crowding Problem • t-SNE • O(n log n)-approximation • Applications • Multiple Maps t-SNE • Manifold Learning
t-SNE gradient interpretation https: //www. slideshare. net/ssuserb 667 a 8/visualization-data-using-tsne
t-SNE gradient interpretation spring
t-SNE gradient interpretation exertion / compression
t-SNE gradient interpretation
t-SNE gradient interpretation Run time: limited to datasets with only few thousands of points!
Scalability – Barnes-Hut-SNE van der Maaten, 2013, ar. Xiv: 1301. 3342 v 2 • I- implementation of t-SNE • Reduce number of pairwise forces that needs to be computed • Idea – forces exerted by a group of points on a point that is relatively far away are all very similar
Barnes-Hut Approximation • Many of the pairwise interactions between points are very similar:
Barnes-Hut Approximation • Approximate similar interactions by a single interaction x 3
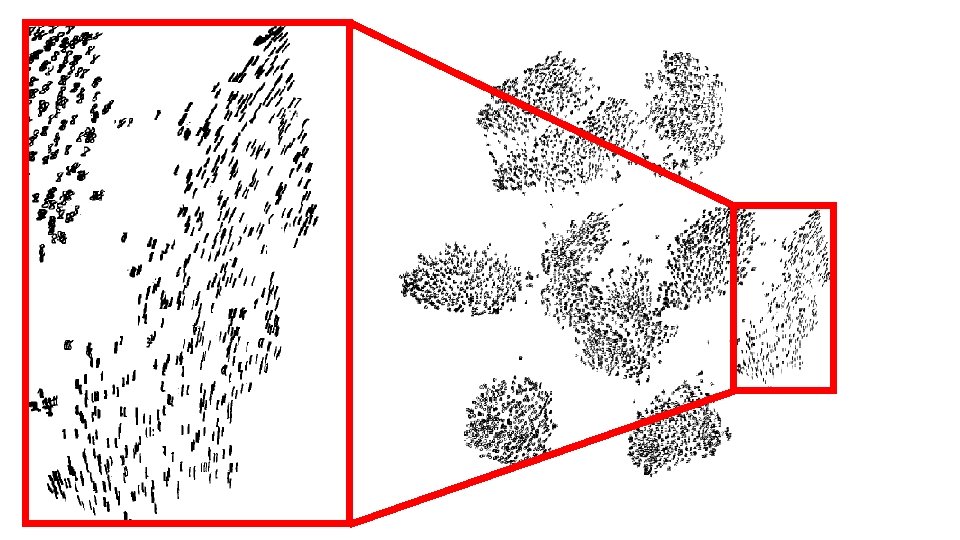
All 70, 000 MNIST images Improvement in run time – from days to ~10 minutes
Topics • Motivation • SNE (Stochastic Neighbor Embedding) • Crowding Problem • t-SNE • O(n log n)-approximation • Applications • Multiple Maps t-SNE • Manifold Learning
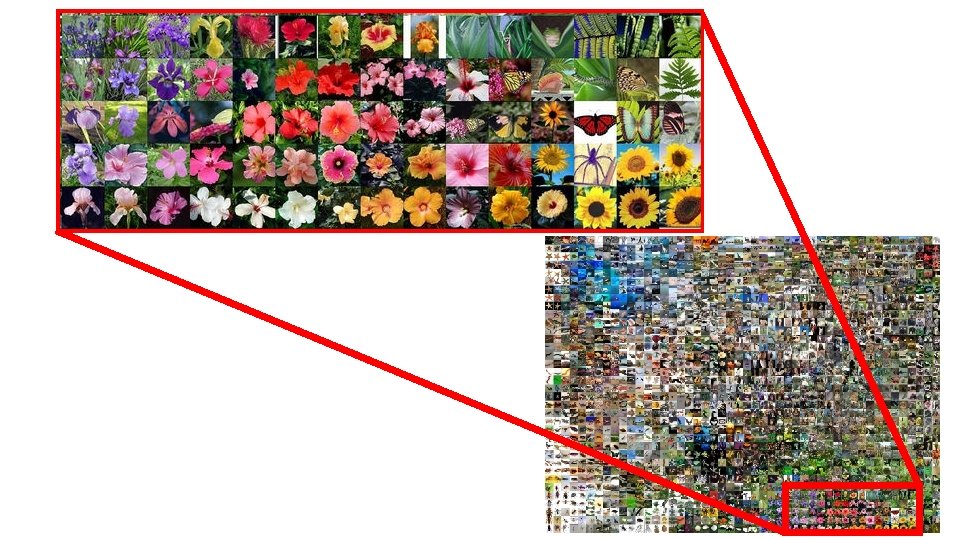
Image. Net
Image. Net Alex. Net
Word 2 vec • Input: large corpus of text • Embed words into a high-dim space • words with common contexts in the corpus are close in the space
http: //nlp. yvespeirsman. be/blog/visualizing-word-embeddings-with-tsne/
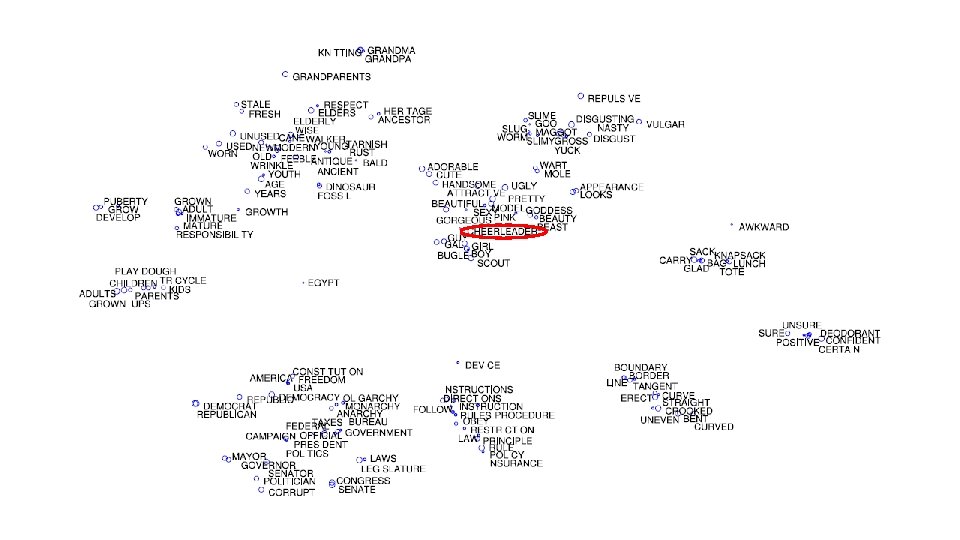
Limitations of visualizing words with t-SNE River Bank Bailout http: //homepage. tudelft. nl/19 j 49/multiplemaps/Multiple_maps_t-SNE. html
Topics • Motivation • SNE (Stochastic Neighbor Embedding) • Crowding Problem • t-SNE • O(n log n)-approximation • Applications • Multiple Maps t-SNE • Manifold Learning
Multiple maps t-SNE Hinton & van der Maaten, 2011, https: //link. springer. com/article/10. 1007/s 10994 -011 -5273 -4 • Construct multiple maps, give each object: • A point in each map • An importance weight for each point in each map Map 1 0 1/2 1 Map 2 River Bank Bailout 1 1/2 0 River Bank Bailout
Multiple maps t-SNE – formulation • Define • Same cost function as before, now optimized w. r. t. N x M low-dim map points and N x M importance weights
Word associations dataset
Visualization of genetic disease – phenotype similarities by multiple maps t-SNE with Laplacian regularization • Diseases may be difficult to accurately diagnose, due to specific combinations of confounding symptoms (different phenotypes) https: //www. ncbi. nlm. nih. gov/pmc/articles/PMC 4243097/
• Phenotypes feature vectors – every entry represents a Me. SH (Medical Subject Headings) concept • t-SNE input: phenotype similarity matrix • Text – phenotype ID • Size – weight • Color – disease category
Topics • Motivation • SNE (Stochastic Neighbor Embedding) • Crowding Problem • t-SNE • O(n log n)-approximation • Applications • Multiple Maps t-SNE • Manifold Learning
t-SNE as an instance of Manifold Learning • Manifold: a space that locally resembles Euclidean space near each point • Manifold learning: approach to non-linear dimensionality reduction • Algorithms for this task based on the idea that dimensionality of dataset is only artificially high • t-SNE assumes local linearity (Euclidean distances between neighbors) t-SNE is an instance of manifold learning
When can t-SNE fail? • Local linearity assumption fails when • Data is noisy • Data is on a highly varying manifold
Data is noisy Possible solution - PCA
Data is on a highly varying manifold • Intrinsic dimension of a signal describes how many variables are needed to represent it
Data is on a highly varying manifold • Intrinsic dimension of a signal describes how many variables are needed to represent it • Curse of intrinsic dimensionality - in datasets with high intrinsic dimensionality, the local linearity assumption on the manifold that t-SNE implicitly makes may be violated
Data is on a highly varying manifold Possible solution – Autoencoders • Input & output – high-dim points • Reconstruct output from lowerdim “code” layer • Objective – output a point close to input point
Conclusions • t-SNE is a state of the art method for visualizing multidimensional datasets in 2 D or 3 D • Scalable to large datasets • Has been successfully applied in a wide range of tasks
Questions?