Visualizing collection usage books and beyond and floating

Visualizing collection usage books and beyond and floating collection Barbara Coopey Sherry Roth SNRG 2015

Visualizing Your Collection using Director’s Station Ø Ø Ø Why you might need to visualize your data Ways libraries can visualize data Future of visualizing

Why should we visualize data? …. because it is Ø appealing– it sure should be! Ø enable understanding Ø help you retain the information

Why do we visualize data? for the appeal https: //www. flickr. com/photos/peasap/4063408356

Why do we visualize data? to capture your attention http: //commons. wikimedia. org/wiki/File: Butterfly_Goldfish_02. JPG
 Vision Trumps")
Why do we visualize data? to enable learning (Brain Rule # 10) Vision Trumps All Other Senses http: //commons. wikimedia. org/wiki/File%3 AAce_of_No-Trumps. png

Why do we visualize data? to enable understanding

Why do we visualize data? We don’t pay attention to boring things (Brain Rule #4) https: //www. flickr. com/photos/cybrarian 77

How can libraries use visual information? Ø Ø Ø to identify, quantify, market our “value” to engage and inform your constituencies to (geo)visualize collection use
.")
Academic Library Value: the impact starter kit (Oakleaf, 2012).

Why do we visualize our data? to engage our patrons to show our value #psu (Data from Director’s Station, created in Power. Point)
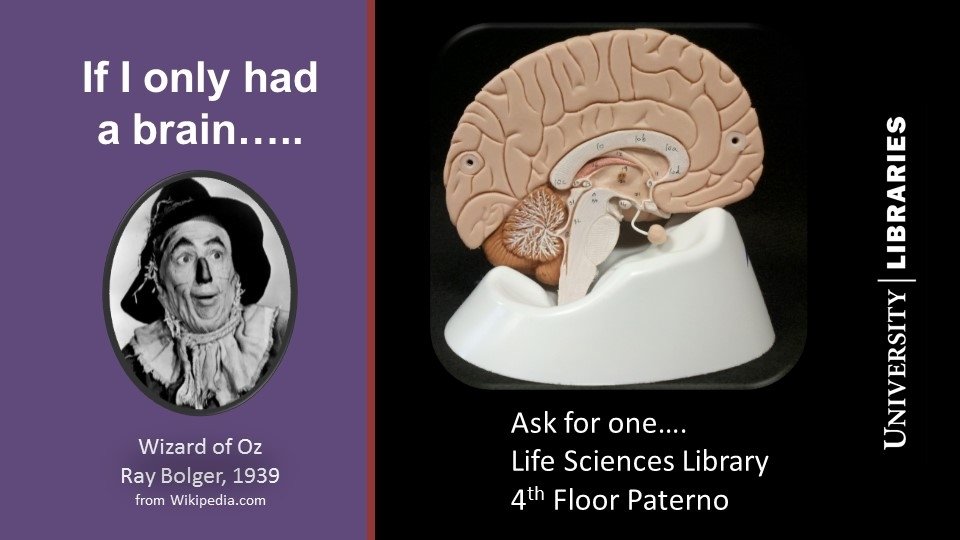

Books on Life Sciences Library Floor

Why do we visualize data? to engage our patrons #psu (Data from Director’s Station, created in Power. Point)

Why do we use them? To quantify our value, engage our patrons

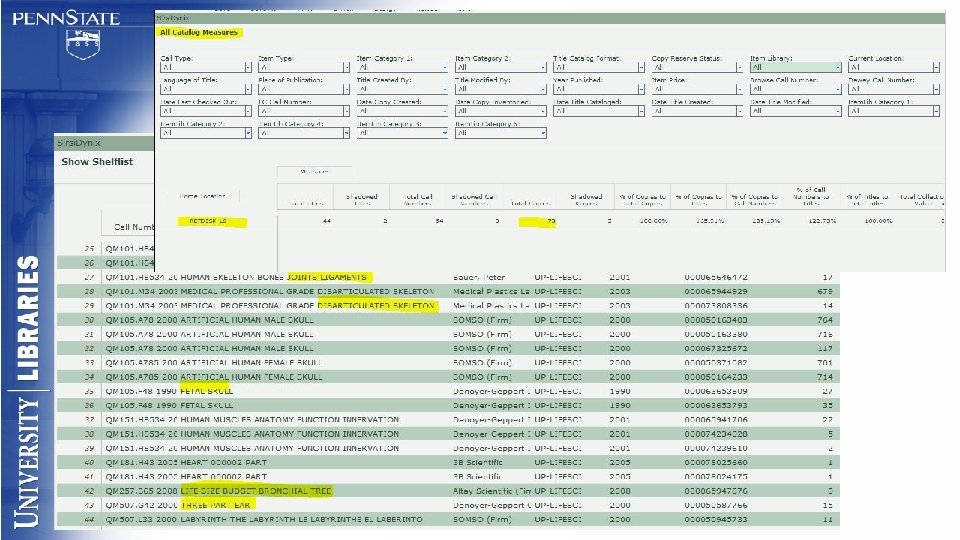
Pivot Tables are your friend…… Pivot Table
")
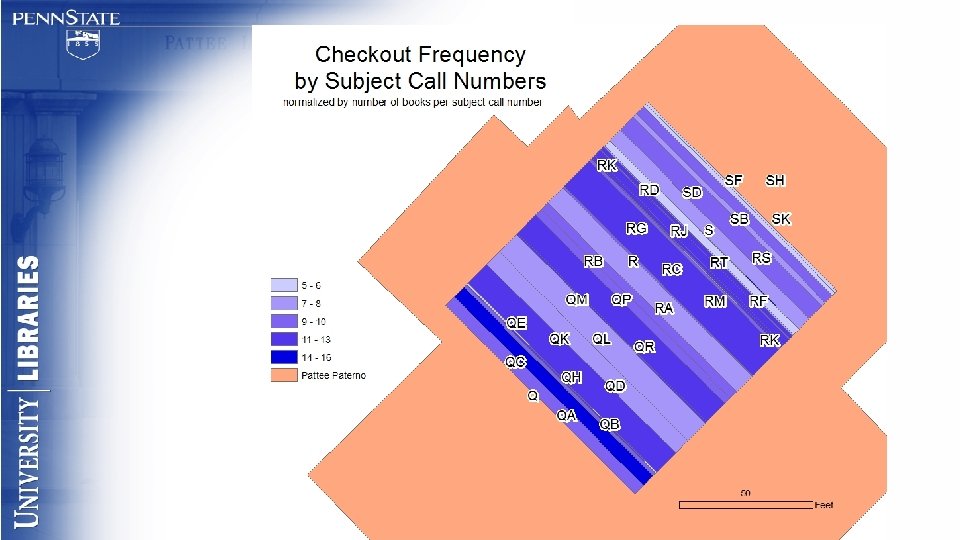
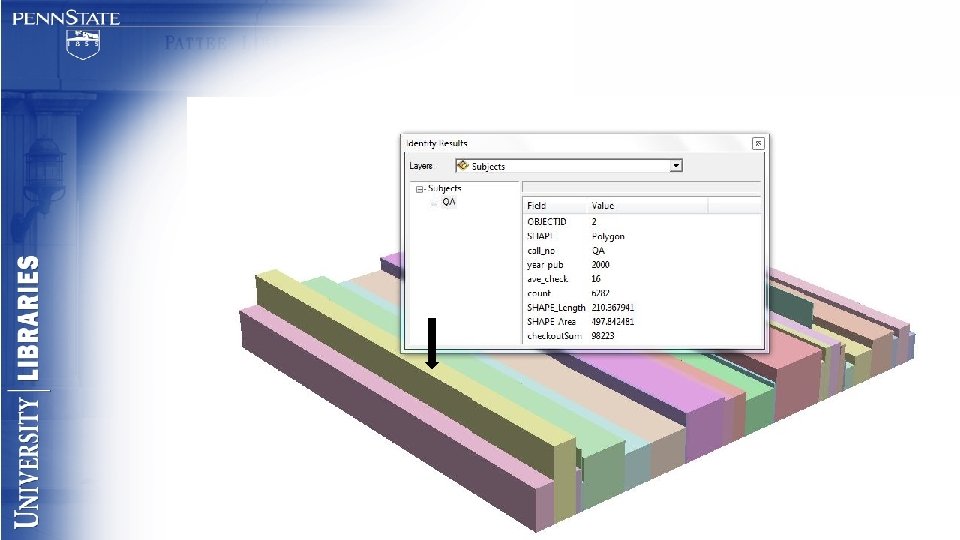
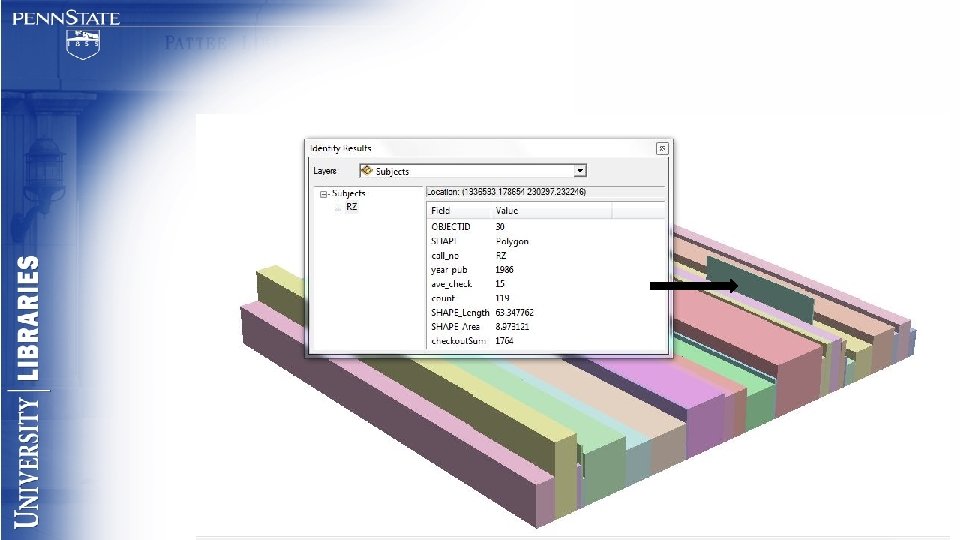
To visualize our collections (Data from Director’s Station, created in Power. Point)

So far…. . …we have visualized data to engage patrons, donors and funders, to show our value, and to better understand our collections….

How about geovisualizing data from using ?

Why use a geographic information system with library collections? In 2011, Andrew Coyle, writing in Library Hi Tech said, “GIS is going to be implemented in libraries sooner rather than later. The libraries that implement GIS early will have an intellectual advantage over those coming onboard late. ”

Bryce Jordon and Pattee and Paterno Library complex

Life Sciences stacks are just about here You are just about here

Life Sciences Library supports the • biological sciences • health sciences • agricultural sciences
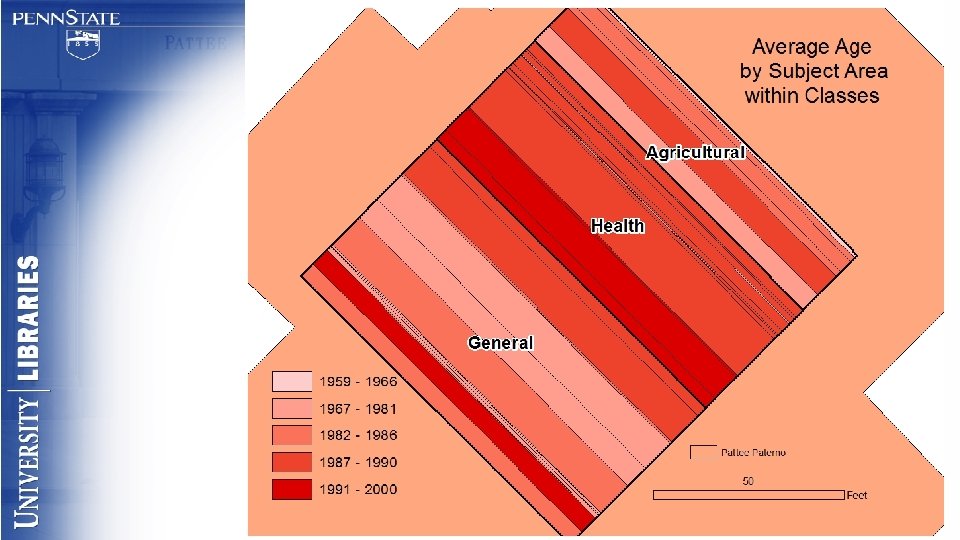

Age Checkout Frequency

Average Checkouts in Life Science Library

Average Checkouts in Life Science Library
")
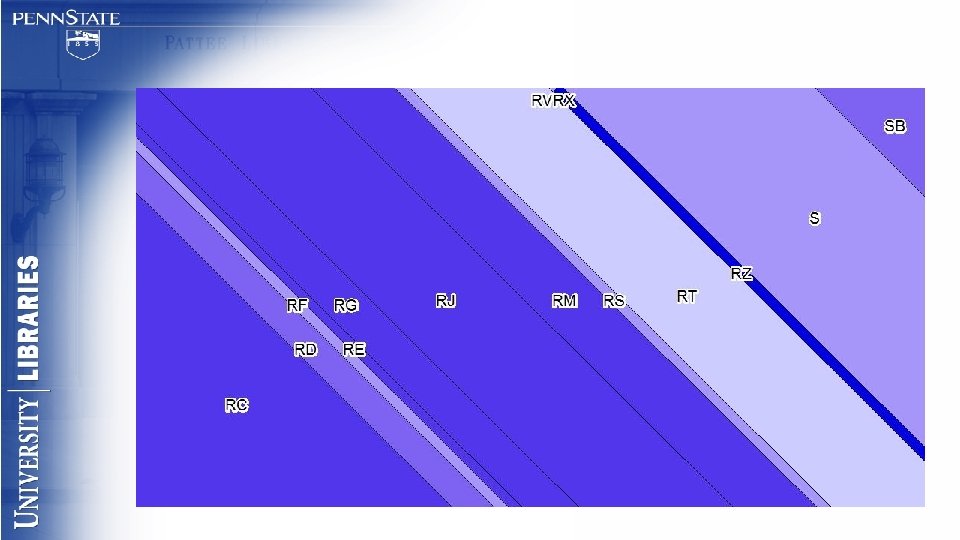
Adding number of individual book checkouts (divided by 10)
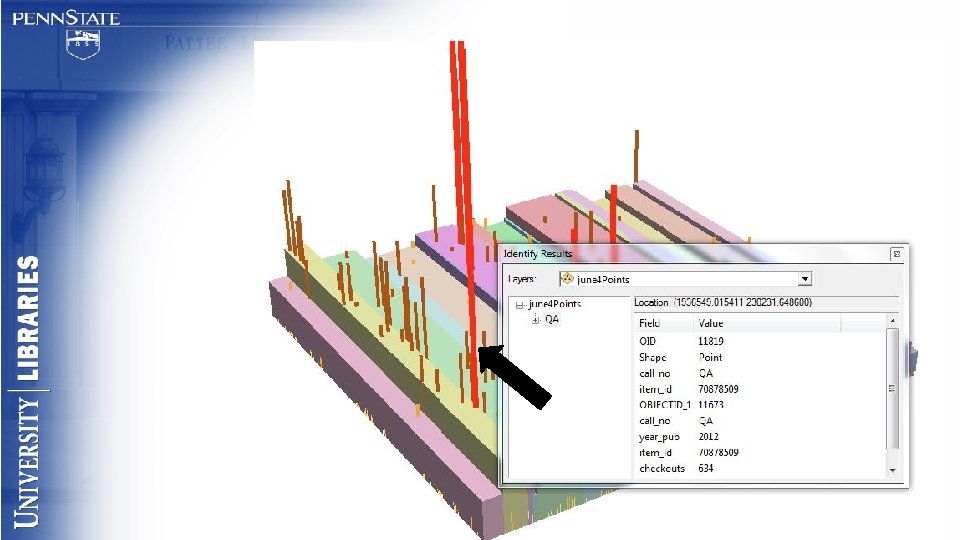

Using the average of 10 checkouts as the “horizon line” Fly. By of Monographs
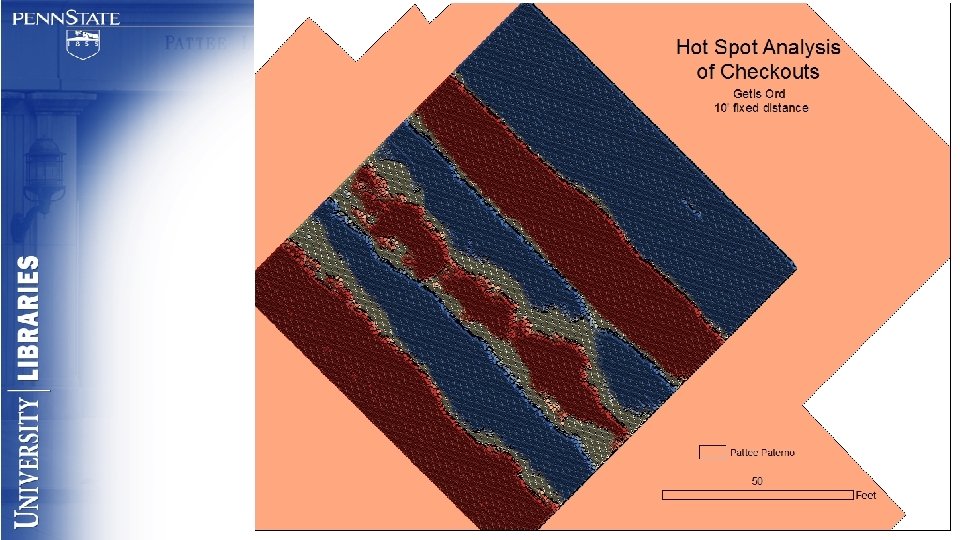

Future of Geovisualizing Library Collections

Can mapping collections open opportunities to support decision-making in Ø retaining Ø moving off-site locally Ø moving off-site collaboratively Ø disposing of unused volumes

Geovisualizing collection attributes Ø Adds an intuitive element that allows quick comparisons (with other STEM libraries, with other CIC libraries…. Ø May facilitate site selection for storing low-use volumes either locally or consortially Ø Can set the stage for future space planning and wayfinding in the Patte/Paterno labrynth Ø Can identify least-cost location of book float volumes

Sources http: //geniusrecruiter. com/2012/07/27/how-universities-and-colleges-are-using-infographics/ http: //www. independent. co. uk/news/science/our-attention-span-is-now-less-than-that-of-a-goldfish-microsoft-studyfinds-10247553. html http: //info. shiftelearning. com/blog/bid/350326/Studies-Confirm-the-Power-of-Visuals-in-e. Learning http: //unbounce. com/content-marketing/why-do-infographics-make-great-marketing-tools/ https: //www. youtube. com/watch? v=a. R 1 TNEHRY-U Coyle, A. (2011). Interior library GIS. Library Hi Tech, 29(3), 529– 549. http: //doi. org/http: //dx. doi. org. ezaccess. libraries. psu. edu/10. 1108/07378831111174468 Lankow, J. , Ritchie, J. , Crooks, R. , & Ebooks Corporation. (2012). Infographics: The power of visual storytelling. Hoboken, N. J: John Wiley & Sons, Inc. Matarazzo, J. M. , & Pearlstein, T. (2015). Academic libraries: A soft analysis, a warning and the road ahead. IFLA Journal, 41(1), 5 -12. doi: 10. 1177/0340035215571356 Medina, J. , Stevenson, R. W. , & Pearson, M. (2008). Brain rules: 12 principles for surviving and thriving at work, home, and school. Seattle, Wash: Pear Press. Oakleaf, M. J. (2012). Academic library value: The impact starter kit. Syracuse, NY: Dellas Graphics. Oakleaf, M. J. , American Library Association, & Association of College and Research Libraries. (2010). The value of academic libraries: A comprehensive research review and report. Chicago, IL: Association of College and Research Libraries, American Library Association.

Now Barbara will talk with you about the Floating Collections at Penn State…. .
- Slides: 41