Visualization Encoding Introduction Information visualization starts from data


 Example: - Quantitative field does not make sense for divisions")


- Slides: 31
Visualization Encoding
Introduction ¨ Information visualization starts from data. ¨ There are many forms that the data could take, text, spreadsheets, relational DB tuples, etc. ¨ There are many patterns that the data could follow, clustering, outlier, correlation, etc. ¨ Encoding: Data Application Domain Graphic Presentation
Fundamental Tasks ¨ Information presentation. Maps, Photographs, Movies, … ¨ Information extraction. Interactive graphical interface
Information Presentation Data Mining Example: Clustering
Information Extraction Data Mining Example: Clustering
Data Types ¨ 1 -D, 2 -D, 3 -D, temporal, multi-dimensional, tree and network data. ¨ Data types characterize the information objects in the task domain.
Basic Visualization Tasks ¨ Overview of a collection of data. ¨ Zoom in/on objects of interest. ¨ Filter out uninterested items. ¨ Details-on-demand: view details. ¨ Relate: View relationship. ¨ History: Undo, Refinement. ¨ Extract a subset of the data.
1 -D Data and Task Encoding ¨ Linear data: textual document, source code, etc. ¨ User problems: count, find, replace, … ¨ Encoding: fonts, color, size, layout, scrolling, selection capabilities, … ¨ Product example: text editor, browser, …
2 -D Data and Task Encoding ¨ Planar or map data: geographical maps, floor plans, newspaper layouts, … ¨ User problems: find adjacent items, search containment, find paths, filtering, details-on -demand, … ¨ Encoding: size, color, layout, arrangement, multiple layers, … ¨ Product example: CAD
3 -D Data and Task Encoding ¨ Real-world objects: building, human body ¨ User problems: adjacency in 3 -D, inside/outside relationship, position, orientation, occlusion ¨ Encoding: overviews, landmarks, transparency, color, perspective, stereo display ¨ Product example: CAD
Temporal Data and Task Encoding ¨ Time series data: medical records, project management, historical presentation ¨ User problems: finding all events before, after or during some time period or moment. ¨ Encoding: time lines
Multi-dimensional Data and Task Encoding ¨ Relational and statistical databases tuples. ¨ User problem: finding patterns, clusters, correlations, gaps, outliers. ¨ Challenge: – Simultaneously display many dimensions of large subsets of data. – Create displays that best encode the data pattern for a particular task. – Rapidly select a subset of tuples or dimensions.
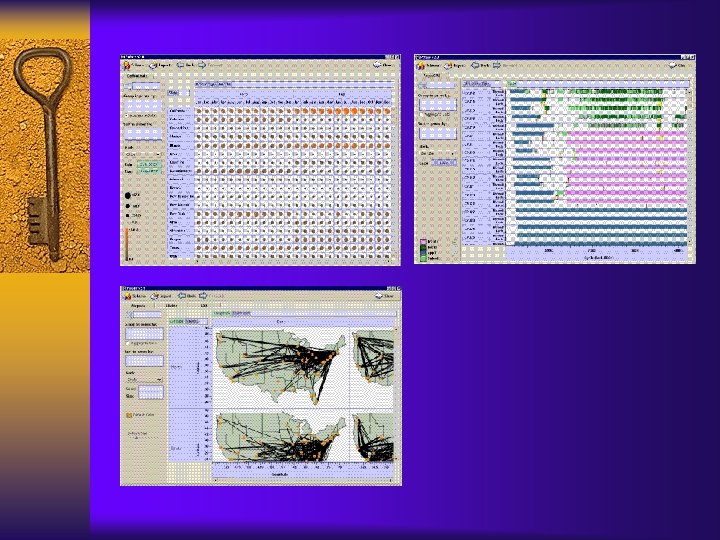
An Encoding Example
Dimensionality Encoding ¨ Multi-dimensional databases are structured as n-dimensional data cube. ¨ The dimensions of the data can be explicitly encoded in the structure of tables.
Data Set Encoding ¨ The data sources are encoded as layers. ¨ The different result sets are encoded as different panes in different layers.
User Interest Encoding ¨ Providing enough tools and allowing user to specify his interest. ¨ The table configuration encodes the user interest. ¨ Table configurations are defined in form of algebra – Concatenation – Cross product – Nest (Division)
¨ For ordinal fields, algebra operand symbols take all domain values. – A = domain (A) = {a 1, a 2, …, an} – Example: Month = {Jan, Feb, …, Dec} ¨ For quantitative fields, algebra operand symbols take the field names as values. – P = {P} – Example: Profit = {Profit} ¨ Ordinal fields partition the table into rows and columns; quantitative fields are spatially encoded as axes within the panes.
¨ Concatenation Example: – Quarter = {Qtr 1, Qtr 2, Qtr 4} – Product = {Coffee, Espresso, Herbal, Tea} – Profit = {Profit}, Sales = {Sales} Ordinal Field Quantitative Field Group By Sorted By
¨ Cross Product Example: – Ordinal x Ordinal - Ordinal x Quantitative
¨ Nest (Division) Example: - Quantitative field does not make sense for divisions
Product x Sum. Of. Sales Quarter x Sum. Of. Profit
Types of Graphics inside Panes ¨ Types of Panes: – Ordinal – Quantitative - Quantitative
Visual Encoding ¨ Shape ¨ Size ¨ Orientation ¨ Color
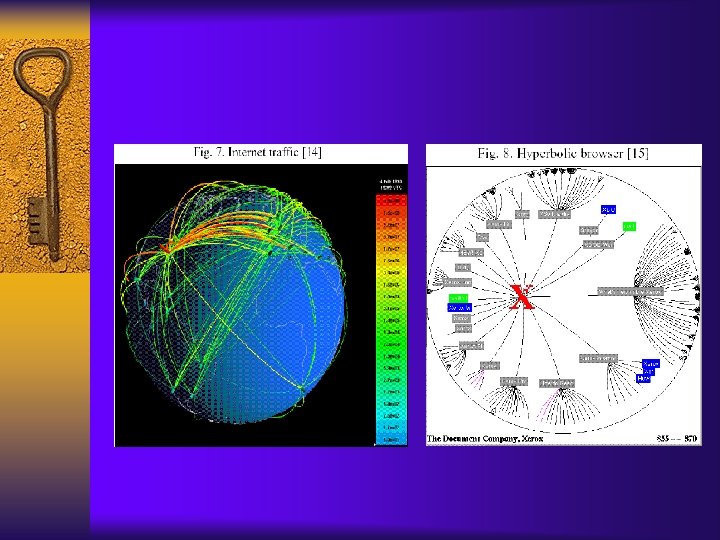
Tree Type Data and Task Encoding ¨ Exponential data: hierarchies, tree structures. ¨ User problems: find the structural properties – Height of the tree – Number of children – Find nodes with same attributes ¨ Encoding: – Outline style of indented labels
- Node-link diagrams: allowing the encoding of linkage between entities. - Treemap: child rectangles inside parent rectangles ¨ Product example: windows explorer, internet traffic, hyperbolic browser
Network Data and Task Encoding ¨ Graph data: multiple paths, cycles, lattices ¨ User problems: – Shortest path – Topology problems ¨ Encoding: imperfect – Node-link diagram – Matrix
General Encoding Principles ¨ Expressiveness: – Encode all the facts in the result set. – Encode only the facts in the result set. ¨ Effectiveness: – Depends on the capability of the perceiver. – Encode the more important information more effectively.
– Perceptual accuracy ranks
Conclusion ¨ Visualization helps – Information presentation – Information extraction ¨ Good visual encoding should match the target data and user problems. ¨ Studying the successful/unsuccessful visual encoding designs and techniques helps us to design and develop new encoding approaches.