Visualization and alerting with RRD Nagios XI and
![PNP Templates Building the RRD options $opt[1] = "--vertical-label "Disk Usage (%)" --height 200 PNP Templates Building the RRD options $opt[1] = "--vertical-label "Disk Usage (%)" --height 200](https://slidetodoc.com/presentation_image/2152840a9cb7bf4d728e8c72cd714371/image-12.jpg)
![Building Graph Definition Define the RRD data to test $def[1]. = "DEF: used 1=$rrdfile: Building Graph Definition Define the RRD data to test $def[1]. = "DEF: used 1=$rrdfile:](https://slidetodoc.com/presentation_image/2152840a9cb7bf4d728e8c72cd714371/image-13.jpg)
![Whats a DEF? DEF: <vname>=<rrdfile>: <ds-name>: <CF>[: step=<step>][: start=<time>][: end=<time>] This command fetches data Whats a DEF? DEF: <vname>=<rrdfile>: <ds-name>: <CF>[: step=<step>][: start=<time>][: end=<time>] This command fetches data](https://slidetodoc.com/presentation_image/2152840a9cb7bf4d728e8c72cd714371/image-14.jpg)
![Getting the LSL Trend $def[1]. = "VDEF: D 2=pused 2, LSLSLOPE "; # this Getting the LSL Trend $def[1]. = "VDEF: D 2=pused 2, LSLSLOPE "; # this](https://slidetodoc.com/presentation_image/2152840a9cb7bf4d728e8c72cd714371/image-17.jpg)
![Adding the Lines $def[1]. = "AREA: pused 1#BDF 400 AA: "Disk Usage % " Adding the Lines $def[1]. = "AREA: pused 1#BDF 400 AA: "Disk Usage % "](https://slidetodoc.com/presentation_image/2152840a9cb7bf4d728e8c72cd714371/image-18.jpg)
![Adding the Danger Zone $def[1]. = "AREA: danger 4#B 7009477 "; $def[1]. = "AREA: Adding the Danger Zone $def[1]. = "AREA: danger 4#B 7009477 "; $def[1]. = "AREA:](https://slidetodoc.com/presentation_image/2152840a9cb7bf4d728e8c72cd714371/image-19.jpg)
![Adding the Danger Dates $def[1]. = "COMMENT: "Reach 90% " "; $def[1]. = "GPRINT: Adding the Danger Dates $def[1]. = "COMMENT: "Reach 90% " "; $def[1]. = "GPRINT:](https://slidetodoc.com/presentation_image/2152840a9cb7bf4d728e8c72cd714371/image-21.jpg)



![Building the Check if [ "X$result" != "X" ] ; then # split results Building the Check if [ "X$result" != "X" ] ; then # split results](https://slidetodoc.com/presentation_image/2152840a9cb7bf4d728e8c72cd714371/image-35.jpg)



- Slides: 44

Visualization and alerting with RRD, Nagios XI, and PNP Rob Seiwert rob@vcaglobal. com

Introduction • IT Director for Video Corporation of America for the last 18 years. • Used Big Brother since Beta until 2011. • Used MRTG pre RRD and RRD from Beta. • Moved to Nagios Core in 2011. • Moved to Nagios XI in 2012.

Introduction & Agenda • • • A Real World Problem Trending and Prediction using RRD Creating Cool PNP Templates The problem with Cool Visualizations LSL and what does it all mean A Proactive Solution

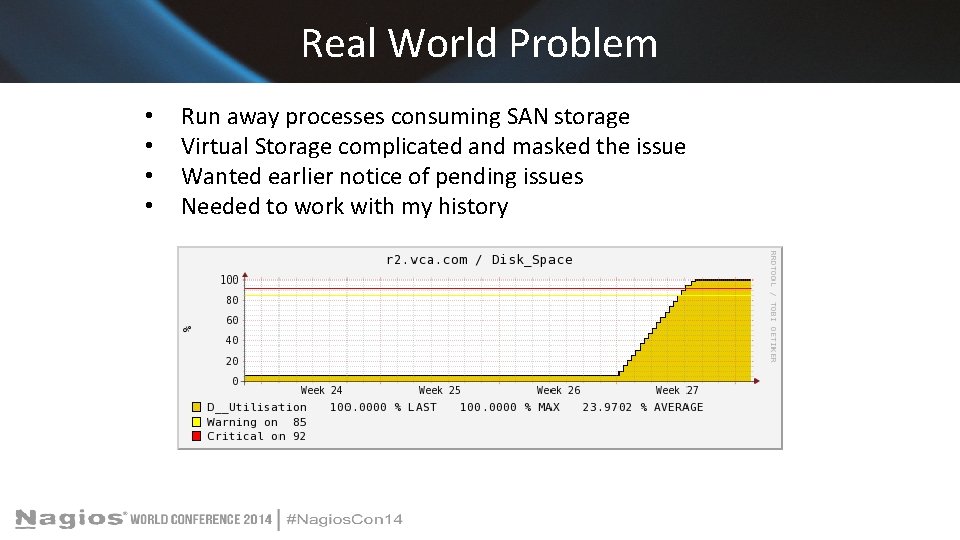
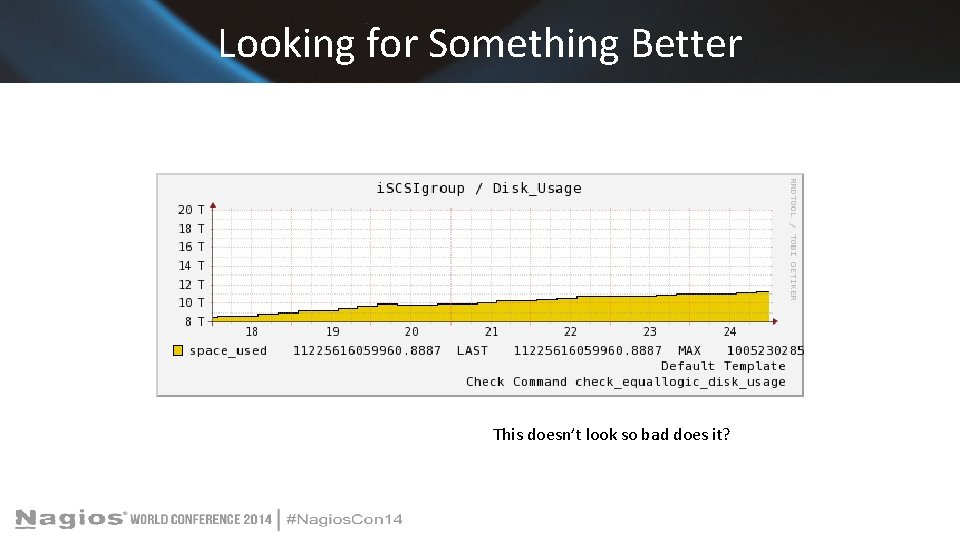
Real World Problem • • Run away processes consuming SAN storage Virtual Storage complicated and masked the issue Wanted earlier notice of pending issues Needed to work with my history

Looking for Something Better This doesn’t look so bad does it?

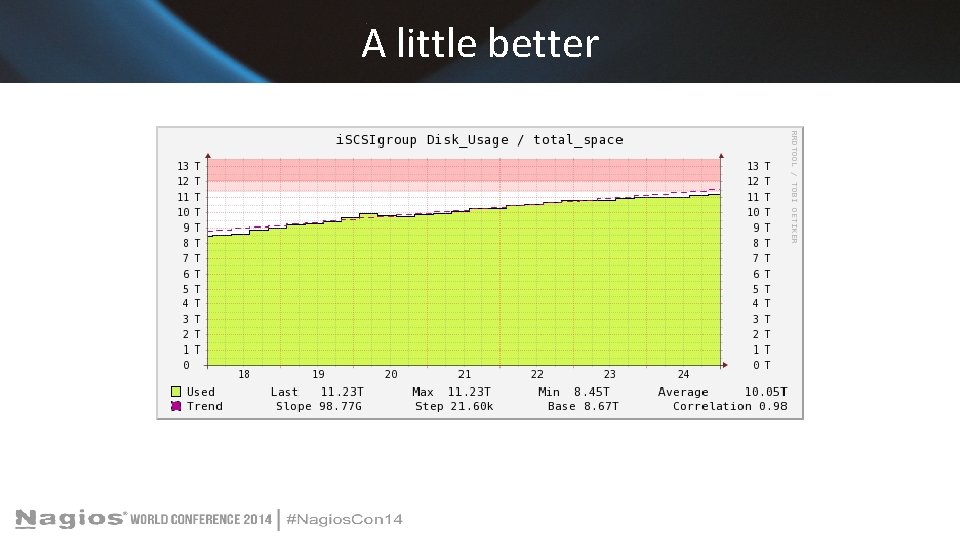
A little better

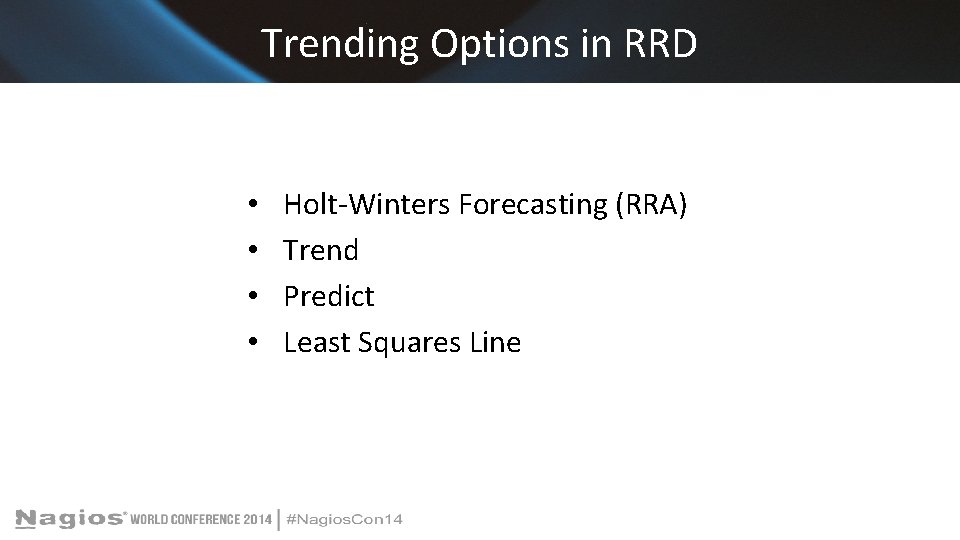
Trending Options in RRD • • Holt-Winters Forecasting (RRA) Trend Predict Least Squares Line

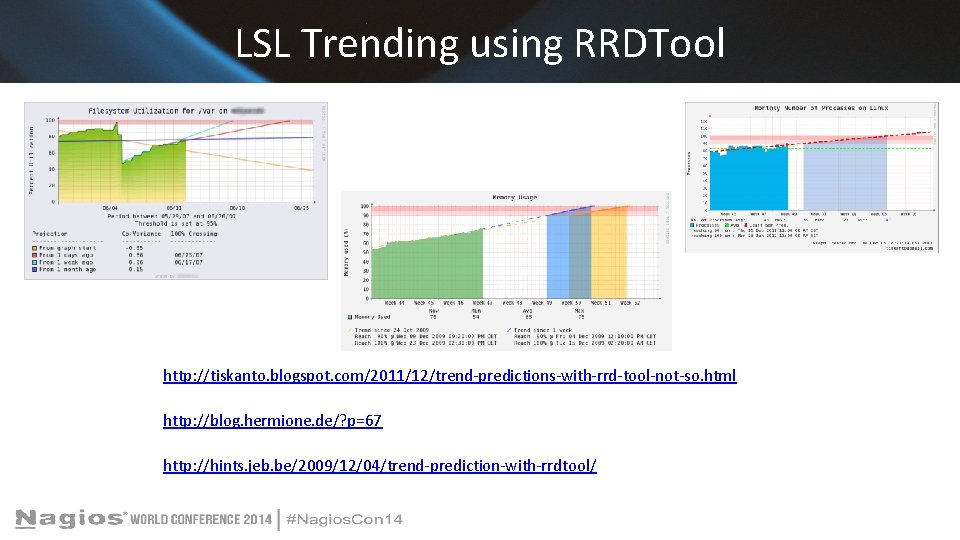
LSL Trending using RRDTool http: //tiskanto. blogspot. com/2011/12/trend-predictions-with-rrd-tool-not-so. html http: //blog. hermione. de/? p=67 http: //hints. jeb. be/2009/12/04/trend-prediction-with-rrdtool/

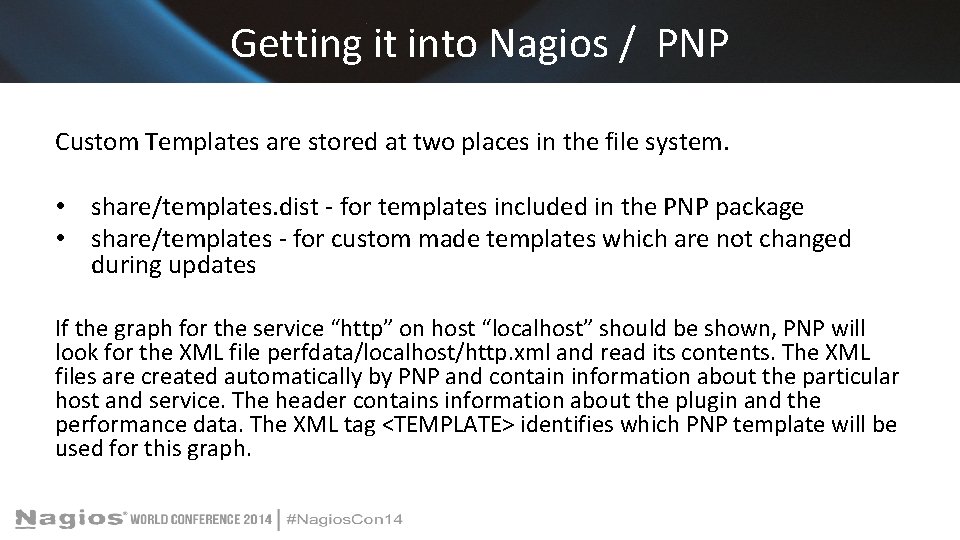
Getting it into Nagios / PNP Custom Templates are stored at two places in the file system. • share/templates. dist - for templates included in the PNP package • share/templates - for custom made templates which are not changed during updates If the graph for the service “http” on host “localhost” should be shown, PNP will look for the XML file perfdata/localhost/http. xml and read its contents. The XML files are created automatically by PNP and contain information about the particular host and service. The header contains information about the plugin and the performance data. The XML tag <TEMPLATE> identifies which PNP template will be used for this graph.

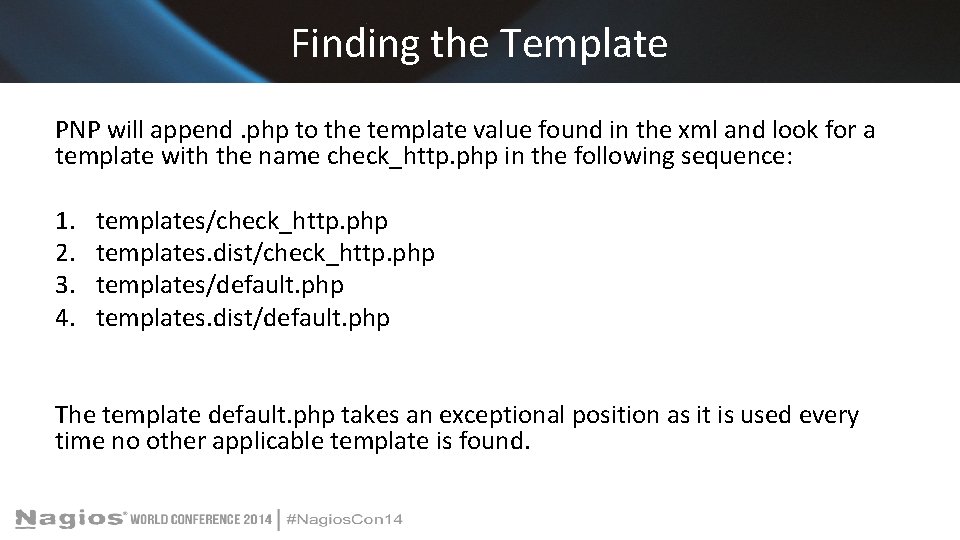
Finding the Template PNP will append. php to the template value found in the xml and look for a template with the name check_http. php in the following sequence: 1. 2. 3. 4. templates/check_http. php templates. dist/check_http. php templates/default. php templates. dist/default. php The template default. php takes an exceptional position as it is used every time no other applicable template is found.

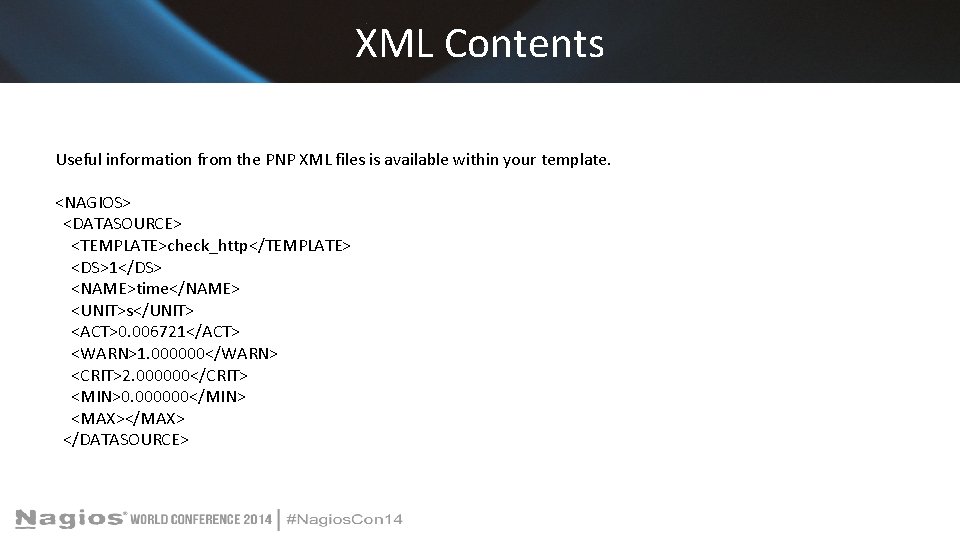
XML Contents Useful information from the PNP XML files is available within your template. <NAGIOS> <DATASOURCE> <TEMPLATE>check_http</TEMPLATE> <DS>1</DS> <NAME>time</NAME> <UNIT>s</UNIT> <ACT>0. 006721</ACT> <WARN>1. 000000</WARN> <CRIT>2. 000000</CRIT> <MIN>0. 000000</MIN> <MAX></MAX> </DATASOURCE>
![PNP Templates Building the RRD options opt1 verticallabel Disk Usage height 200 PNP Templates Building the RRD options $opt[1] = "--vertical-label "Disk Usage (%)" --height 200](https://slidetodoc.com/presentation_image/2152840a9cb7bf4d728e8c72cd714371/image-12.jpg)
PNP Templates Building the RRD options $opt[1] = "--vertical-label "Disk Usage (%)" --height 200 -l 0 -u 100 --upper-limit 100 --title " $hostname / $servicedesc" "; $opt[1]. = " --start now-7 d --end now+7 d --right-axis 1: 0 ";
![Building Graph Definition Define the RRD data to test def1 DEF used 1rrdfile Building Graph Definition Define the RRD data to test $def[1]. = "DEF: used 1=$rrdfile:](https://slidetodoc.com/presentation_image/2152840a9cb7bf4d728e8c72cd714371/image-13.jpg)
Building Graph Definition Define the RRD data to test $def[1]. = "DEF: used 1=$rrdfile: $DS[1]: AVERAGE "; # used 2 = data used to calc 1 day trend $def[1]. = "DEF: used 2=$rrdfile: $DS[1]: AVERAGE: start=now-1 d "; # used 2 = data used to calc 2 day trend $def[1]. = "DEF: used 3=$rrdfile: $DS[1]: AVERAGE: start=now-2 d "; # used 3 = data used to calc 1 week trend $def[1]. = "DEF: used 4=$rrdfile: $DS[1]: AVERAGE: start=now-7 d ";
![Whats a DEF DEF vnamerrdfile dsname CF stepstep starttime endtime This command fetches data Whats a DEF? DEF: <vname>=<rrdfile>: <ds-name>: <CF>[: step=<step>][: start=<time>][: end=<time>] This command fetches data](https://slidetodoc.com/presentation_image/2152840a9cb7bf4d728e8c72cd714371/image-14.jpg)
Whats a DEF? DEF: <vname>=<rrdfile>: <ds-name>: <CF>[: step=<step>][: start=<time>][: end=<time>] This command fetches data from an RRD file CDEF: vname=RPN expression This command creates a new set of data points (in memory only, not in the RRD file) out of one or more other data series. VDEF: vname=RPN expression This command returns a value and/or a time according to the RPN statements used.

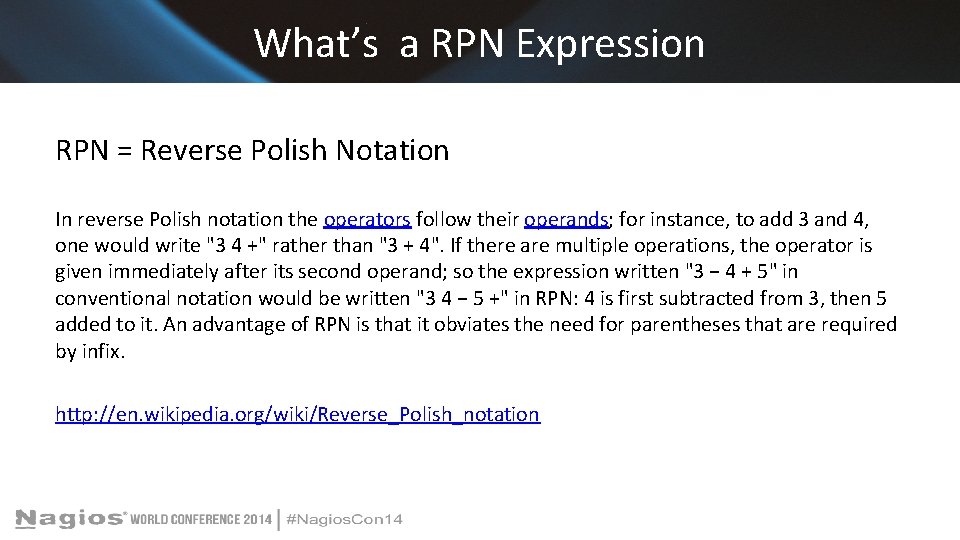
What’s a RPN Expression RPN = Reverse Polish Notation In reverse Polish notation the operators follow their operands; for instance, to add 3 and 4, one would write "3 4 +" rather than "3 + 4". If there are multiple operations, the operator is given immediately after its second operand; so the expression written "3 − 4 + 5" in conventional notation would be written "3 4 − 5 +" in RPN: 4 is first subtracted from 3, then 5 added to it. An advantage of RPN is that it obviates the need for parentheses that are required by infix. http: //en. wikipedia. org/wiki/Reverse_Polish_notation

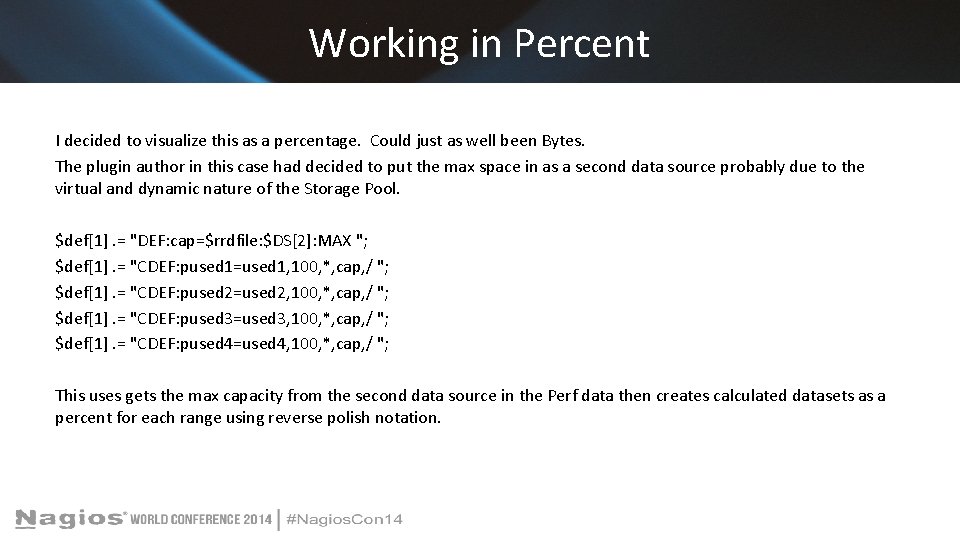
Working in Percent I decided to visualize this as a percentage. Could just as well been Bytes. The plugin author in this case had decided to put the max space in as a second data source probably due to the virtual and dynamic nature of the Storage Pool. $def[1]. = "DEF: cap=$rrdfile: $DS[2]: MAX "; $def[1]. = "CDEF: pused 1=used 1, 100, *, cap, / "; $def[1]. = "CDEF: pused 2=used 2, 100, *, cap, / "; $def[1]. = "CDEF: pused 3=used 3, 100, *, cap, / "; $def[1]. = "CDEF: pused 4=used 4, 100, *, cap, / "; This uses gets the max capacity from the second data source in the Perf data then creates calculated datasets as a percent for each range using reverse polish notation.
![Getting the LSL Trend def1 VDEF D 2pused 2 LSLSLOPE this Getting the LSL Trend $def[1]. = "VDEF: D 2=pused 2, LSLSLOPE "; # this](https://slidetodoc.com/presentation_image/2152840a9cb7bf4d728e8c72cd714371/image-17.jpg)
Getting the LSL Trend $def[1]. = "VDEF: D 2=pused 2, LSLSLOPE "; # this is the slope (m) $def[1]. = "VDEF: H 2=pused 2, LSLINT "; # this is the y intercept $def[1]. = "VDEF: C 2=pused 2, LSLCORREL "; # this is the Correlation Coeffient $def[1]. = "CDEF: trend 2=pused 2, POP, D 2, COUNT, *, H 2, + "; # new cdef with trend $def[1]. = "CDEF: trend 2 limit=trend 2, 0, 100, LIMIT "; # trim the trend to run from 0 to 100 $def[1]. = "CDEF: danger 2=trend 2, 90, 100, LIMIT "; # find the danger zone $def[1]. = "VDEF: min 2=danger 2, FIRST "; # datapoint that crosses 90% $def[1]. = "VDEF: max 2=danger 2, LAST "; # returns the datapoint that crosses 100% The forth line creates the trend line. Each cdef must have a time reference so we push a dataset into the equation and pop it off. This just gives us a valid cdef. Next push the slope and count (aka x) and multiply them. Next we add in the y intercept. Basically line 4 builds a data set using the equation: y = mx + b Repeat for all other data sets you want to trend. At this point we have all we need. Time to make the chart
![Adding the Lines def1 AREA pused 1BDF 400 AA Disk Usage Adding the Lines $def[1]. = "AREA: pused 1#BDF 400 AA: "Disk Usage % "](https://slidetodoc.com/presentation_image/2152840a9cb7bf4d728e8c72cd714371/image-18.jpg)
Adding the Lines $def[1]. = "AREA: pused 1#BDF 400 AA: "Disk Usage % " "; $def[1]. = "LINE 1: pused 1#000000 "; $def[1]. = "LINE 1: trend 4 limit#B 70094: "Trend last Week ": dashes "; $def[1]. = "LINE 1: trend 3 limit#0077 FF: "Trend last 2 Days ": dashes "; $def[1]. = "LINE 1: trend 2 limit#FF 9900: "Trend last 24 Hours\n": dashes ";
![Adding the Danger Zone def1 AREA danger 4B 7009477 def1 AREA Adding the Danger Zone $def[1]. = "AREA: danger 4#B 7009477 "; $def[1]. = "AREA:](https://slidetodoc.com/presentation_image/2152840a9cb7bf4d728e8c72cd714371/image-19.jpg)
Adding the Danger Zone $def[1]. = "AREA: danger 4#B 7009477 "; $def[1]. = "AREA: danger 3#0077 FF 77 "; $def[1]. = "AREA: danger 2#FF 990077 "; $def[1]. = "LINE 2: danger 4#B 70094 "; $def[1]. = "LINE 2: danger 3#0077 FF "; $def[1]. = "LINE 2: danger 2#FF 9900 ";

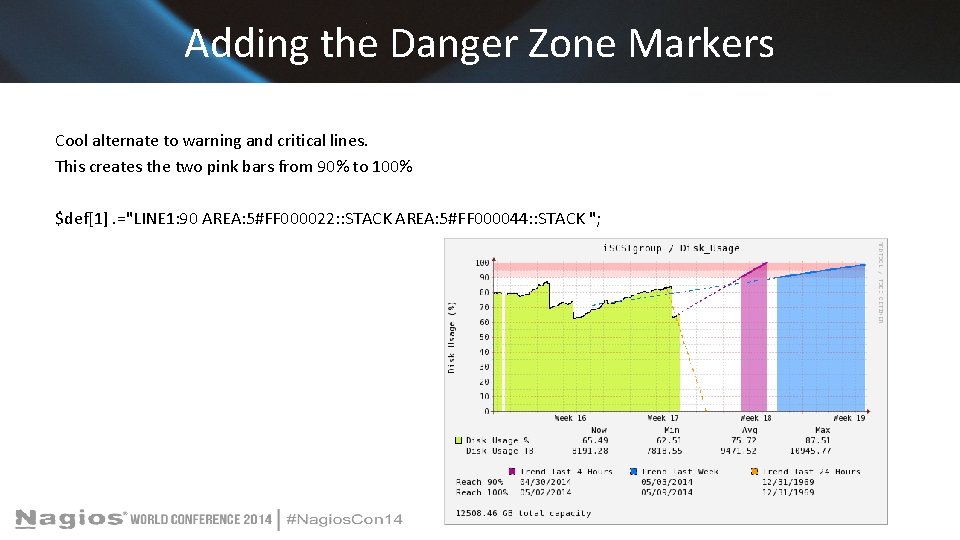
Adding the Danger Zone Markers Cool alternate to warning and critical lines. This creates the two pink bars from 90% to 100% $def[1]. ="LINE 1: 90 AREA: 5#FF 000022: : STACK AREA: 5#FF 000044: : STACK ";
![Adding the Danger Dates def1 COMMENT Reach 90 def1 GPRINT Adding the Danger Dates $def[1]. = "COMMENT: "Reach 90% " "; $def[1]. = "GPRINT:](https://slidetodoc.com/presentation_image/2152840a9cb7bf4d728e8c72cd714371/image-21.jpg)
Adding the Danger Dates $def[1]. = "COMMENT: "Reach 90% " "; $def[1]. = "GPRINT: min 4: "%x": strftime "; $def[1]. = "GPRINT: min 3: "%21 x": strftime "; $def[1]. = "GPRINT: min 2: "%21 x\n": strftime "; $def[1]. = "COMMENT: "Reach 100%" "; $def[1]. = "GPRINT: max 4: "%x": strftime "; $def[1]. = "GPRINT: max 3: "%21 x": strftime "; $def[1]. = "GPRINT: max 2: "%21 x\n": strftime ";

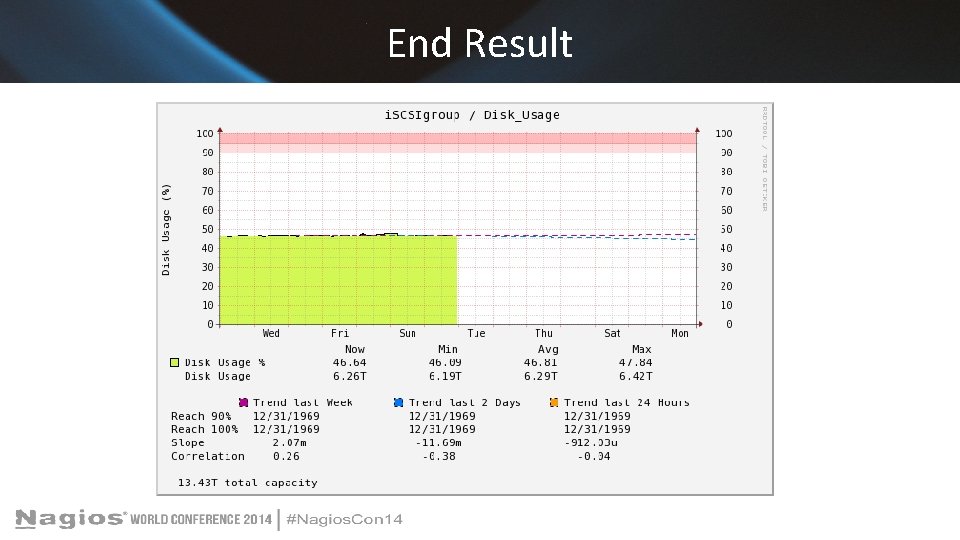
End Result

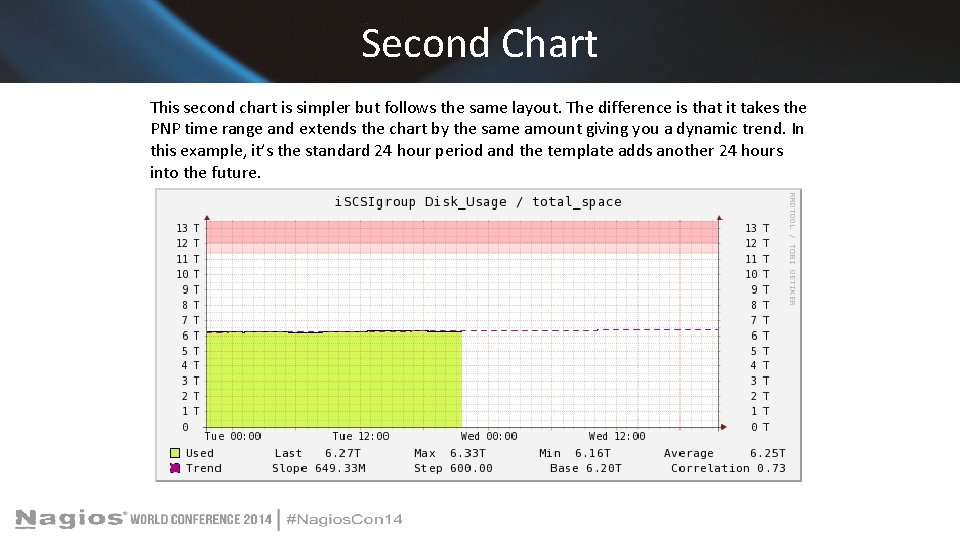
Second Chart This second chart is simpler but follows the same layout. The difference is that it takes the PNP time range and extends the chart by the same amount giving you a dynamic trend. In this example, it’s the standard 24 hour period and the template adds another 24 hours into the future.

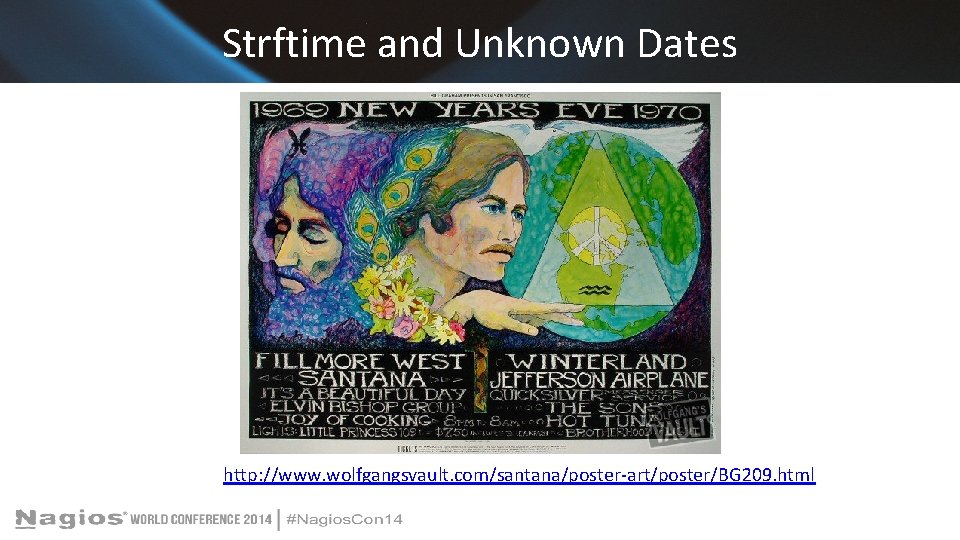
Strftime and Unknown Dates http: //www. wolfgangsvault. com/santana/poster-art/poster/BG 209. html

The Problem with Pretty Charts Had my chart that predicted when my SAN would hit 100%. As disk usage increased and decreased you could see the trending lines jump. The problem with cool visualizations is that they have to be watched. It seemed to me that it should be possible to build an alert using the data available in RRD.

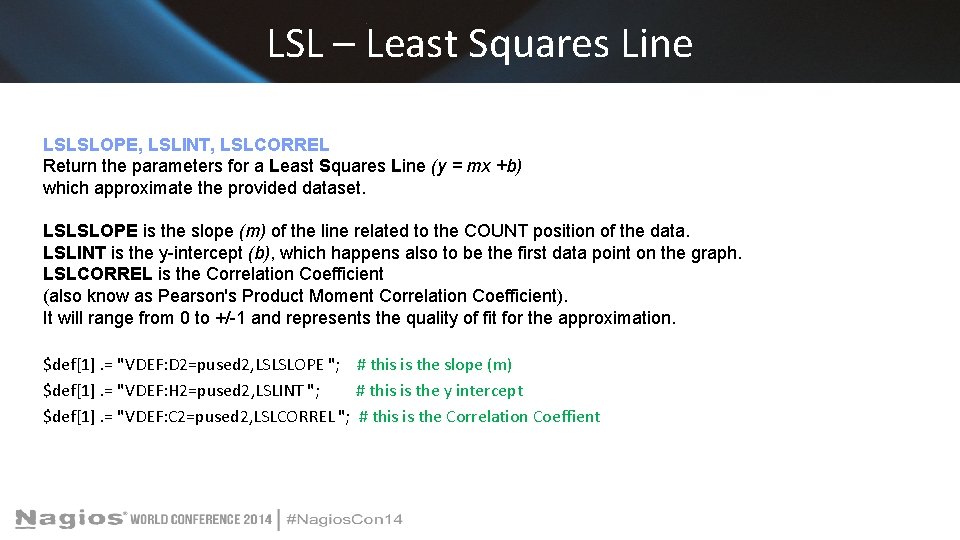
LSL – Least Squares Line LSLSLOPE, LSLINT, LSLCORREL Return the parameters for a Least Squares Line (y = mx +b) which approximate the provided dataset. LSLSLOPE is the slope (m) of the line related to the COUNT position of the data. LSLINT is the y-intercept (b), which happens also to be the first data point on the graph. LSLCORREL is the Correlation Coefficient (also know as Pearson's Product Moment Correlation Coefficient). It will range from 0 to +/-1 and represents the quality of fit for the approximation. $def[1]. = "VDEF: D 2=pused 2, LSLSLOPE "; # this is the slope (m) $def[1]. = "VDEF: H 2=pused 2, LSLINT "; # this is the y intercept $def[1]. = "VDEF: C 2=pused 2, LSLCORREL "; # this is the Correlation Coeffient

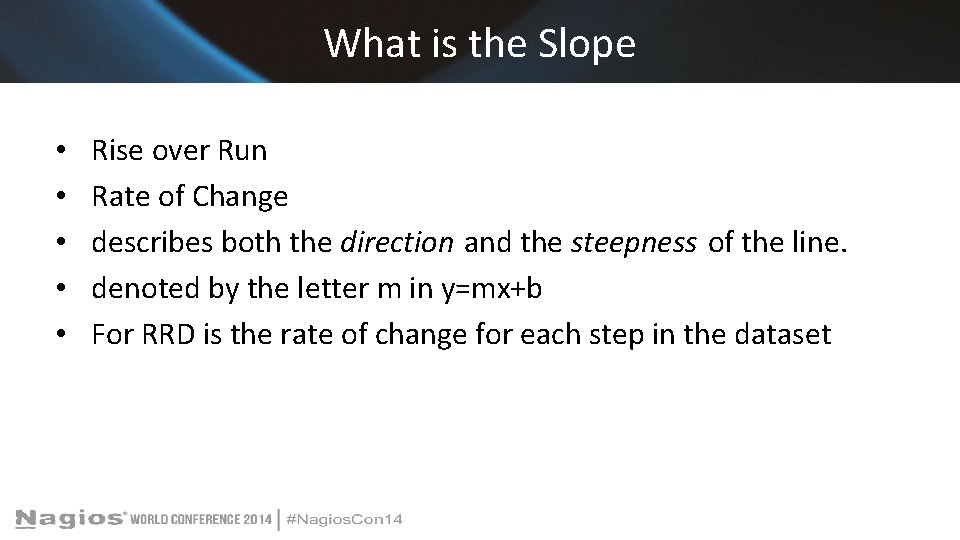
What is the Slope • • • Rise over Run Rate of Change describes both the direction and the steepness of the line. denoted by the letter m in y=mx+b For RRD is the rate of change for each step in the dataset

What is the Y-Intercept The point at which a curve or function crosses the y-axis Basically the Starting point for Y when X=0

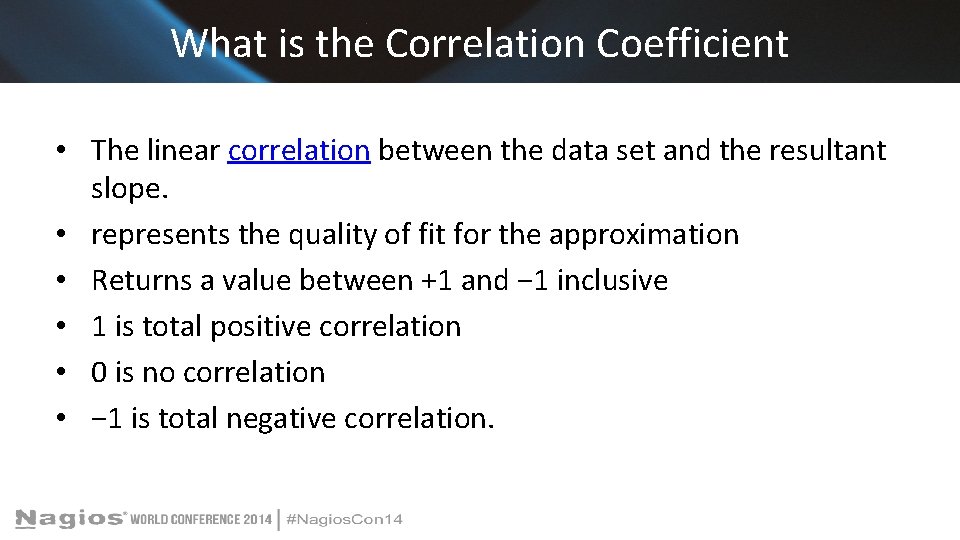
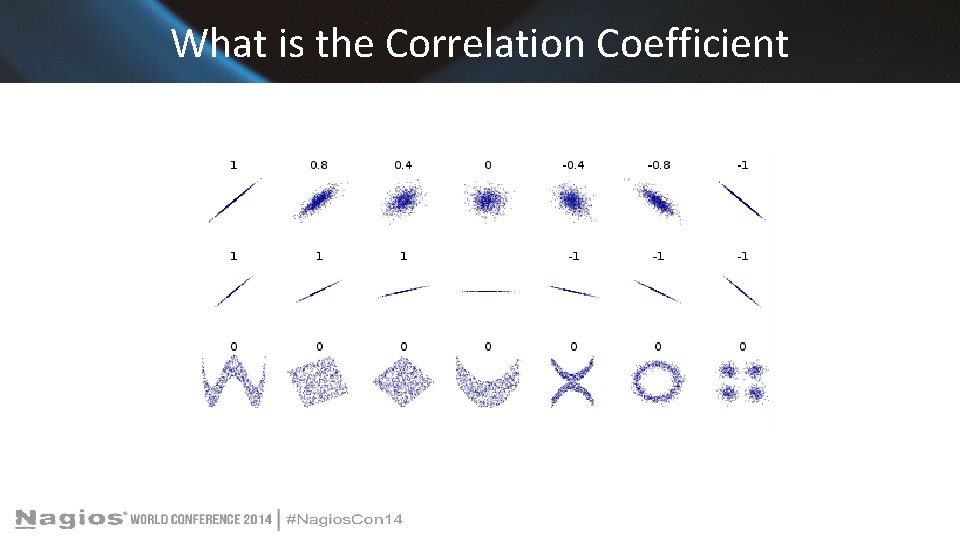
What is the Correlation Coefficient • The linear correlation between the data set and the resultant slope. • represents the quality of fit for the approximation • Returns a value between +1 and − 1 inclusive • 1 is total positive correlation • 0 is no correlation • − 1 is total negative correlation.

What is the Correlation Coefficient

What is the Correlation Coefficient

Solving for X Knowing the maximum capacity for y (100%) and y=mx+b after calculating the LSLSlope(m) and the LSLINT(b) we can solve for x. x=(y-b)/m Question is what is X really?

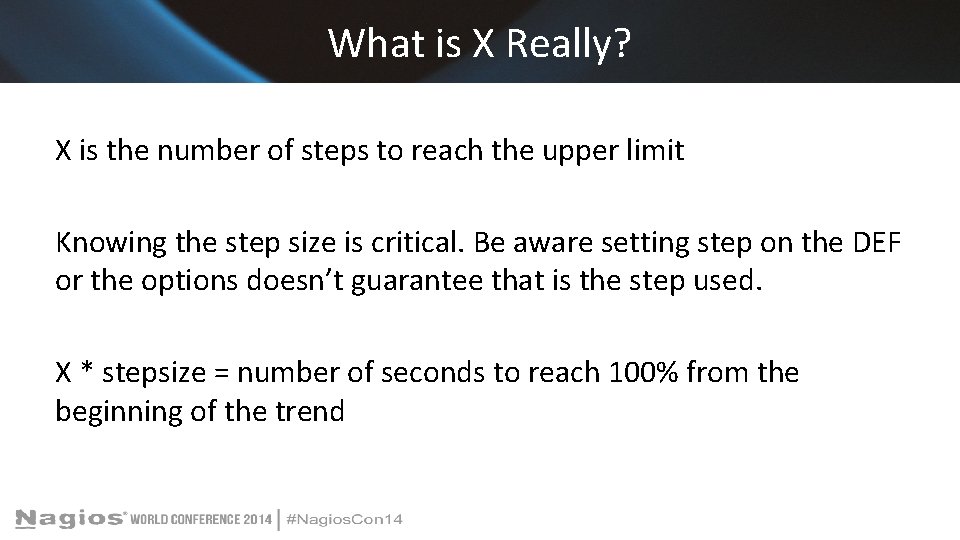
What is X Really? X is the number of steps to reach the upper limit Knowing the step size is critical. Be aware setting step on the DEF or the options doesn’t guarantee that is the step used. X * stepsize = number of seconds to reach 100% from the beginning of the trend

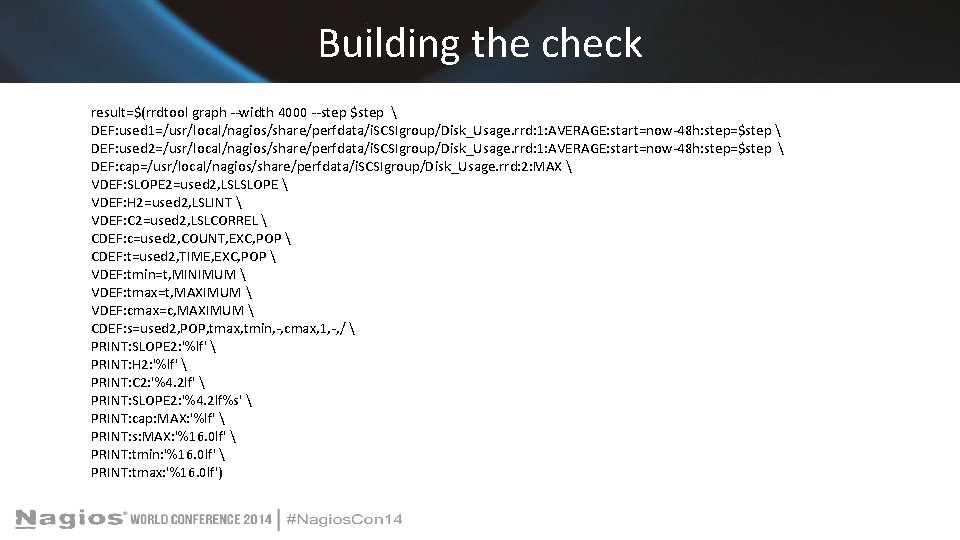
Building the check result=$(rrdtool graph --width 4000 --step $step DEF: used 1=/usr/local/nagios/share/perfdata/i. SCSIgroup/Disk_Usage. rrd: 1: AVERAGE: start=now-48 h: step=$step DEF: used 2=/usr/local/nagios/share/perfdata/i. SCSIgroup/Disk_Usage. rrd: 1: AVERAGE: start=now-48 h: step=$step DEF: cap=/usr/local/nagios/share/perfdata/i. SCSIgroup/Disk_Usage. rrd: 2: MAX VDEF: SLOPE 2=used 2, LSLSLOPE VDEF: H 2=used 2, LSLINT VDEF: C 2=used 2, LSLCORREL CDEF: c=used 2, COUNT, EXC, POP CDEF: t=used 2, TIME, EXC, POP VDEF: tmin=t, MINIMUM VDEF: tmax=t, MAXIMUM VDEF: cmax=c, MAXIMUM CDEF: s=used 2, POP, tmax, tmin, -, cmax, 1, -, / PRINT: SLOPE 2: '%lf' PRINT: H 2: '%lf' PRINT: C 2: '%4. 2 lf' PRINT: SLOPE 2: '%4. 2 lf%s' PRINT: cap: MAX: '%lf' PRINT: s: MAX: '%16. 0 lf' PRINT: tmin: '%16. 0 lf' PRINT: tmax: '%16. 0 lf')
![Building the Check if Xresult X then split results Building the Check if [ "X$result" != "X" ] ; then # split results](https://slidetodoc.com/presentation_image/2152840a9cb7bf4d728e8c72cd714371/image-35.jpg)
Building the Check if [ "X$result" != "X" ] ; then # split results to $1 $2 etc set $result else # no results must be error exit fi timerange="Data Analyized Starting $(date -d @$8) - Ending $(date -d @$9)" # $2 = Slope = m # $3 = y-intercept = b # $4 = Corralation Coefficient # $5 = Slope, SI Scaled # $6 = Max Capacity # $7 = Step # $8 = Start Time (sec since epoch) # $9 = End Time (secs since epoch)

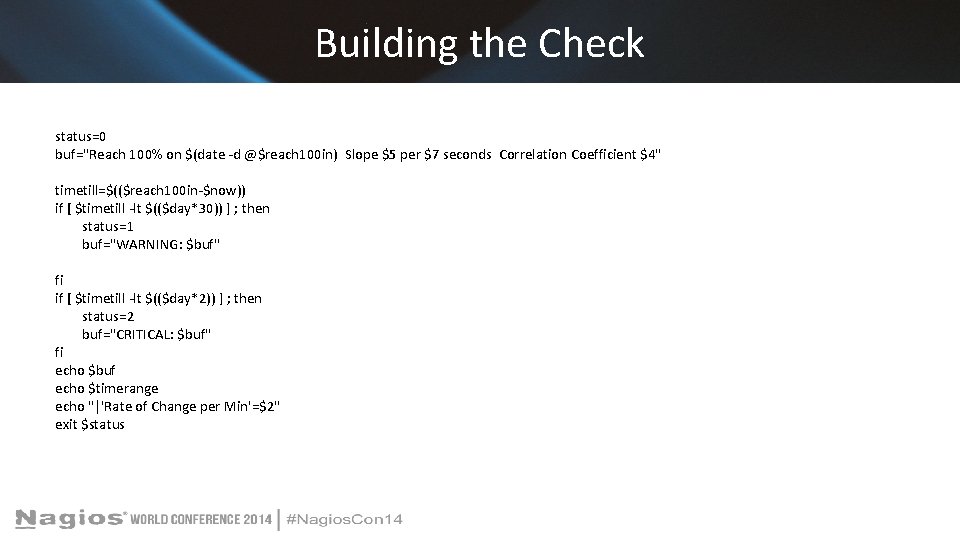
Building the Check status=0 buf="Reach 100% on $(date -d @$reach 100 in) Slope $5 per $7 seconds Correlation Coefficient $4" timetill=$(($reach 100 in-$now)) if [ $timetill -lt $(($day*30)) ] ; then status=1 buf="WARNING: $buf" fi if [ $timetill -lt $(($day*2)) ] ; then status=2 buf="CRITICAL: $buf" fi echo $buf echo $timerange echo "|'Rate of Change per Min'=$2" exit $status

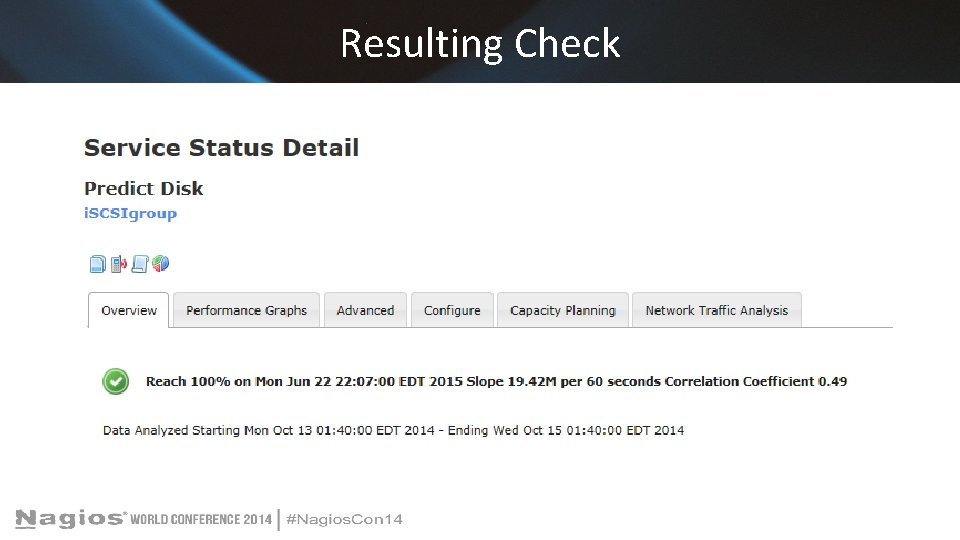
Resulting Check

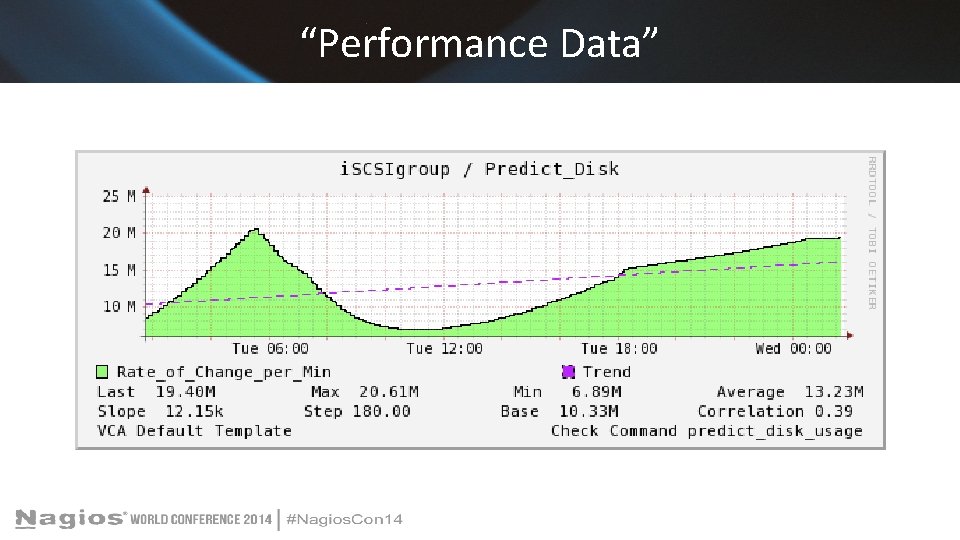
“Performance Data”

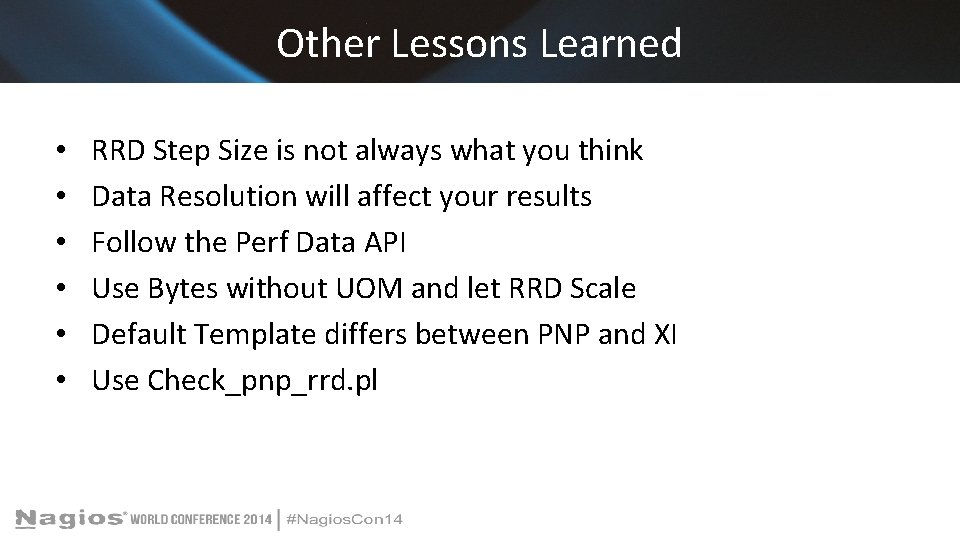
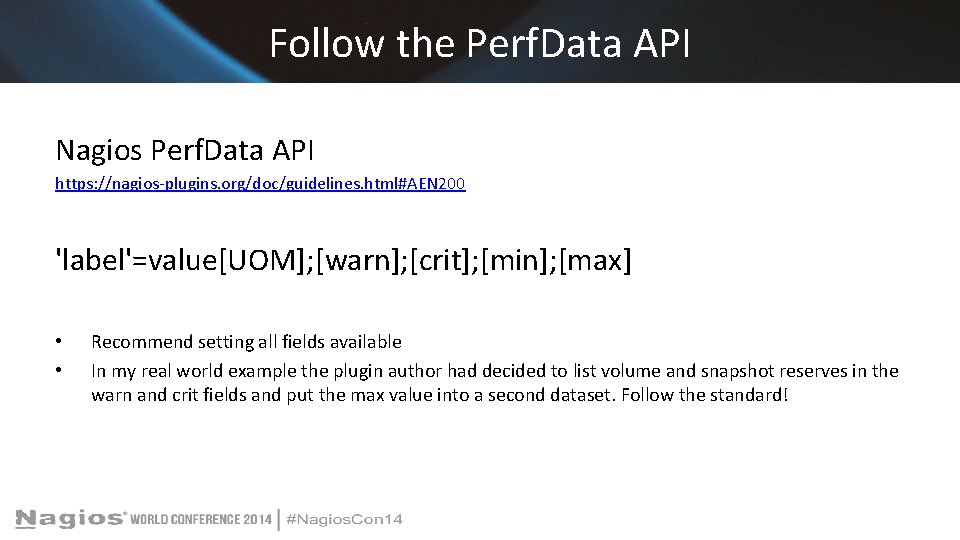
Other Lessons Learned • • • RRD Step Size is not always what you think Data Resolution will affect your results Follow the Perf Data API Use Bytes without UOM and let RRD Scale Default Template differs between PNP and XI Use Check_pnp_rrd. pl

Follow the Perf. Data API Nagios Perf. Data API https: //nagios-plugins. org/doc/guidelines. html#AEN 200 'label'=value[UOM]; [warn]; [crit]; [min]; [max] • • Recommend setting all fields available In my real world example the plugin author had decided to list volume and snapshot reserves in the warn and crit fields and put the max value into a second dataset. Follow the standard!

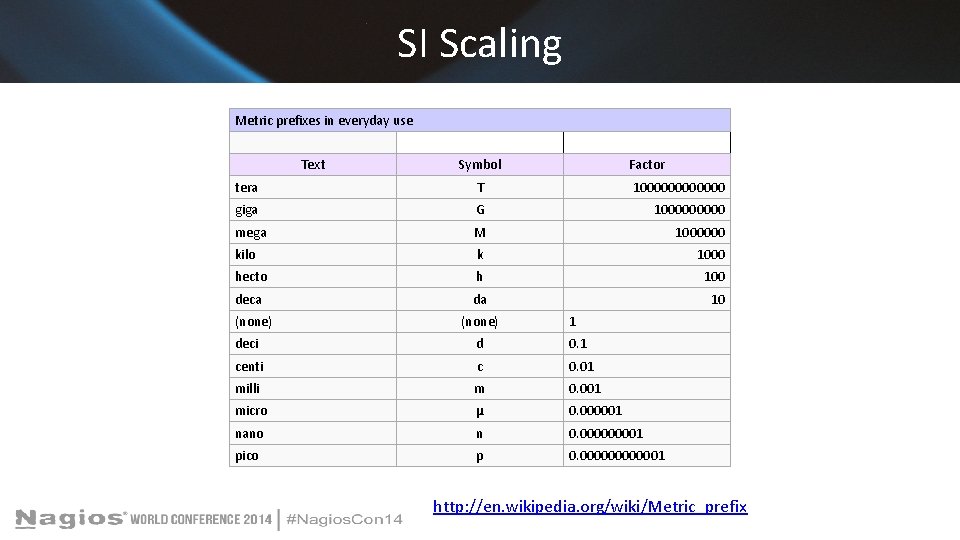
SI: Le Système International d'Unités The International System of Units the modern form of the metric system and is the world's most widely used system of measurement. It comprises a coherent system of units of measurement built around seven base units, http: //en. wikipedia. org/wiki/Second

SI Scaling Metric prefixes in everyday use Text Symbol Factor tera T 1000000 giga G 100000 mega M 1000000 kilo k 1000 hecto h 100 deca da 10 (none) 1 deci d 0. 1 centi c 0. 01 milli m 0. 001 micro μ 0. 000001 nano n 0. 00001 pico p 0. 0000001 http: //en. wikipedia. org/wiki/Metric_prefix

Questions? Any questions? Thanks!

The End Robert C. Seiwert rob@vcaglobal. com