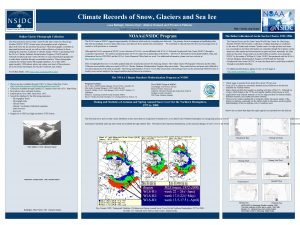
Visualisation of changes in alpine glaciers in western


- Slides: 38

Visualisation of changes in alpine glaciers in western Canada Roger Wheate, University of Northern BC Mt. Sir Mac. Donald and Illecillewaet Glacier, 1902 (~end of Little Ice Age (LIA)

Illecillewaet Glacier, Glacier National Park 1885

2011


Thompson Glacier, Axel Heiberg Island, 1965

Glaciers viewed as constant in 1960 s-70 s

1981 Columbia Icefield elevation data are not updated: roads, glaciers from 1980; contours from 1960

Western Canada (BC / Alberta) ~15, 000 glaciers BC ~25, 000 km 2 Alberta: 1, 000 km 2

Mt. Edziza 1965 yellow 1982 red (from air photo mapping) 2005 white (Landsat) accumulation area - black

Robson Glacier

1923 British Columbia-Alberta boundary commission map

Cambrian Icefield, Coast Mountains

Maligne Lake glaciers, Jasper NP Maligne Lake area 1930 -2010: total loss of 33. 07 km 2 (from 79. 5 km 2) or - 0. 52% per year. Between 2000 and 2010, the rate increased to 2. 23% per year

Thinning Retreat Sources: map contours, stereo photography, spaceborne DEMs: e. g. SRTM, ASTER GDEM Sources: maps, air photos, satellite images Current changes ~ -5 m/year Current changes ~ -20 m/year

Techniques for showing elevation change (DEM subtraction: Haeberli and Paul, 2009)

Hoodoo Mountain area: Landsat TM 2010

Hoodoo Glacier: extents 1965 to 2005 (overlain on Landsat TM 2010) 1965, 1982 from aerial photos, 1999 and 2005 from Landsat

NTDB 1965: DEM from contours; geogratis. ca

BC ‘TRIM’ mapping 1982: digital stereophotography; geobase. ca

Shuttle Radar Topography Mission (SRTM) 1999 (spaceborne)

ASTER GDEM 2000 – 2008 (~2004) multiple images

DEM Difference Image: NTDB (1965) – ASTER (2004)

Salmon Glacier area Alaska / BC NTDB 1965

BC TRIM 1985

SRTM 1999

ASTER 2004

DEM subtraction NTDB – ASTER 0 -230 m (unclassed) 230 0

Final map product

Severnaya Zemlya: Glacier changes 1980 -2000 s dib. joanneum. at/smaragd

Severnaya Zemlya: Glacier changes in 1980 -2000 s

Glob. Glacier workshop, Zermatt 01/09/2010 Landsat image, Zermatt 01/09/2010 downloaded 03/09/2010 – geotiff (free Landsat archive: glovis. usgs. gov)

December 1989

January 2010

Feb 2006

April 2004

June 2006

August 2005

Final slide * Visualisation images to be displayed at: glacierchange. org (public input website run by Ph. D student Matt Beedle) * New millennium global glacier extents: glims. org/RGI/randolph. html Acknowledgements Thanks to reviewers comments Selected images by : Anastasia Gurov, Ulrike Schinke, Jacob Trultzch (Dresden TU) Sabrina Marx, Marlene Baumgart (Bonn, Heidelberg)
 Alpine vs continental glaciers
 R081 revision
 Pre production visualisation diagram
 Mona chalabi charts
 Total station visualisation
 Qperm
Qperm Picture visualisation
 Visualisation
 Bread crumb complicated cataract
 Changes on the western frontier
 Chapter 7 glaciers deserts and wind
 Chapter 5 glaciers oceans and landscapes
 How can a glacier deposit both sorted and unsorted material
 Nsidc glaciers
 Glaciers cause erosion by abrasion and
 Angular sedimentary rocks
 Examples of mass movement
 Bolivia glaciers
 Arrowhead region mn
 Glacier movement
 Elizabeth mulroney
 Physical changes
 Loren french
 Alpine glacier
 Ulike bretyper
 Www. alpineskihouse.com
 Tundra fauna and flora
 Alberta ski team
 Ecosistemul unei pajisti alpine
 Hoigaards tent sale
 Tundra region in world map
 Germany and the alpine countries
 Alpine commercial real estate
 Alpine ski house
 Alpine waste disposal
 Alpine ski house
 Alpine
 Edina alpine ski team
 Armorican fold mountains
