
Visual Vibrometry Estimating Material Properties from Small Motions
Visual Vibrometry: Estimating Material Properties from Small Motions in Video Presented by Deblina Bhattacharjee Intelligent Media Research Centre, Postech- Samsung
Visual Vibrometry Intelligent Media Lab @ POSTECH Approach q Presents a technique to estimaterial properties for objects with fixed or known geometry from small motions in video. q Solid objects tend to vibrate at a set of preferred frequencies. q These vibrations occur at frequencies outside the range of human visual perception. q These vibrations can be recovered from video, even for motion smaller than 1 pixel.
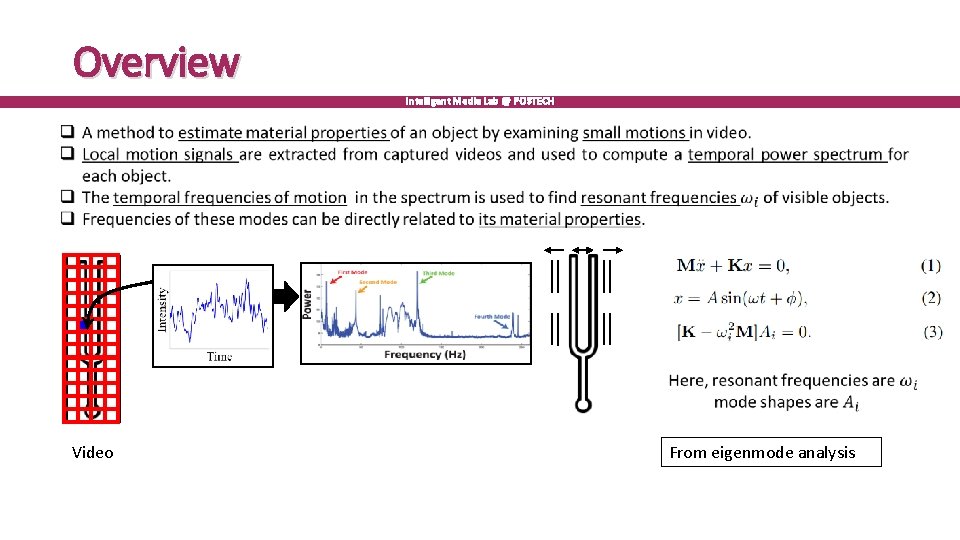
Overview Intelligent Media Lab @ POSTECH Video From eigenmode analysis
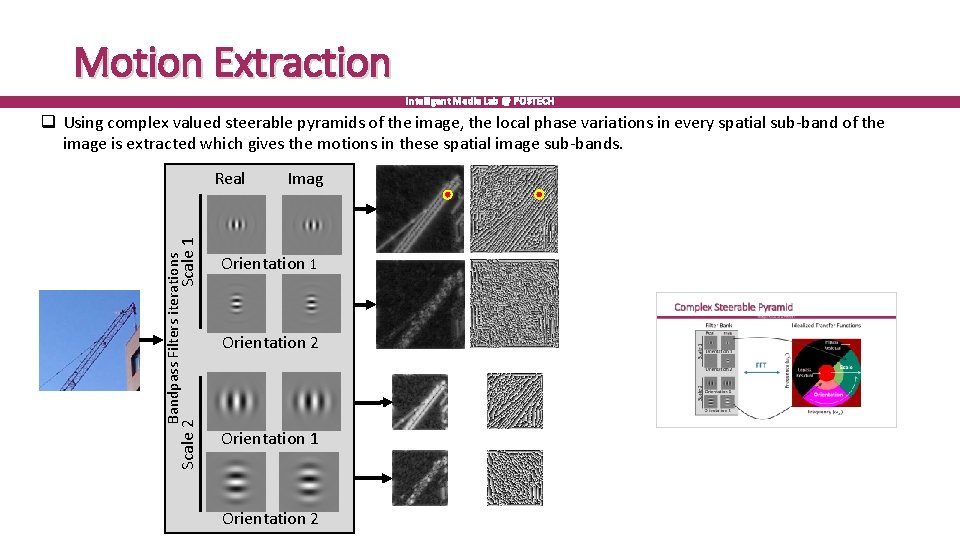
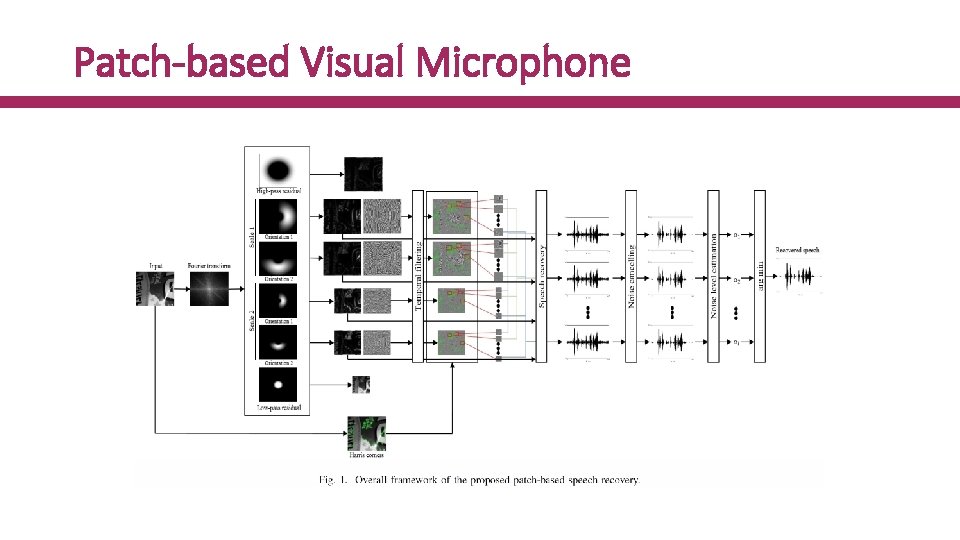
Motion Extraction Intelligent Media Lab @ POSTECH Scale 2 Bandpass Filters iterations Scale 1 q Using complex valued steerable pyramids of the image, the local phase variations in every spatial sub-band of the image is extracted which gives the motions in these spatial image sub-bands. Imag Real Orientation 1 Orientation 2
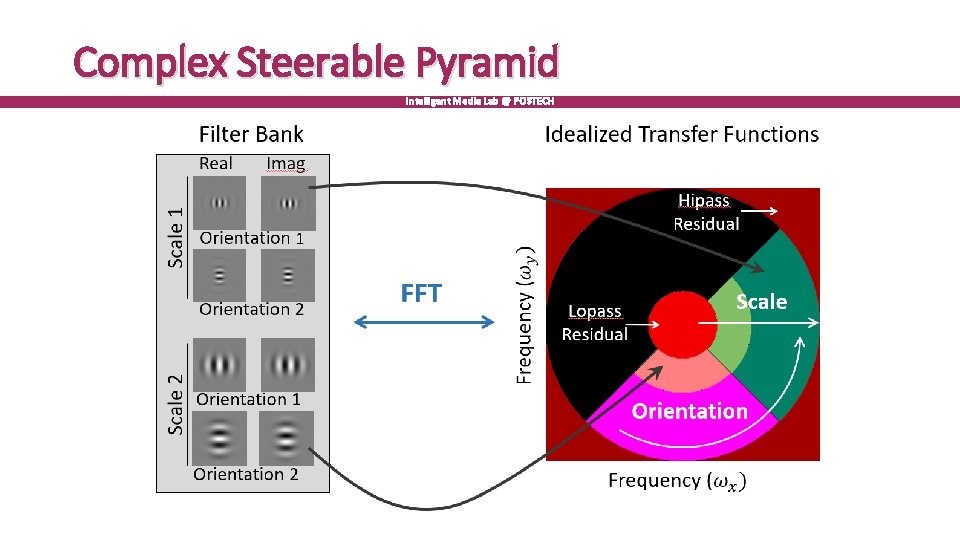
Complex Steerable Pyramid Intelligent Media Lab @ POSTECH
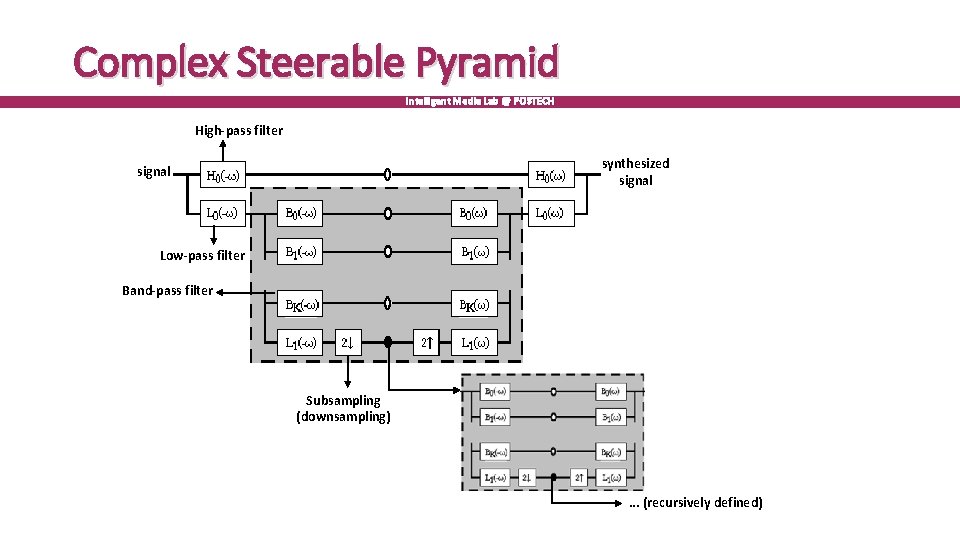
Complex Steerable Pyramid Intelligent Media Lab @ POSTECH High-pass filter synthesized signal Low-pass filter Band-pass filter Subsampling (downsampling) . . . (recursively defined)
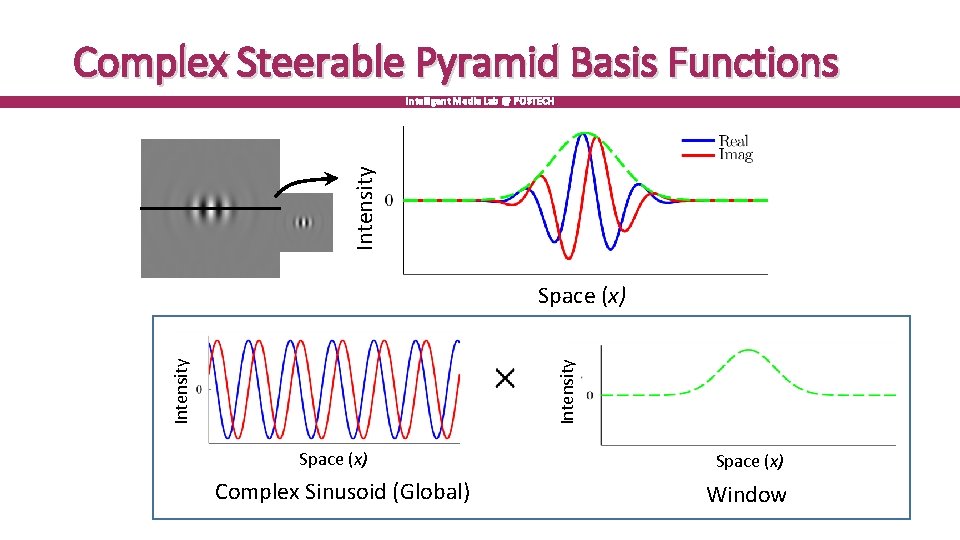
Complex Steerable Pyramid Basis Functions Intensity Intelligent Media Lab @ POSTECH Intensity Space (x) Complex Sinusoid (Global) Intensity Space (x) Window
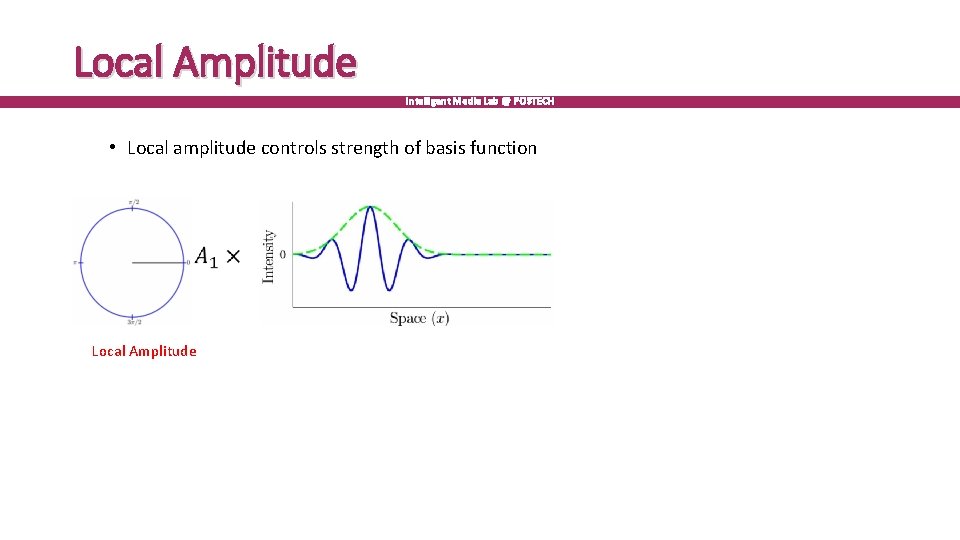
Local Amplitude Intelligent Media Lab @ POSTECH • Local amplitude controls strength of basis function Single Sub-band of Image Profile Local Amplitude
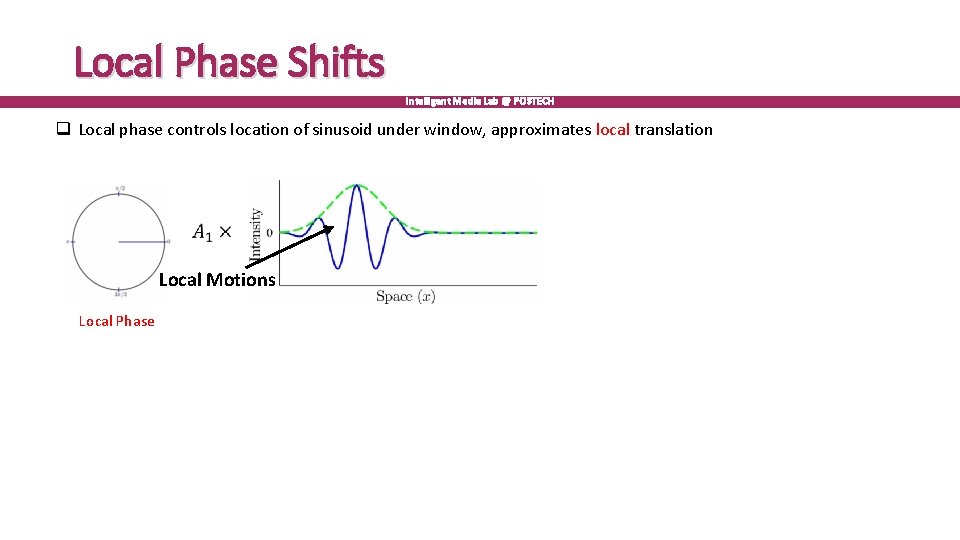
Local Phase Shifts Intelligent Media Lab @ POSTECH q Local phase controls location of sinusoid under window, approximates local translation Local Motions Single Sub-band of Image Profile Local Phase
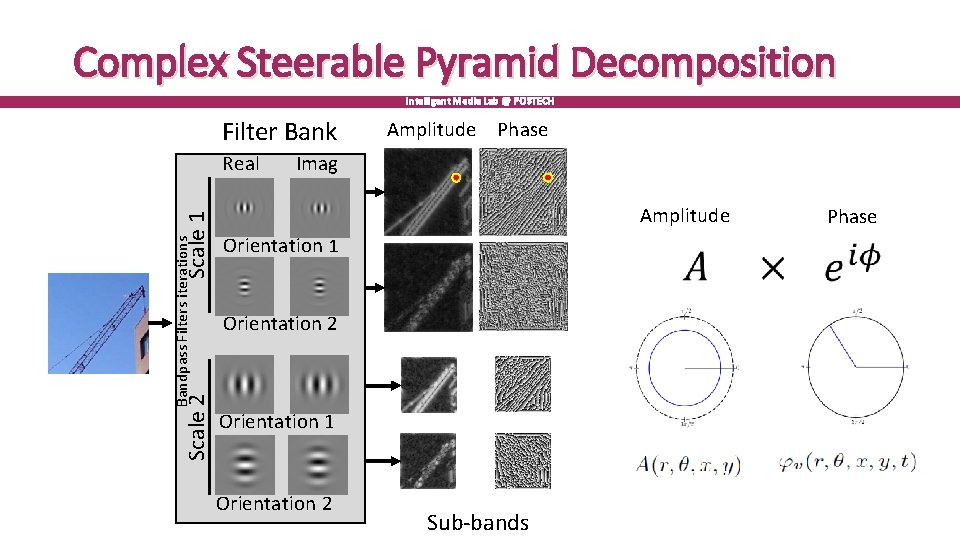
Complex Steerable Pyramid Decomposition Intelligent Media Lab @ POSTECH Filter Bank Scale 2 Bandpass Filters iterations Scale 1 Real Amplitude Phase Imag Amplitude Orientation 1 Orientation 2 Sub-bands Phase
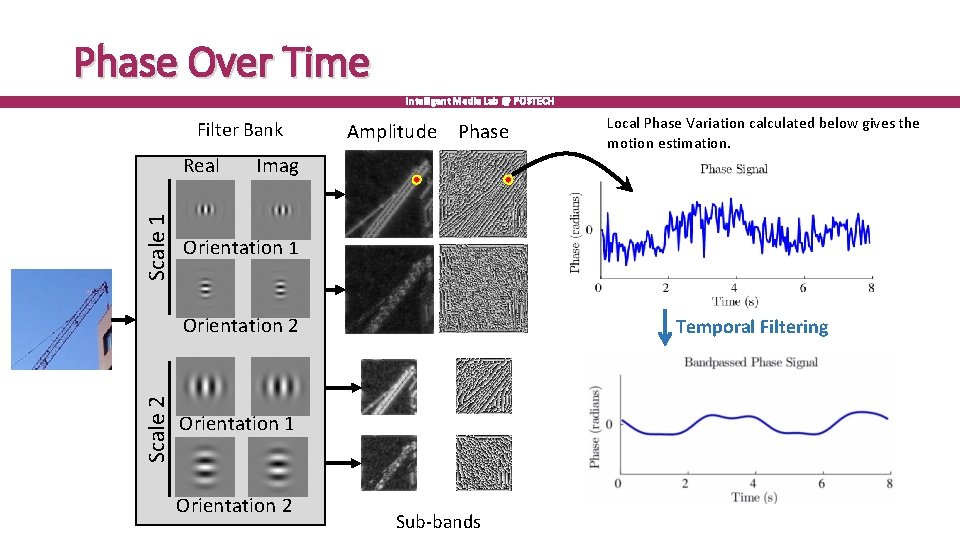
Phase Over Time Intelligent Media Lab @ POSTECH Filter Bank Scale 1 Real Amplitude Phase Imag Orientation 1 Orientation 2 Scale 2 Local Phase Variation calculated below gives the motion estimation. Temporal Filtering Orientation 1 Orientation 2 Sub-bands
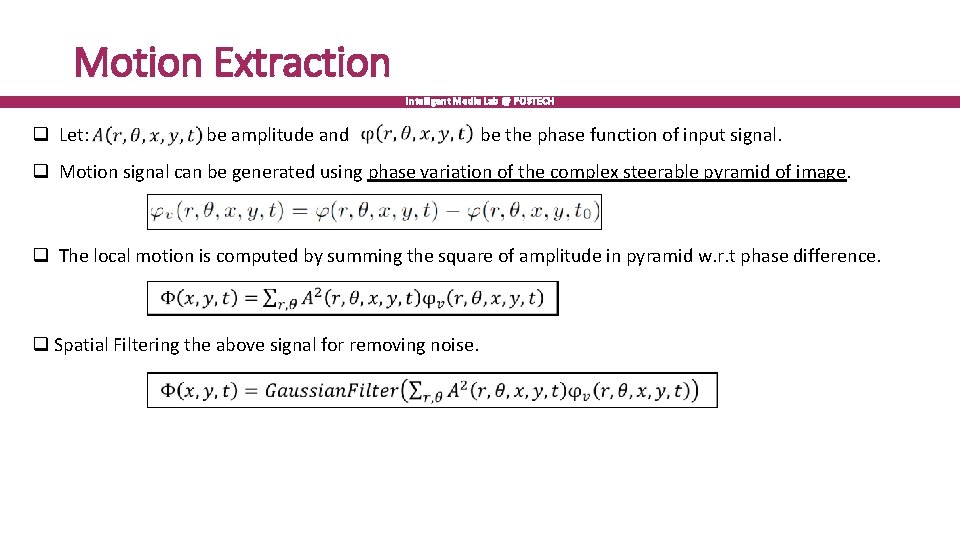
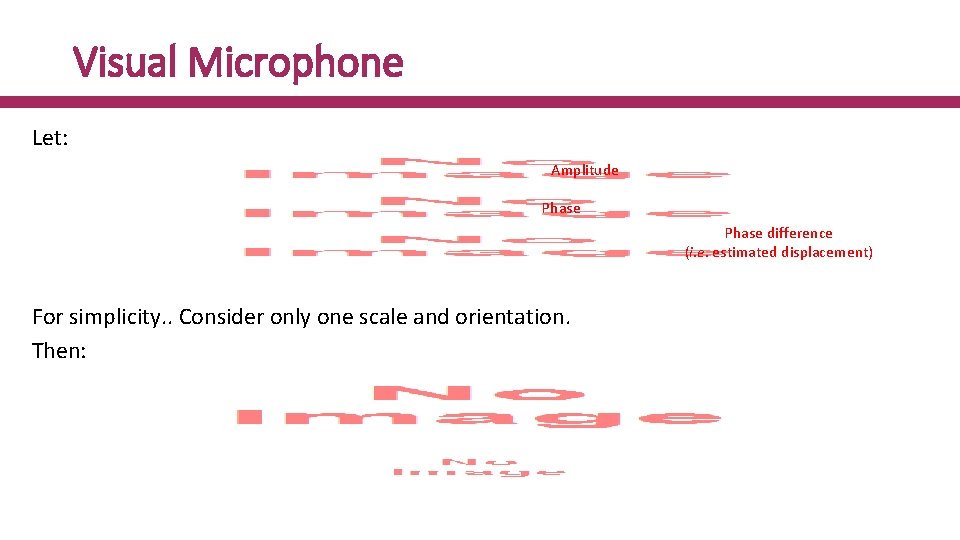
Motion Extraction Intelligent Media Lab @ POSTECH q Let: be amplitude and be the phase function of input signal. q Motion signal can be generated using phase variation of the complex steerable pyramid of image. q The local motion is computed by summing the square of amplitude in pyramid w. r. t phase difference. q Spatial Filtering the above signal for removing noise.
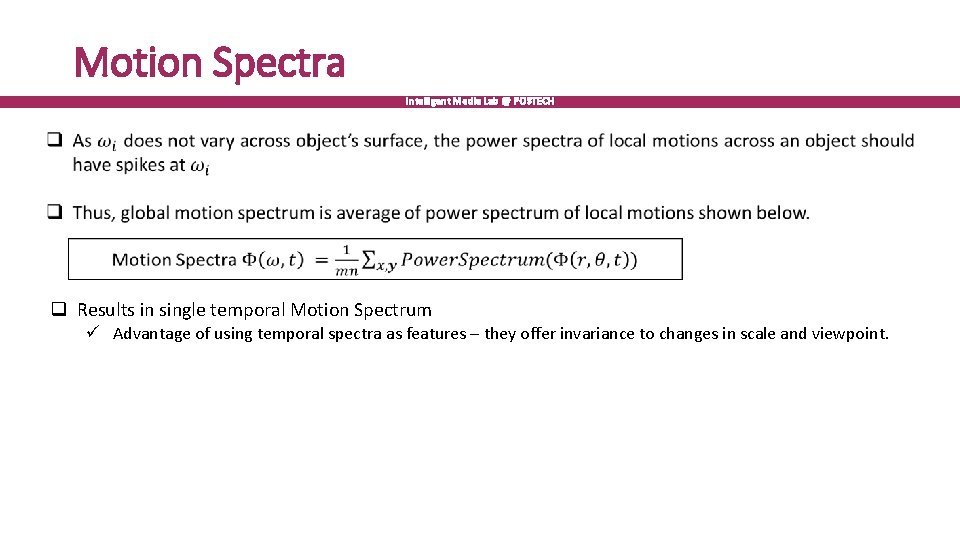
Motion Spectra Intelligent Media Lab @ POSTECH q Results in single temporal Motion Spectrum ü Advantage of using temporal spectra as features – they offer invariance to changes in scale and viewpoint.
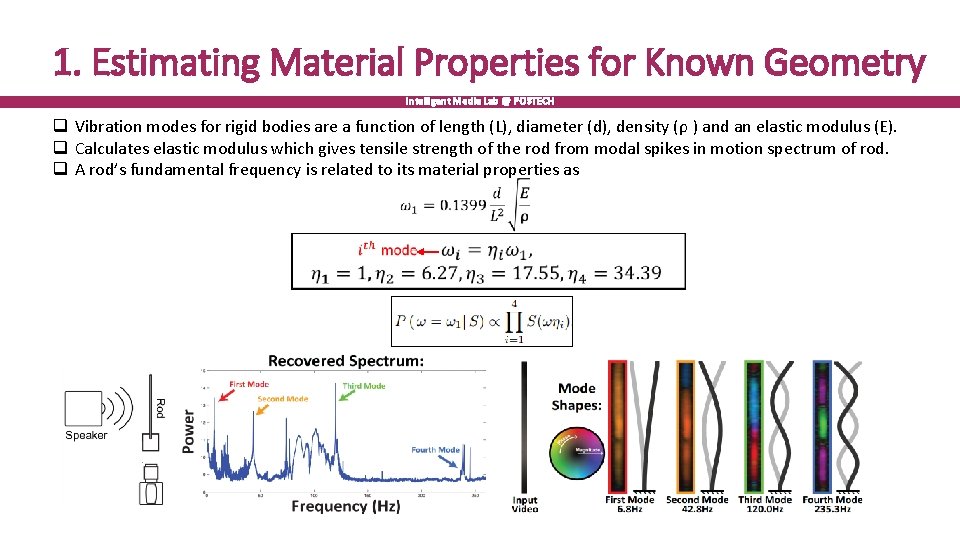
1. Estimating Material Properties for Known Geometry Intelligent Media Lab @ POSTECH q Vibration modes for rigid bodies are a function of length (L), diameter (d), density (ρ ) and an elastic modulus (E). q Calculates elastic modulus which gives tensile strength of the rod from modal spikes in motion spectrum of rod. q A rod’s fundamental frequency is related to its material properties as
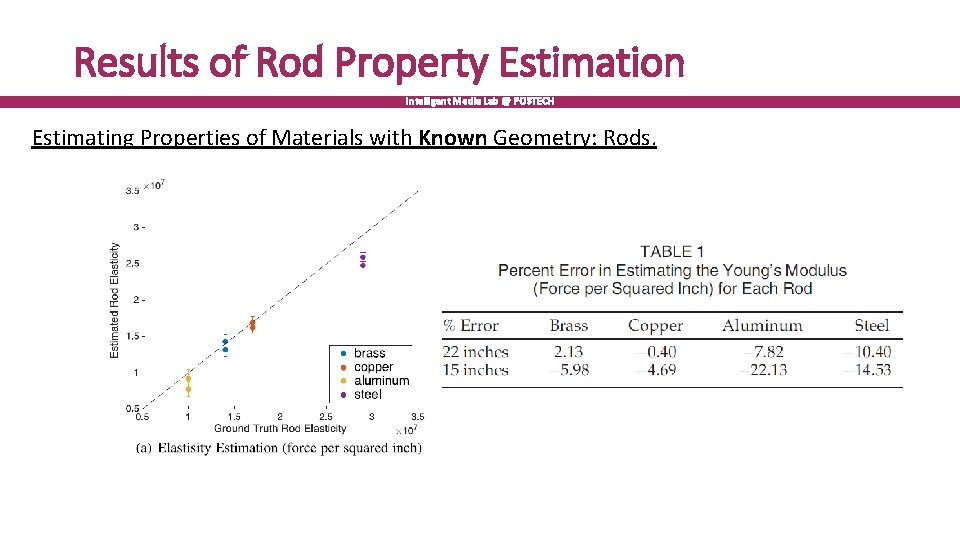
Results of Rod Property Estimation Intelligent Media Lab @ POSTECH Estimating Properties of Materials with Known Geometry: Rods.
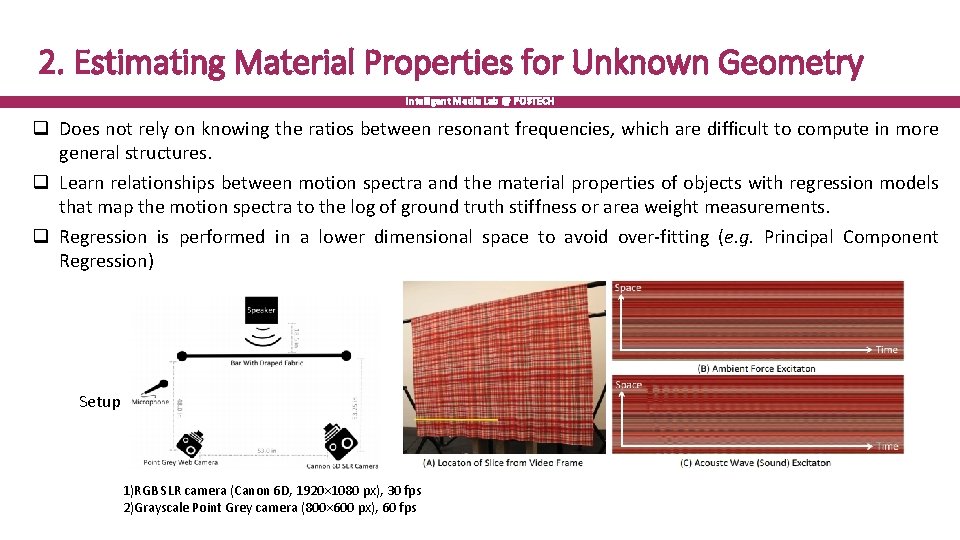
2. Estimating Material Properties for Unknown Geometry Intelligent Media Lab @ POSTECH q Does not rely on knowing the ratios between resonant frequencies, which are difficult to compute in more general structures. q Learn relationships between motion spectra and the material properties of objects with regression models that map the motion spectra to the log of ground truth stiffness or area weight measurements. q Regression is performed in a lower dimensional space to avoid over-fitting (e. g. Principal Component Regression) Setup 1)RGB SLR camera (Canon 6 D, 1920× 1080 px), 30 fps 2)Grayscale Point Grey camera (800× 600 px), 60 fps
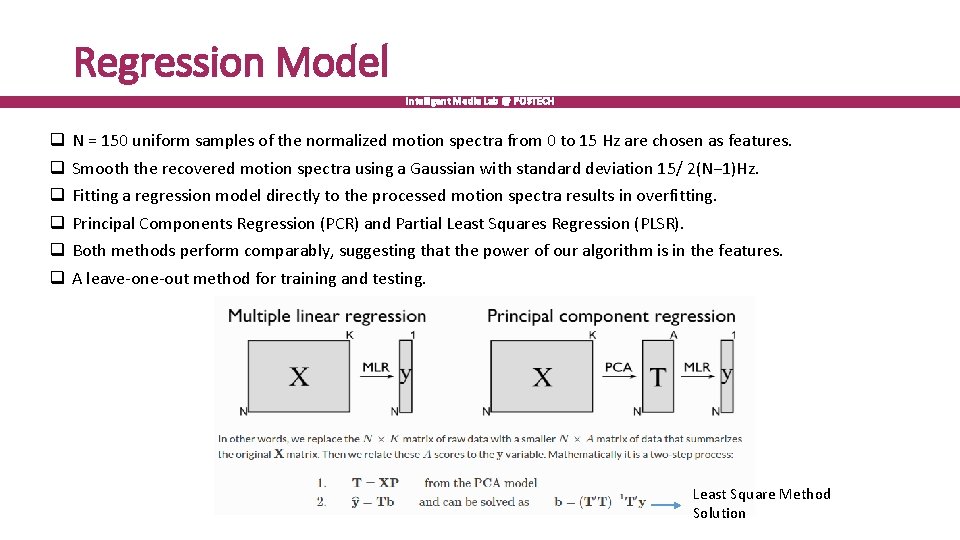
Regression Model Intelligent Media Lab @ POSTECH q q q N = 150 uniform samples of the normalized motion spectra from 0 to 15 Hz are chosen as features. Smooth the recovered motion spectra using a Gaussian with standard deviation 15/ 2(N− 1)Hz. Fitting a regression model directly to the processed motion spectra results in overfitting. Principal Components Regression (PCR) and Partial Least Squares Regression (PLSR). Both methods perform comparably, suggesting that the power of our algorithm is in the features. A leave-one-out method for training and testing. Least Square Method Solution
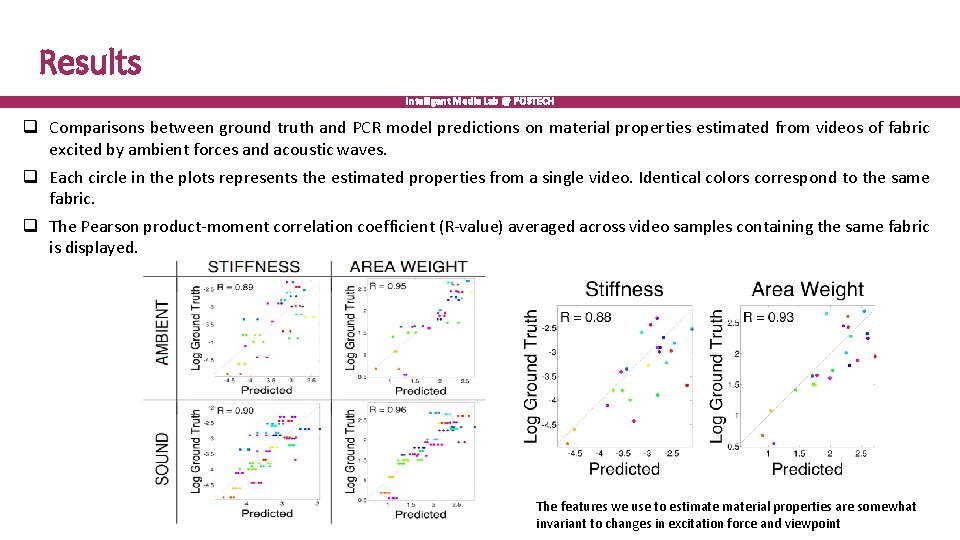
Results Intelligent Media Lab @ POSTECH q Comparisons between ground truth and PCR model predictions on material properties estimated from videos of fabric excited by ambient forces and acoustic waves. q Each circle in the plots represents the estimated properties from a single video. Identical colors correspond to the same fabric. q The Pearson product-moment correlation coefficient (R-value) averaged across video samples containing the same fabric is displayed. The features we use to estimaterial properties are somewhat invariant to changes in excitation force and viewpoint
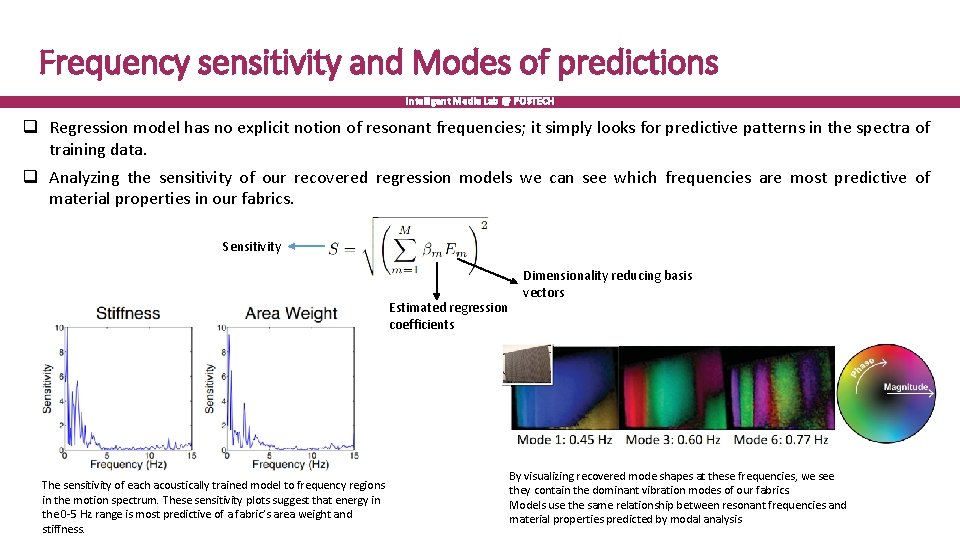
Frequency sensitivity and Modes of predictions Intelligent Media Lab @ POSTECH q Regression model has no explicit notion of resonant frequencies; it simply looks for predictive patterns in the spectra of training data. q Analyzing the sensitivity of our recovered regression models we can see which frequencies are most predictive of material properties in our fabrics. Sensitivity Estimated regression coefficients The sensitivity of each acoustically trained model to frequency regions in the motion spectrum. These sensitivity plots suggest that energy in the 0 -5 Hz range is most predictive of a fabric’s area weight and stiffness. Dimensionality reducing basis vectors By visualizing recovered mode shapes at these frequencies, we see they contain the dominant vibration modes of our fabrics. Models use the same relationship between resonant frequencies and material properties predicted by modal analysis
What we learnt Intelligent Media Lab @ POSTECH q The rod experiments demonstrate how the technique can be used as a low cost alternative to laser vibrometers in settings that are typical for testing manufactured parts (aircraft, automobiles). q Results on fabrics demonstrate that the relationship between motion spectra and material properties can be learned, and suggests that traditional vibration analysis may be extended to applications where geometry is unknown and only loosely controlled. q Results suggest that the motion spectra we extract from video can be powerful features for scene understanding.
PART ONE Deep Convolutional Neural Network for Visual Microphone/ Visual Vibrometry Credits: Juhyun Ahn, Postech- Visual Microphone Deblina Bhattacharjee - Visual Vibrometry
Visual Microphone Let: Amplitude Phase difference (i. e. estimated displacement) For simplicity. . Consider only one scale and orientation. Then:
Patch-based Visual Microphone
Patch-based Visual Microphone Similar to object classification? Cat! (translation invariant)
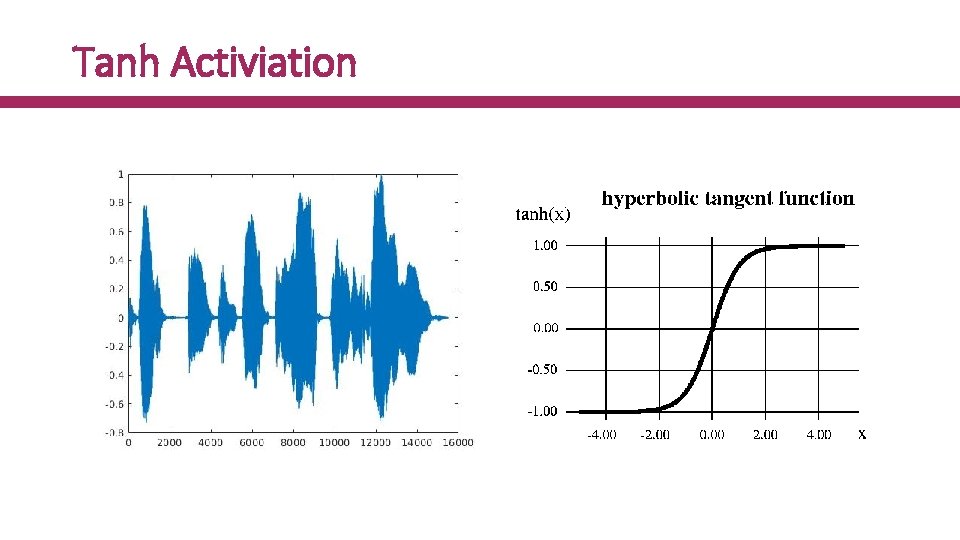
Tanh Activiation
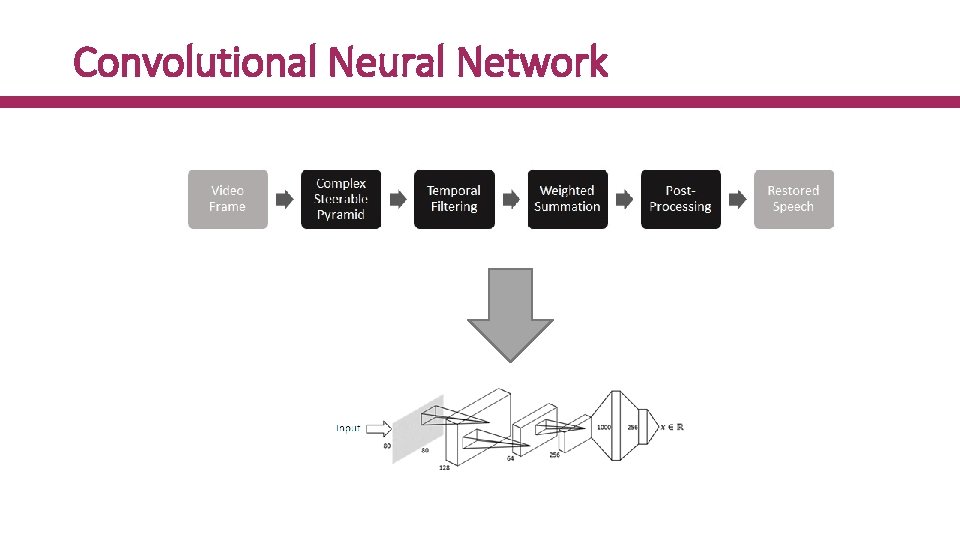
Convolutional Neural Network
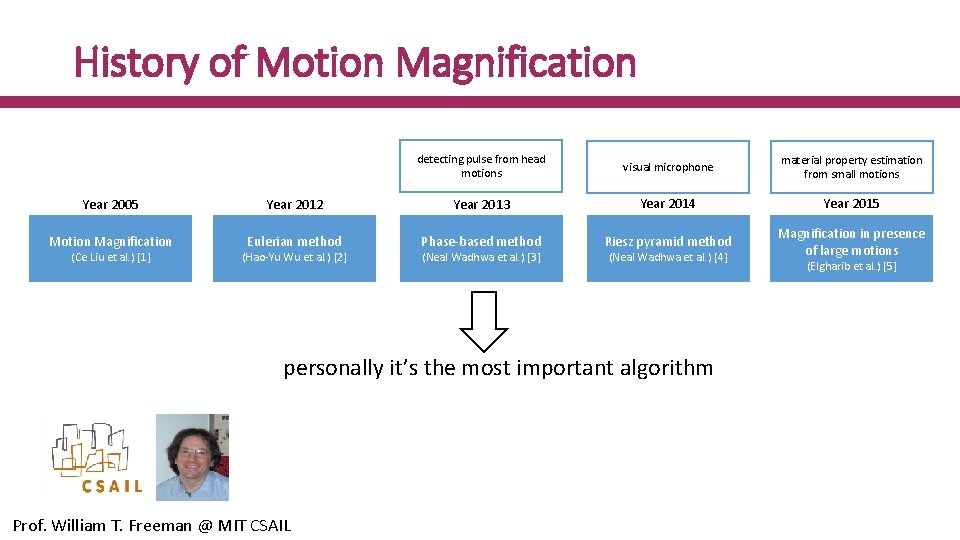
History of Motion Magnification detecting pulse from head motions visual microphone material property estimation from small motions Year 2005 Year 2012 Year 2013 Year 2014 Year 2015 Motion Magnification Eulerian method Phase-based method Riesz pyramid method Magnification in presence of large motions (Ce Liu et al. ) [1] (Hao-Yu Wu et al. ) [2] (Neal Wadhwa et al. ) [3] (Neal Wadhwa et al. ) [4] personally it’s the most important algorithm Prof. William T. Freeman @ MIT CSAIL (Elgharib et al. ) [5]
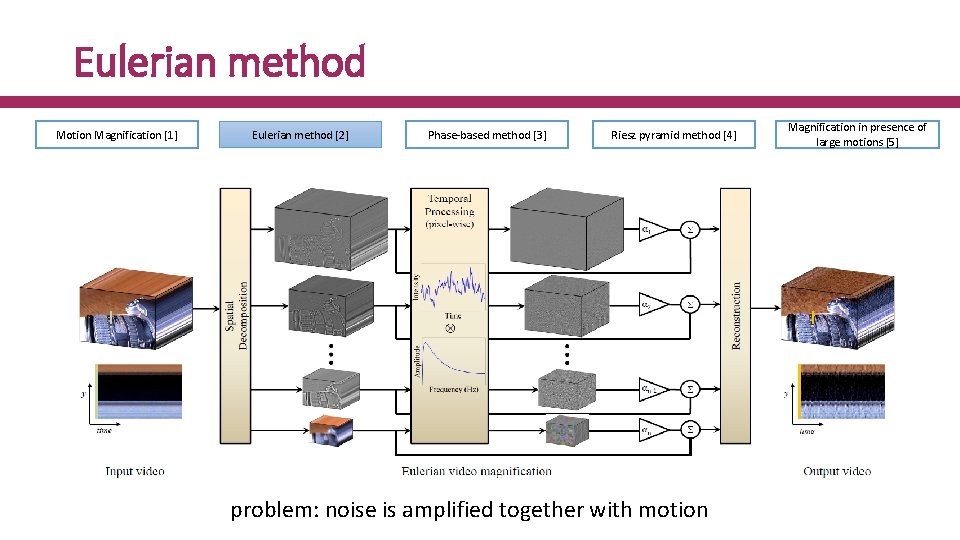
Eulerian method Motion Magnification [1] Eulerian method [2] Phase-based method [3] Riesz pyramid method [4] problem: noise is amplified together with motion Magnification in presence of large motions [5]
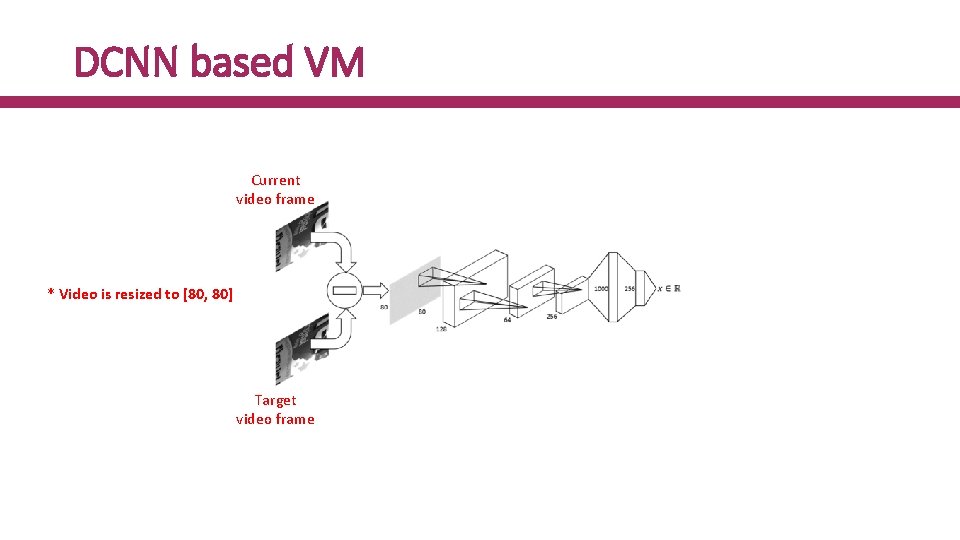
DCNN based VM Current video frame * Video is resized to [80, 80] Target video frame
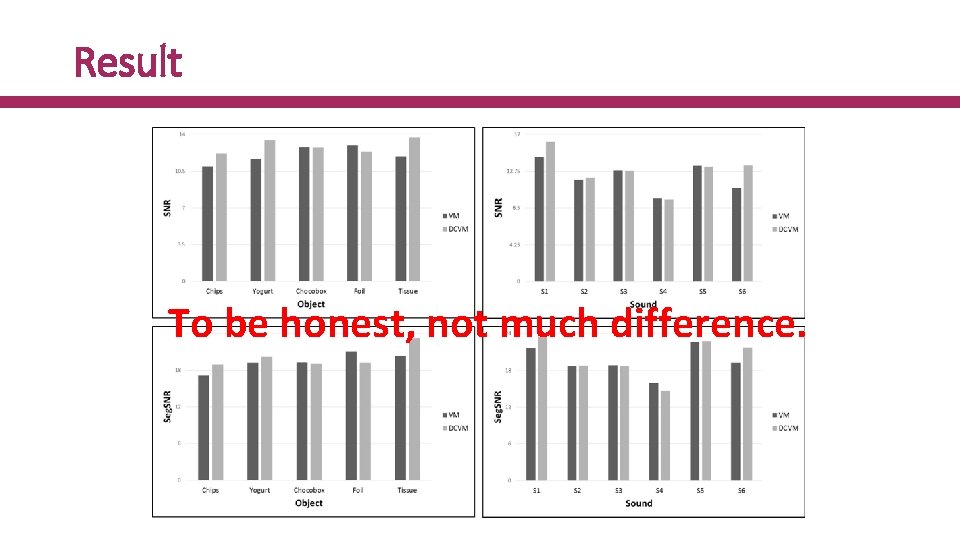
Result To be honest, not much difference.
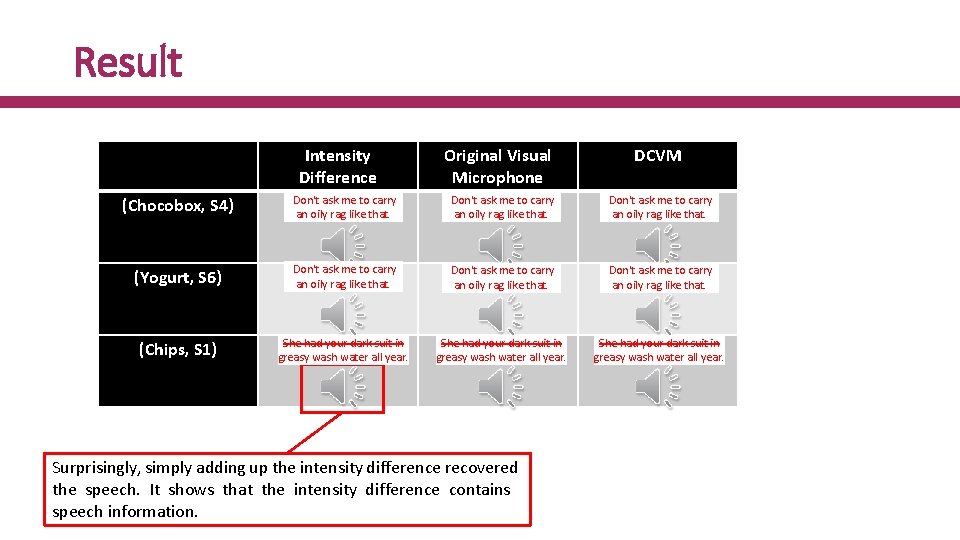
Result Intensity Difference Original Visual Microphone DCVM (Chocobox, S 4) Don't ask me to carry an oily rag like that. (Yogurt, S 6) Don't ask me to carry an oily rag like that. (Chips, S 1) She had your dark suit in greasy wash water all year. Surprisingly, simply adding up the intensity difference recovered the speech. It shows that the intensity difference contains speech information.
Problem It fails to recover the sound after around 2, 000 iterations. Why?
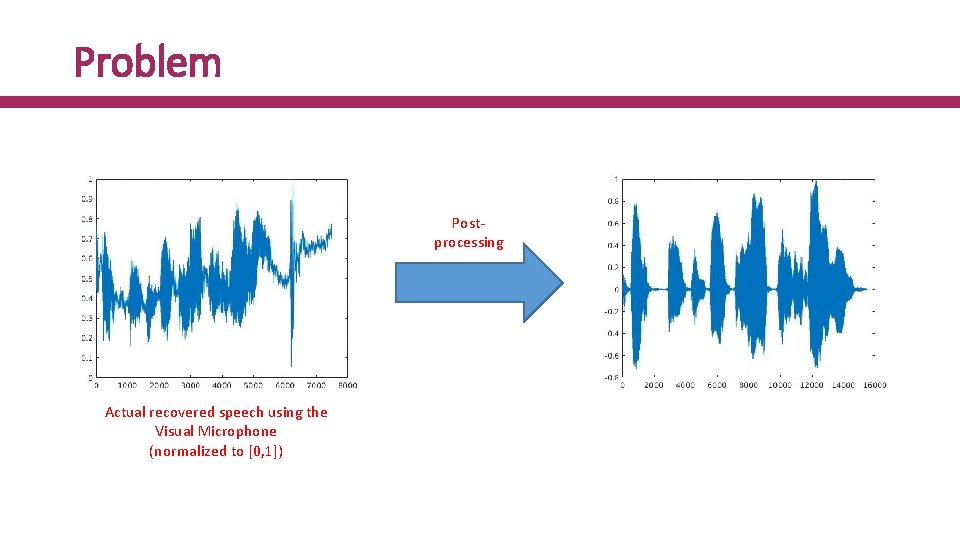
Problem Postprocessing Actual recovered speech using the Visual Microphone (normalized to [0, 1])
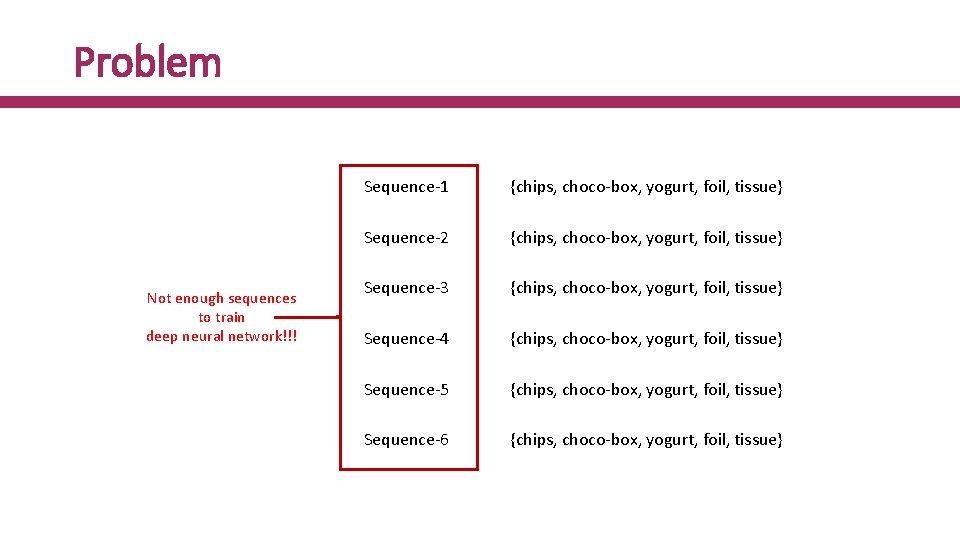
Problem Not enough sequences to train deep neural network!!! Sequence-1 {chips, choco-box, yogurt, foil, tissue} Sequence-2 {chips, choco-box, yogurt, foil, tissue} Sequence-3 {chips, choco-box, yogurt, foil, tissue} Sequence-4 {chips, choco-box, yogurt, foil, tissue} Sequence-5 {chips, choco-box, yogurt, foil, tissue} Sequence-6 {chips, choco-box, yogurt, foil, tissue}
PART TWO Improving Quality of Visual Microphone using Unsupervised Deep Bi-directional LSTM Network.
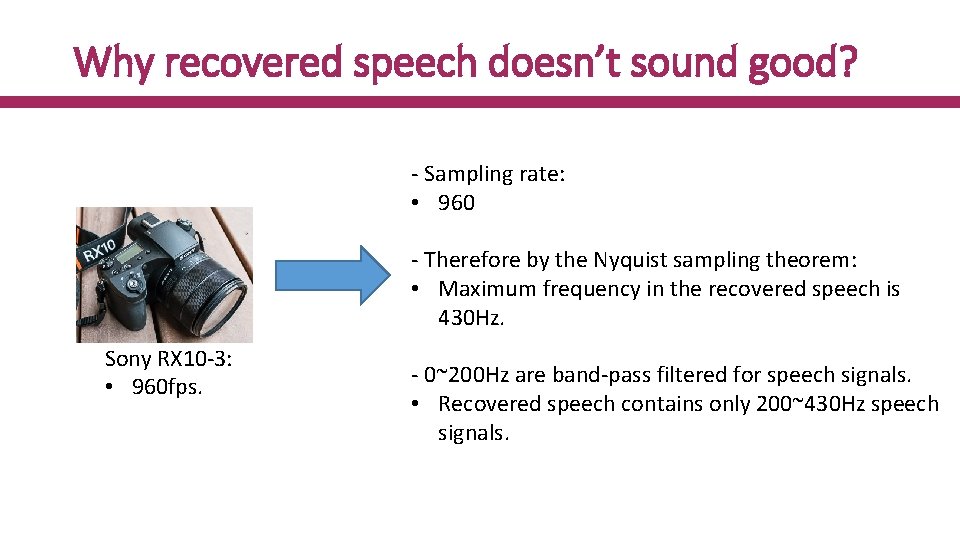
Why recovered speech doesn’t sound good? - Sampling rate: • 960 - Therefore by the Nyquist sampling theorem: • Maximum frequency in the recovered speech is 430 Hz. Sony RX 10 -3: • 960 fps. - 0~200 Hz are band-pass filtered for speech signals. • Recovered speech contains only 200~430 Hz speech signals.
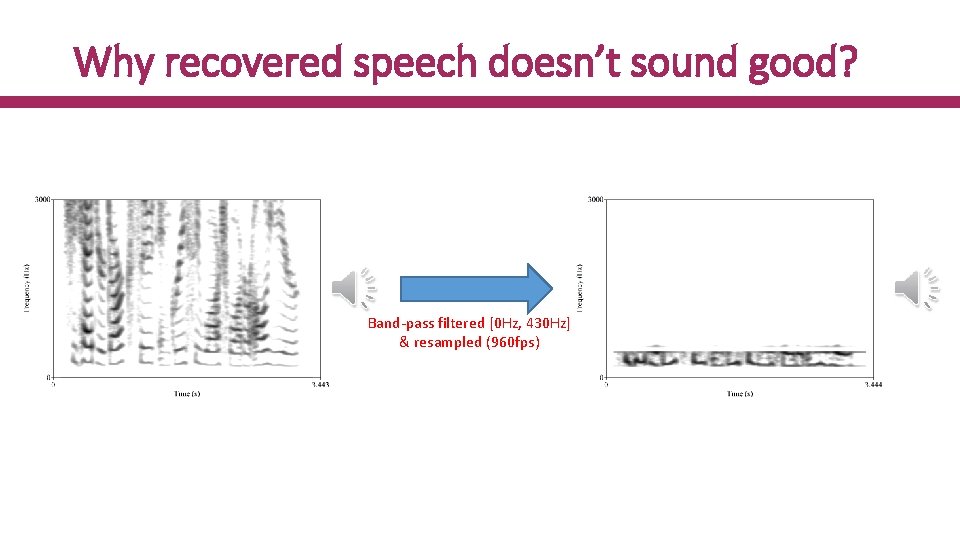
Why recovered speech doesn’t sound good? Band-pass filtered [0 Hz, 430 Hz] & resampled (960 fps)
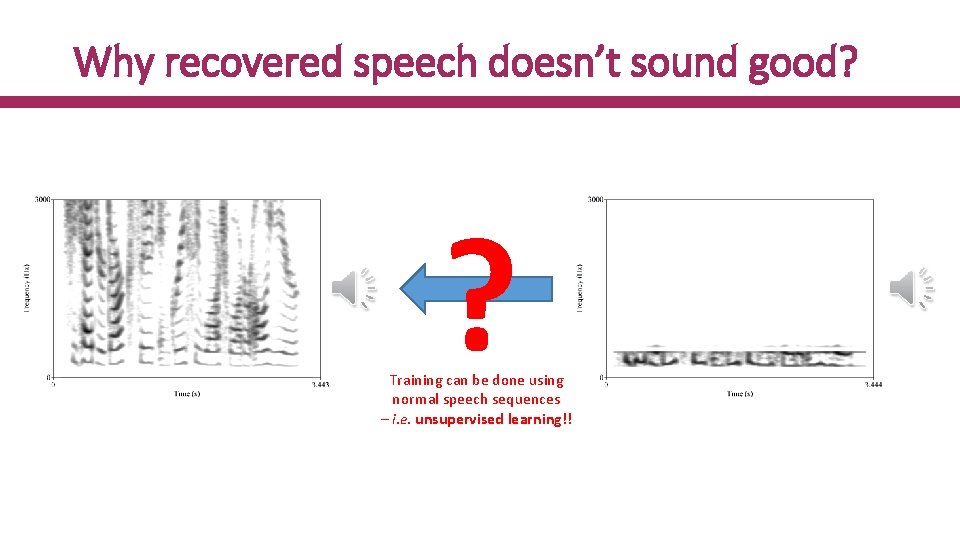
Why recovered speech doesn’t sound good? ? Training can be done using normal speech sequences – i. e. unsupervised learning!!
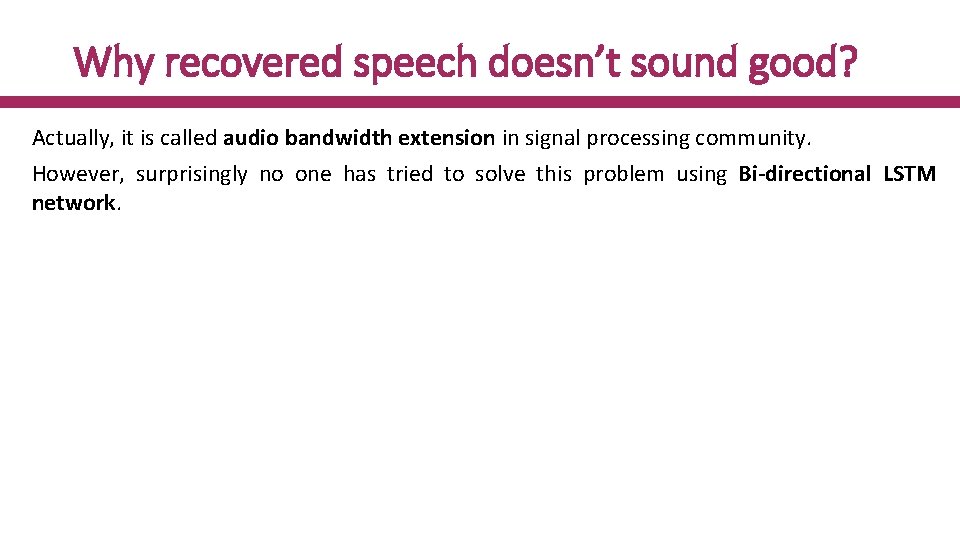
Why recovered speech doesn’t sound good? Actually, it is called audio bandwidth extension in signal processing community. However, surprisingly no one has tried to solve this problem using Bi-directional LSTM network.
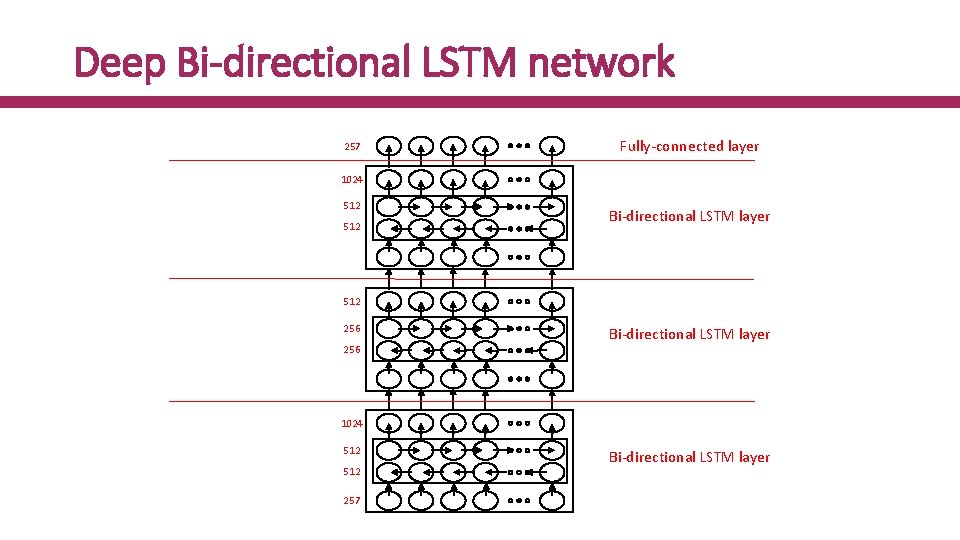
Deep Bi-directional LSTM network 257 Fully-connected layer 1024 512 Bi-directional LSTM layer 512 256 Bi-directional LSTM layer 1024 512 257 Bi-directional LSTM layer

TIMIT dataset 630 speakers * 10 speech files = 6, 300. Training data: (630 -3) * 10 speech files = 6, 270 files.
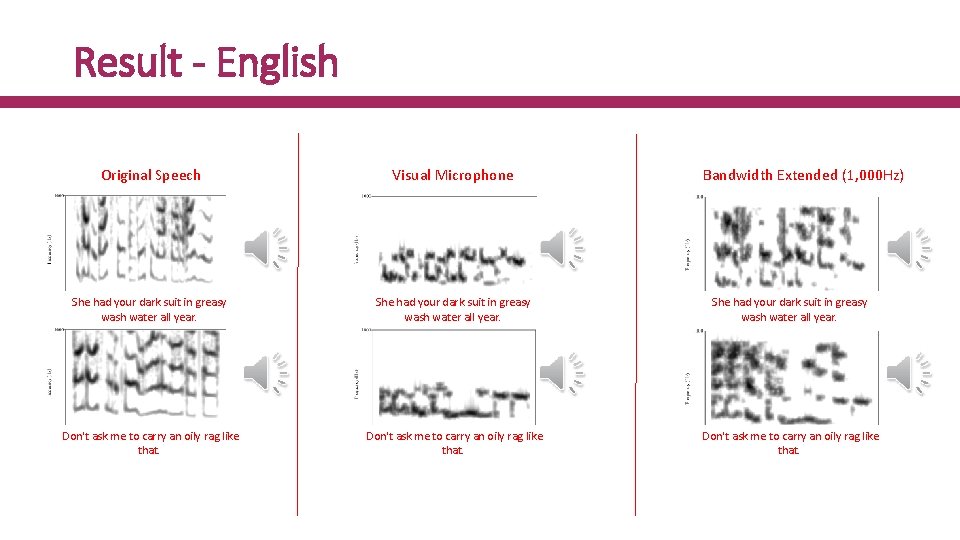
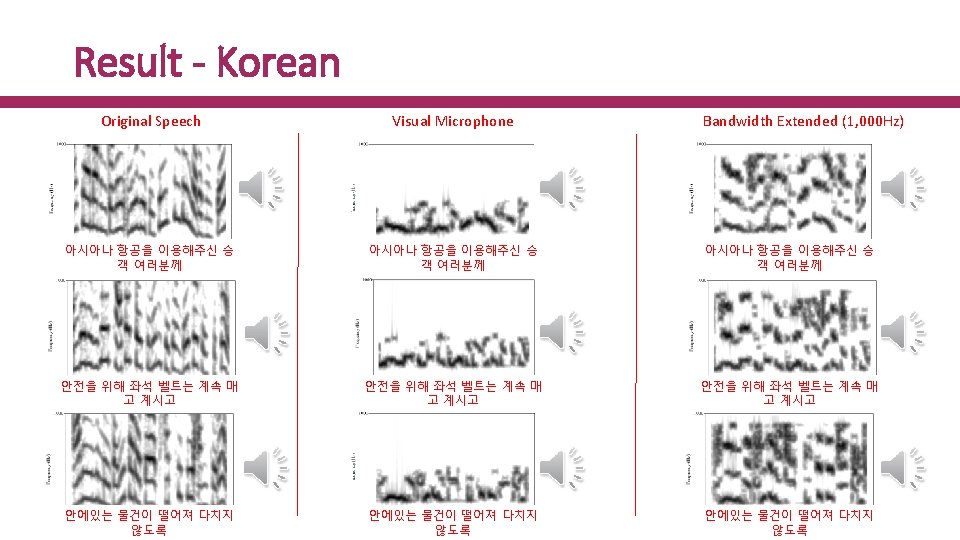
Result - English Original Speech Visual Microphone Bandwidth Extended (1, 000 Hz) She had your dark suit in greasy wash water all year. Don't ask me to carry an oily rag like that.
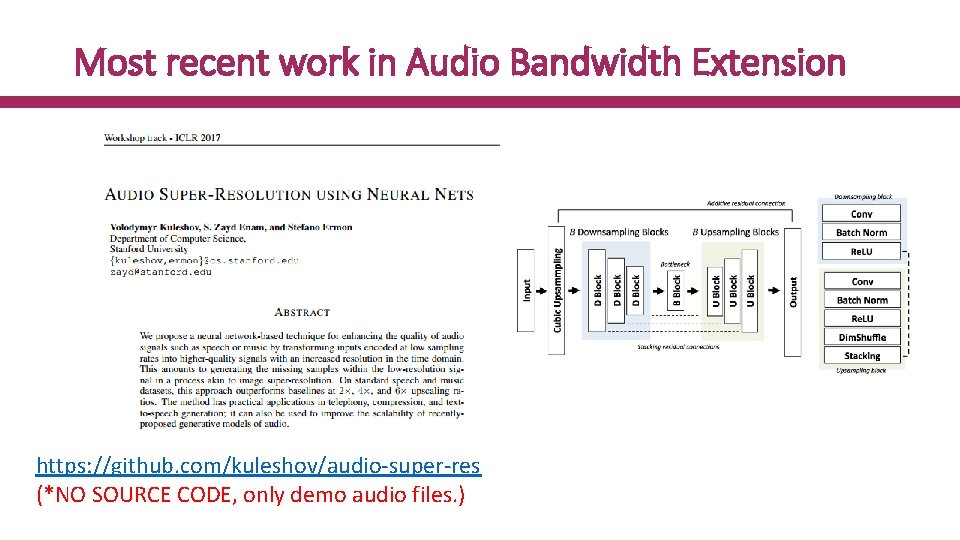
Most recent work in Audio Bandwidth Extension https: //github. com/kuleshov/audio-super-res (*NO SOURCE CODE, only demo audio files. )
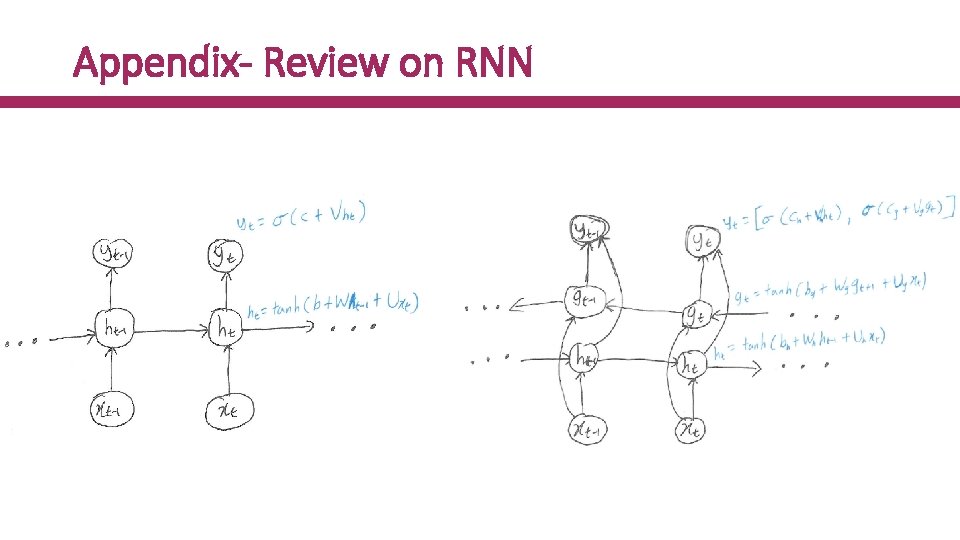
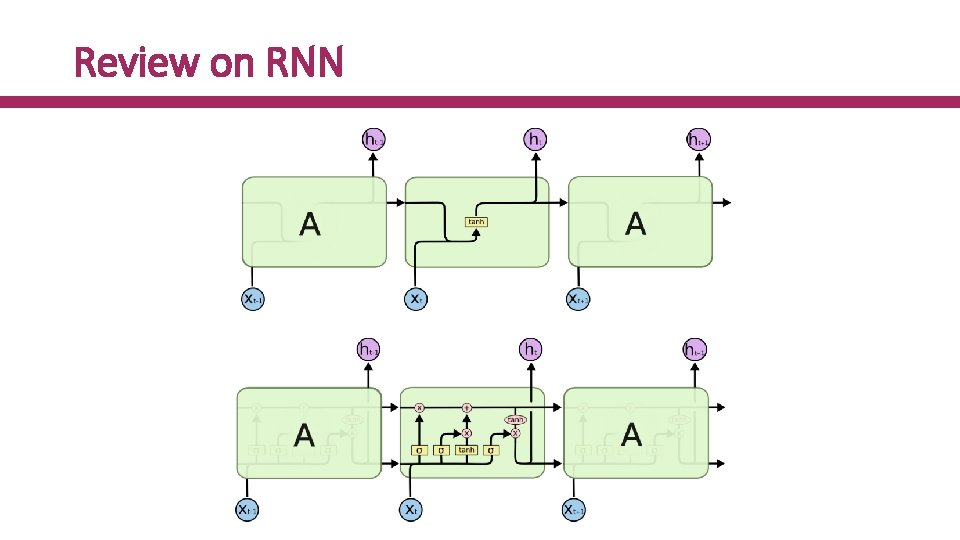
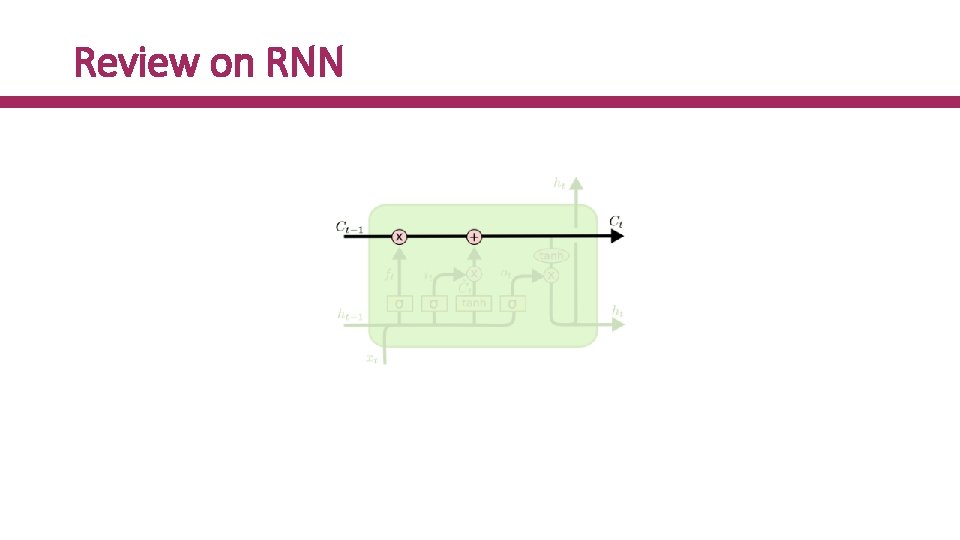
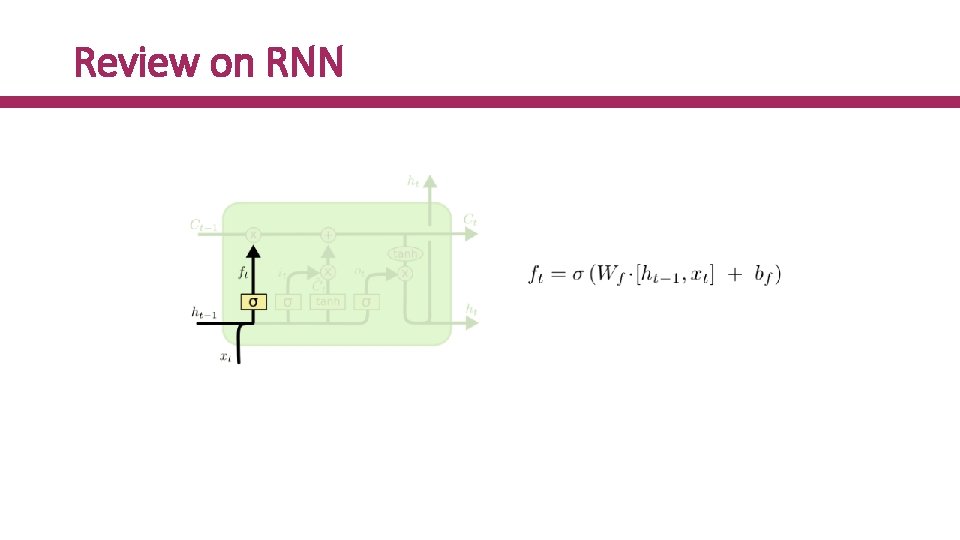
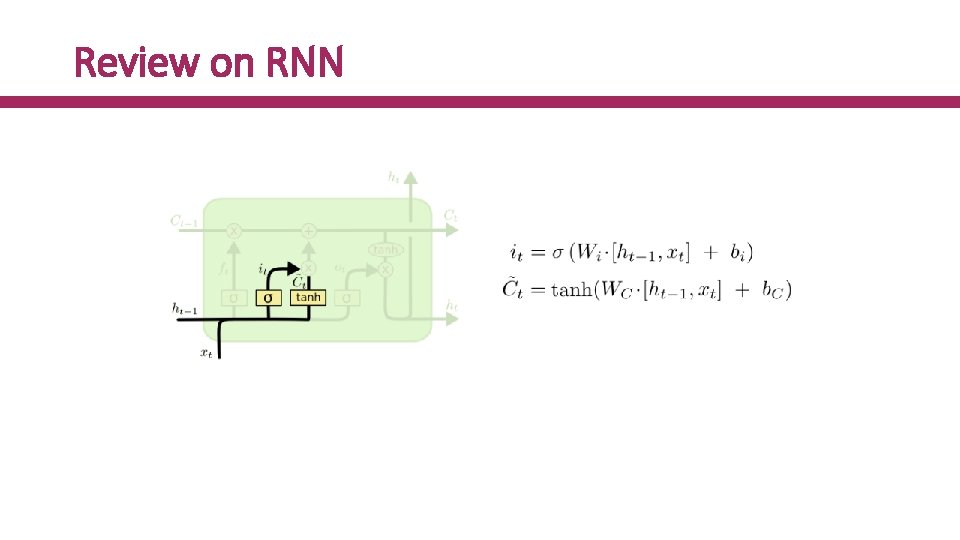
Appendix- Review on RNN
Review on RNN
Review on RNN
Review on RNN
Review on RNN
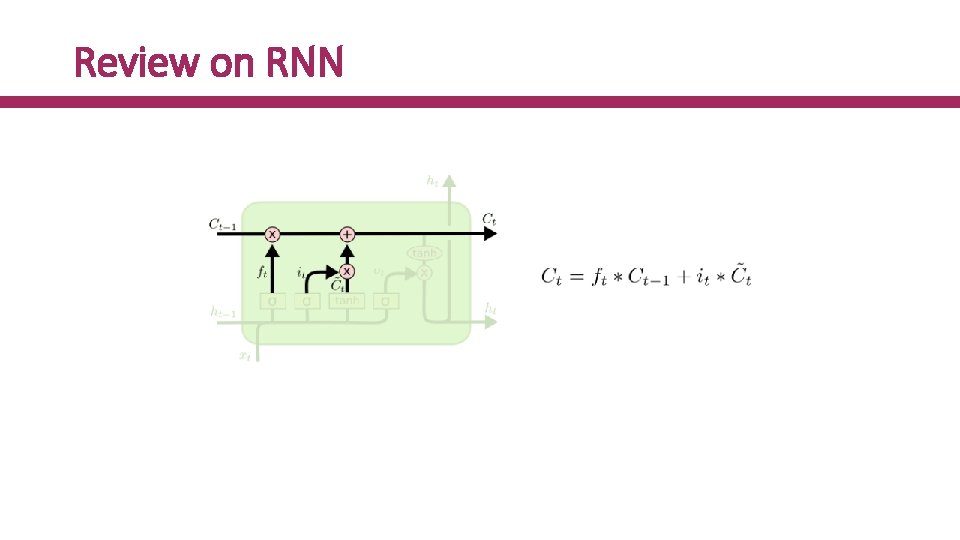
Review on RNN
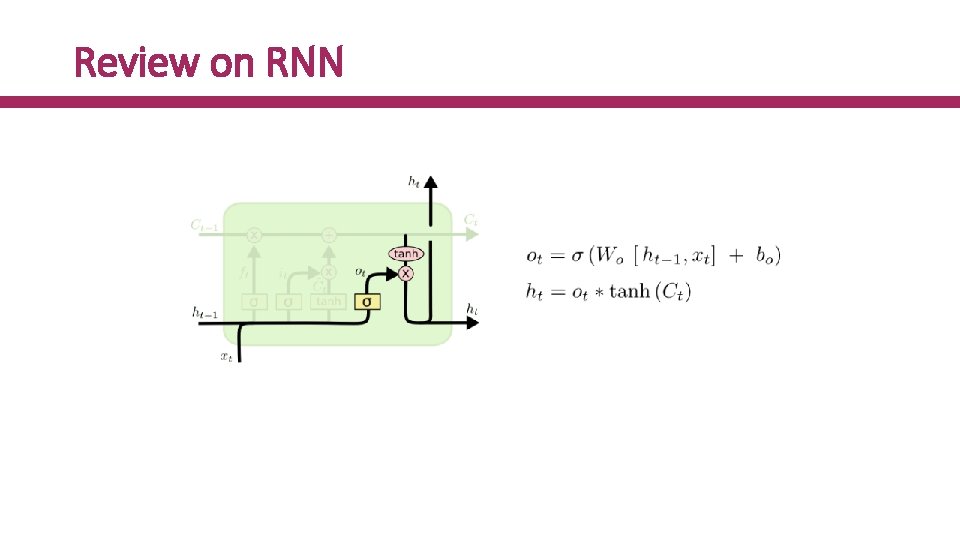
Review on RNN
- Slides: 51