Visual Studio 2010 C HanChern Ling Oops Syntax


 – When compiler can not recognize a statement n")
 The Visual Studio provides a debugger tool to help")


- Slides: 17
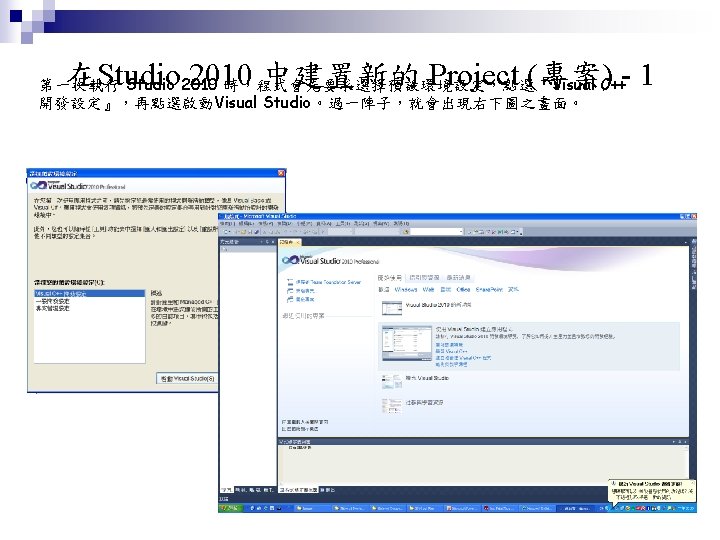
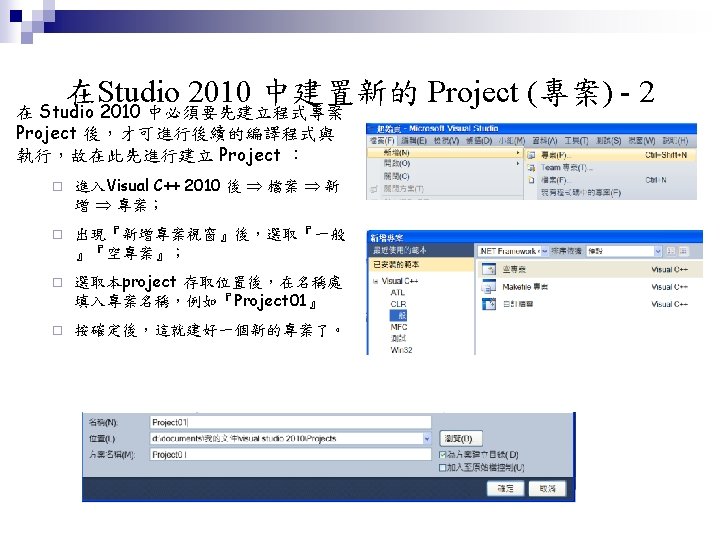
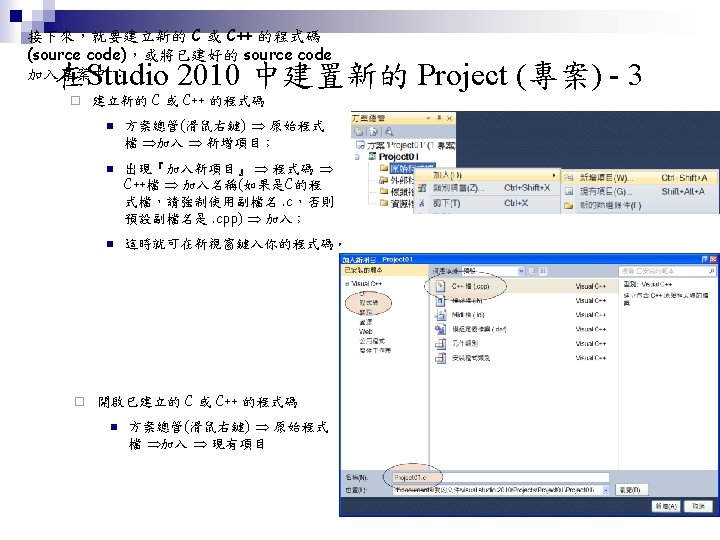
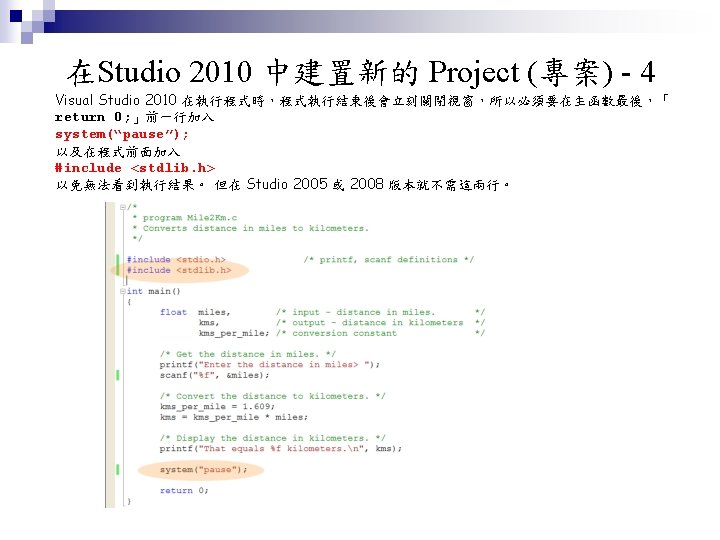
簡易 Visual Studio 2010 C++ 使用手冊 Han-Chern Ling
Oops! 錯誤產生時,該怎麼辦? Syntax Errors (語法錯誤) – When compiler can not recognize a statement n n If an error message appears in the Output pane’s Build tab, double-clicking anywhere on the error message displays the source file and places a blue arrow marker in the margin indicator bar (i. e. , the gray strip to the left of the source code), indicating the offending line. If you do not understand the error message, highlight the error message number by dragging the mouse over the number, then press the F 1 key. This displays a help file that provides information about the error and some helpful hints as to the cause of the error.
Debugging Run-Time Logic Errors (語意錯誤) The Visual Studio provides a debugger tool to help the programmer find run-time logic errors in programs that compile and link successfully but do not produce expected results. The debugger lets the programmer view the executing program and its data as the program runs either one step at a time or at full speed. The program stops on a selected line of code or upon a fatal run-time error. ¨ To use the debugger, set one or more breakpoints by clicking the line in the program where the breakpoint is to be placed and clicking the Insert/Remove Breakpoint button in the Build Mini. Bar or by pressing the F 9 key. ¨
Debugging Run-Time Logic Errors ¨ The Visual Studio provides a debugger tool to help the programmer find run-time logic errors in programs that compile and link successfully but do not produce expected results. The debugger lets the programmer view the executing program and its data as the program runs either one step at a time or at full speed. The program stops on a selected line of code or upon a fatal run-time error. ¨ To use the debugger, set one or more breakpoints by clicking the line in the program where the breakpoint is to be placed and clicking the Insert/Remove Breakpoint button in the Build Mini. Bar or by pressing the F 9 key.
Debugging You may need to manually switch between the IDE and the console window to perform input. To switch between windows you can use Alt + Tab or click your program’s panel on the Windows taskbar at the bottom of the screen. The yellow arrow to the left of a statement indicates that execution is suspended at this line. This statement will be the next statement executed.