Visual Perception and Cognition Roadmap Visual Perception how


")


 • Splits into subsystems for object recognition and")


……")


 • HSB (HVS) model (based on")


 • Color sequences for")


 Can you order these (low->hi)")


. • Studies use of")


 • Color deficient viewers? ▫ Don’t depend on red-green differentiation ▫")


 ▫ Describe")
- Slides: 110
Visual Perception and Cognition
Roadmap • Visual Perception: how it works • Fun with Visual Perception: Party Tricks and other Amusements • Impact on Visualization: What do we know about visual perception that can inform our visualization practice? ▫ Effects due to visual mechanism that we can use to our advantage ▫ General Guidelines to follow (Bertin, XXX, ) ▫ Design Examples
Visual Perception • What is visual perception? ▫ The process of knowing or being aware of information through the eyes. ▫ The process of acquiring, interpreting, selecting, and organizing sensory information.
Related Disciplines • Psychophysics: Applying methods of physics to measuring human perceptual systems. ▫ How fast must light flicker until we perceive it as constant? ▫ What change in brightness can we perceive? • Cognitive psychology: Understanding how people think. In this context, how it relates to perception.
Visual System Slide adapted from Stone & Zellweger • Light path ▫ Cornea, pupil, lens, retina ▫ Optic nerve, brain • Retinal cells ▫ Rods and cones ▫ Unevenly distributed • Cones ▫ Three “color receptors” ▫ Concentrated in fovea • Rods ▫ Low-light receptor ▫ Peripheral vision From Gray’s Anatomy
Human Perception of Color
Color Model (CIELUV)
Steven’s Power Laws p < 1 : underestimate p > 1 : overestimate Stevens, On the Theory of Scales of Measurement, Science 103: 2684, 1946
Pictures vs. Eyes • Pictures ▫ Generally produced by purpose built cameras, or computer applications, or drawings. ▫ For instance a camera has good optics, focus, white balance exposure controls. It captures a large image at constant high quality resolution (spatial, luminance, hue). • Eyes ▫ Heuristics developed by evolution using inexpensive biophysical hardware to keep operator alive. ▫ Human visual system is different in that it has relatively poor optics. It is constantly scanning, adjusting focus, white balance, exposure. It captures detail only in foveal area and very coarsely in the peripheral vision areas. We produce a 3 D spatial reconstruction of our world based on our 2 D snapshots.
One Simple Model of Perceptual Processing • Three stage process ▫ Parallel extraction of low-level properties of scene ▫ Pattern perception ▫ Sequential goal-directed processing Stage 1 Early, parallel detection of color, texture, shape, spatial attributes Stage 2 Dividing visual field into regions and simple patterns Stage 3 Holding objects in working memory by demands of active attention
Stage 1 - Low-level, Parallel • Neurons in eye & brain responsible for different kinds of information (orientation, color, texture, movement, etc. ) • Arrays of neurons work in parallel • Occurs “automatically” • Rapid • Information is transitory, briefly held in iconic store • Bottom-up data-driven model of processing • Often called “pre-attentive” processing
Pattern Perception • Slow serial processing • Involves working and long-term memory • A combination of bottom-up feature processing and top-down attentional mechanisms • Different visual systems for object recognition and visually guided motion
Stage 3 – Sequential Goal-Directed (Attentive) • Splits into subsystems for object recognition and for interacting with environment • Increasing evidence supports independence of systems for symbolic object manipulation and for locomotion & action • First subsystem then interfaces to verbal linguistic portion of brain, second interfaces to motor systems that control muscle movements
Stage 3 – Attributes • Top-down attention-driven model of processing • Slow serial processing • Involves working and long term memory • A few objects are constructed from the available patterns to provide answers to visual queries
Visual Working Memory • different from verbal working memory • low capacity (3 -5? ) • locations egocentric • controlled by attention • time to change attention: 100 ms • time to get gist: 100 ms • not fed automatically to long term memory
Preattentive Processing • How does human visual system analyze images? ▫ Some things seem to be done preattentively, without the need for focused attention ▫ Generally take less than 200 -250 msecs (eye movements take 200 msecs) ▫ Seems to be done in parallel by low-level vision system ▫ An important contribution vision science makes to data visualization is that a limited set of visual properties can be detected very rapidly and accurately by the low-level visual system http: //www. csc. ncsu. edu/faculty/healey/PP/index. html
How many 3’s Watch this space and tell me how many 3’s you see…
How many 3’s 1281768756138976546984506985604982826762 98098584582245098564589450980943585 9091030209905959595772564675050678904567 8845789809821677654876364908560912949686
How many 3’s Answer? Ready to try again?
How many 3’s 1281768756138976546984506985604982826762 98098584582245098564589450980943585 9091030209905959595772564675050678904567 8845789809821677654876364908560912949686
How many 3’s What about now? Do you have the correct answer? So, pop-outs (pre-attentive selection) helps us with this task. What else could help us with this task? Can you think of other types of tasks that pre-attentive recognition could help us with?
Fun with Visual Perception: Party Tricks and other Amusements • Our visual system because it is built from the ground up, and has evolved over millions of years, contains many “artifacts”. • These make for good party tricks • And they help inform us about ways in which we can take advantage of the vision system’s mechanics to help with visual understanding (especially quick recognition).
Stroop Effect
Stroop Effect • Read the words on the following slide as quickly as you can. Ready?
OAK WATER FLOWER BOAT HOUSE TREE STONE PEANUT HORSE RADIO FOLDER STREET FLY QUAKE STORM GRASS ZIP
Stroop Effect • OK. Let’s do it again. Read the words on the next slide as quickly as you can. Ready?
RED BLACK YELLOW GREEN RED BLACK RED YELLOW GREEN BLUE YELLOW BLACK BLUE RED GREEN YELLOW BLACK
• Did you notice a difference? • Interference from engaging higher level processing. Actually you can probably do again at similar speed if you focus just on written word (left brain) and no connotations (right brain). • A Whole New Mind: Why Right-Brainers Will Rule the Future, Daniel Pink
Examples from Healey
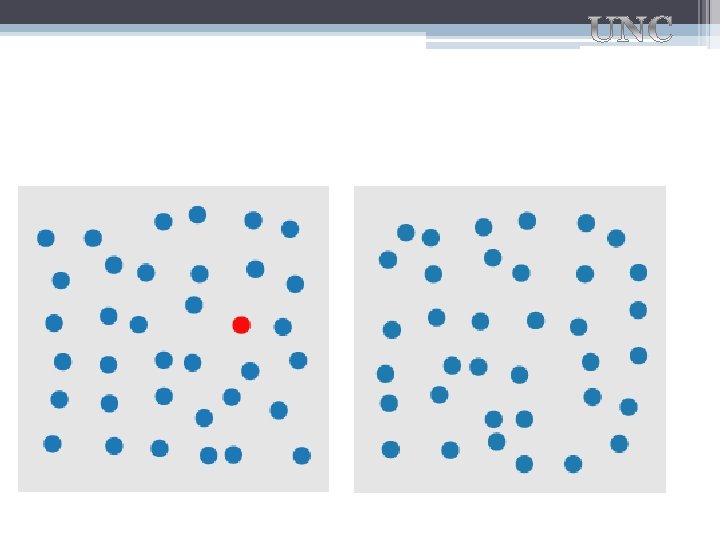
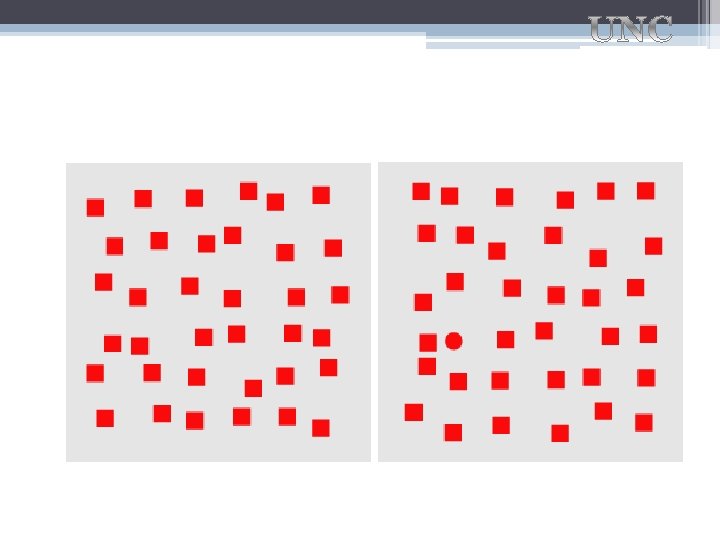
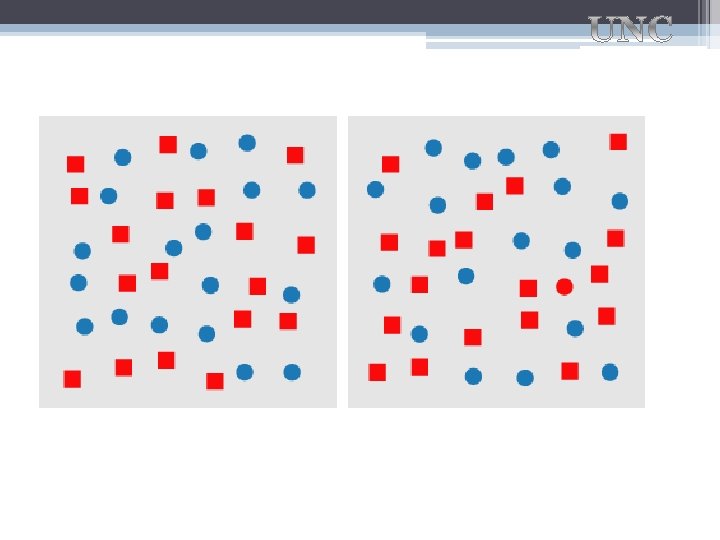
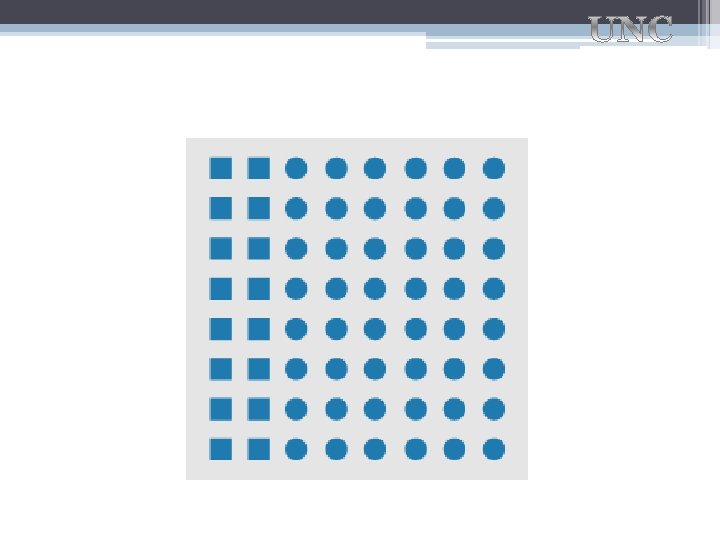
Differing Amounts of “pop-out” • Task: for the next two slides, you will see two squares. Your job is to see how quickly you can pick out the square containing the red circle.
• Ready for next one?
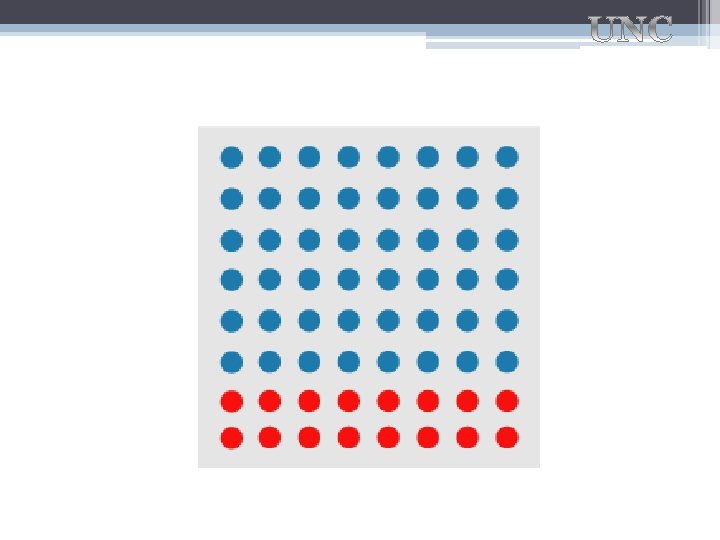
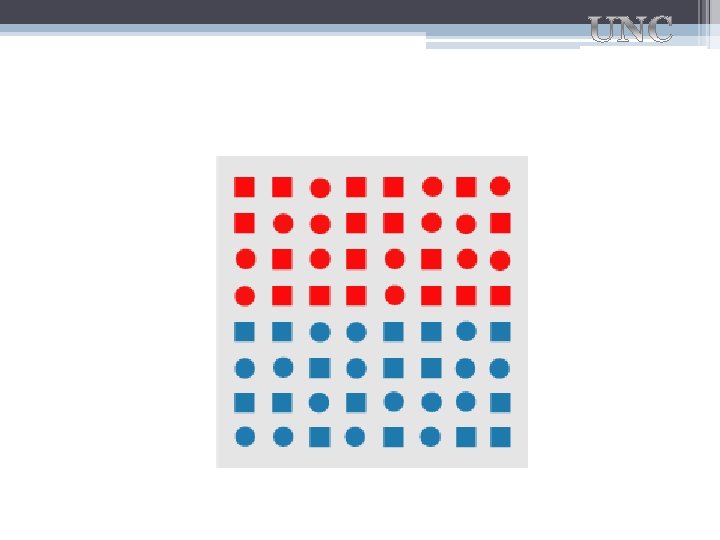
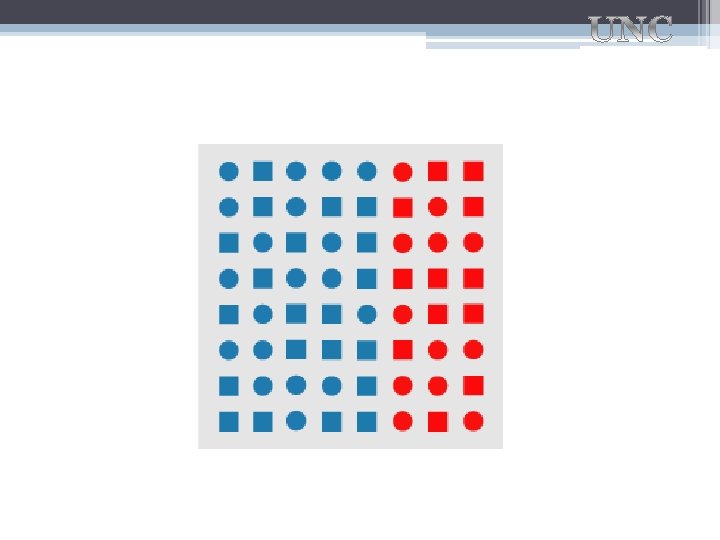
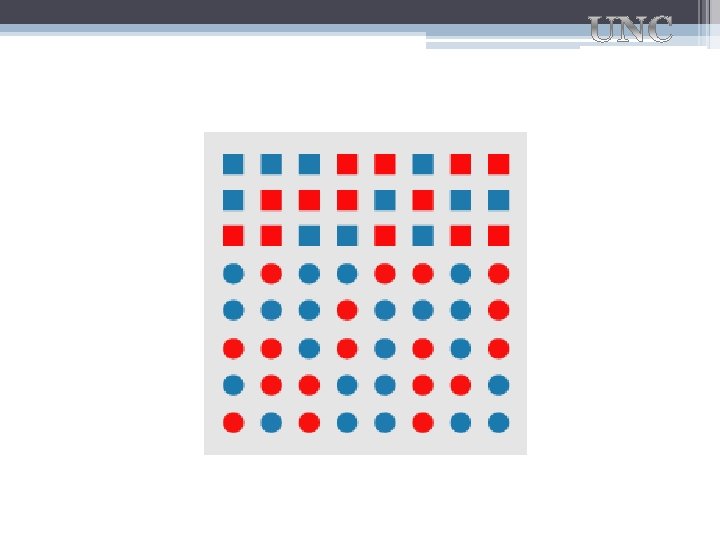
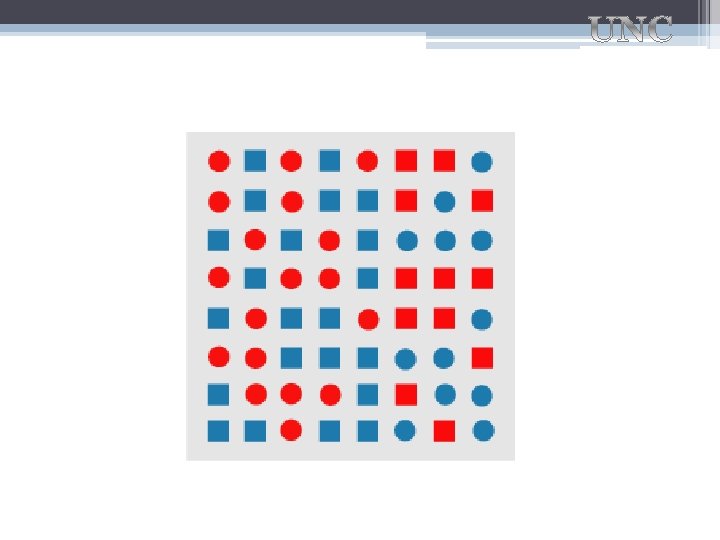
• Good Job . • For the next slides your job is to pick out the two groupings. Each square contains two groups (which have common features). The two groups can be separated by a line splitting the square into two rectangles.
What you can’t see…
Best Resource Award! • A great resource for looking at many of these visual effects AND learning about the science behind them is Christopher Healey’s (NCSU) webpage on Perception in Visualization. • Let’s take a brief look. Be sure to try the java applets.
Other Good Resources • Michael Bach website
Impact on Visualization • We knows things from carefully controlled studies (not so many of these), and • Lots of practical empirical experience
Controlled Study: Position vs Area/Angle Figure 3. Graphs from position-angle experiment.
Estimate the relative magnitude of the pair of bars marked with • W. S. Cleveland R. Mc. Gill, Graphical perception, JASA 39, pp. 521 -554, 1984
Results: Error in Judgements
Potential Preattentive Features length width size curvature number terminators intersection closure hue intensity flicker direction of motion binocular lustre stereoscopic depth 3 -D depth cues lighting direction
Examples of pre-attentive tasks • Target detection ▫ Is something there? • Boundary detection − Can the elements be grouped? • Counting − How many elements of a certain type are present?
Key Perceptual Properties • Texture • 3 D • Motion • Shape • Groupings ▫ Spatial ▫ Multiresolution (zoom) • Brightness/Luminance • Color
Texture from: Jürgen Döllner from: Colin Ware
Pre-Attentive Cues With Textures • A visual texture represents that visual sensation that allows us to pre-attentively differentiate two adjacent, possibly structured parts in our visual field without eye movement ▫ visual textures include micro-structures, patterns, profiles, etc. ▫ to identify textures, an observations of about 160 -200 ms is sufficient (cognitively controlled processes require about 300 -400 ms) • Classification of textures is based on ▫ coarseness, contrast, directionality (orientation), scale, line-likeness, regularity, roughness • Textures improve perception of position and orientation • Texture communicate information about the 3 D structure regardless of their coloring Slide adapted from Klaus Mueller/ Jürgen Döllner
Pre-Attentive Cues With Textures • Same surface with and without texture • Textures that do not include information are to be avoided in visualization ▫ recall Tufte’s aesthetic principle that irrelevant decoration (= chart junk) should be avoided • Subtle textures for 3 D visualizations, however, can be important elements of visual design Slide adapted from Klaus Mueller/ Colin Ware
Texture Perception • Textons Objects Their textons ▫ fundamental micro-structures in generic natural images ▫ -basic elements in pre-attentive visual perception • Textons can be classified into three general categories: ▫ 1. elongated blobs (line segments, rectangles, ellipses) with specific properties such as hue, orientation, and width, at different level of scales Gabor ▫ 2. terminators (end of line segments) Primitves ▫ 3. crossings of line segments • Julesz believes that only a difference in textons or in their density can be detected pre-attentively ▫ - no positional information about neighboring textons is available without focused attention ▫ - pre-attentive processing occurs in parallel (fast!) ▫ - focused attention occurs in serial (slower!) • Example: Look at two objects on right ▫ although the two objects look very different in isolation ▫ they are actually the same texton Slide adapted from Klaus Mueller/ Jürgen Döllner
Relation to Symbol and Texture Design • When designing textures to indicate different regions of a visualization, make sure that the textons are as different as possible • The same rules apply when designing symbol sets • Example: A tactical map may require the following symbols: ▫ aircraft targets ▫ tank targets ▫ building targets ▫ infantry position targets • Each of these target types can be classified as friendly or hostile • Targets exist whose presence is suspected but not confirmed (this uncertainty must be encoded) • Set of symbols designed to represent different classes of objects ▫ - symbols should be as distinct as possible with respect to their preattentive processing ▫ - recall: military reconnaissance must occur FAST! Slide adapted from Klaus Mueller/ Jürgen Döllner
Information Display in 3 D: Depth Cues • 3 D display should provide depth cues • Linear perspective: ▫ more distant objects become smaller in the image �can indicate focus, importance, or ordering ▫ - elements of a uniform texture become smaller with distance �can give shape cues • Shadows: ▫ show the relative height of objects above a surface ▫ provide strong depth cues for objects in motion ▫ can be semi-realistic and still work as a depth cue • Occlusion: ▫ - very powerful depth cue Slide adapted from Klaus Mueller/ Colin Ware
Information Display in 3 D: Depth Cues • Shading: ▫ - shape cues from shading (shape-from-shading) diffuse + specular + shadows shape from shading (hole vs. hill) specular can reveal fine detail assume single light source Slide adapted from Klaus Mueller/ Colin Ware having more than one light source can lead to confusion
Information Display in 3 D: Depth Cues • Other depth cues: ▫ depth of focus ▫ motion parallax (structure from motion) --> how objects relate under motion (see next slide for examples) ▫ steroscopic depth (binocular displays) • For fine-scale judgement, for example, threading a needle: ▫ stereo is important, and shadows and occlusion • For large-scale judgement ▫ linear perspective, motion parallax, and perspective are important ▫ stereo is not so important • However, for information visualization displays, one may exploit focus to emphasize importance, despite depth relationships Slide adapted from Klaus Mueller/ Jürgen
Motion • 3 D Structure from Motion ▫ Simple example of 3 D structure from motion animation ▫ Second example with user control • There is lots more to motion, but we won’t cover.
Shape, Symbol • Symbols should be rapidly perceived and differentiated • Application for maps, military, etc.
Uses of Symbols • Whole section here (to be included later, from Bertin, others)……
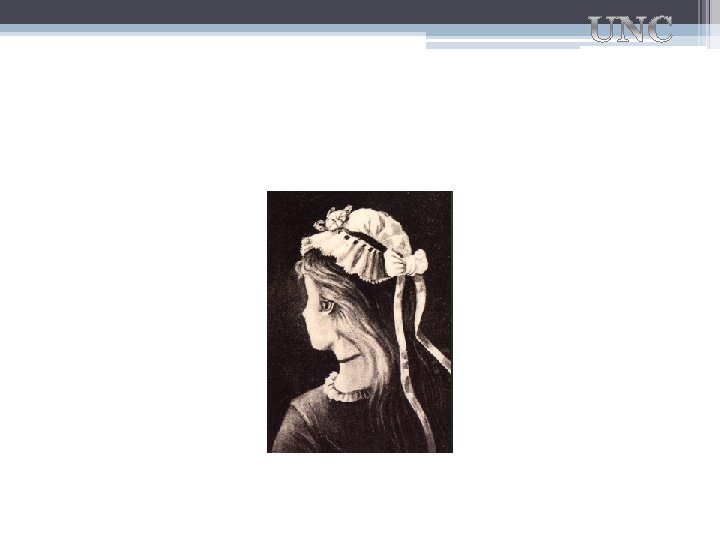
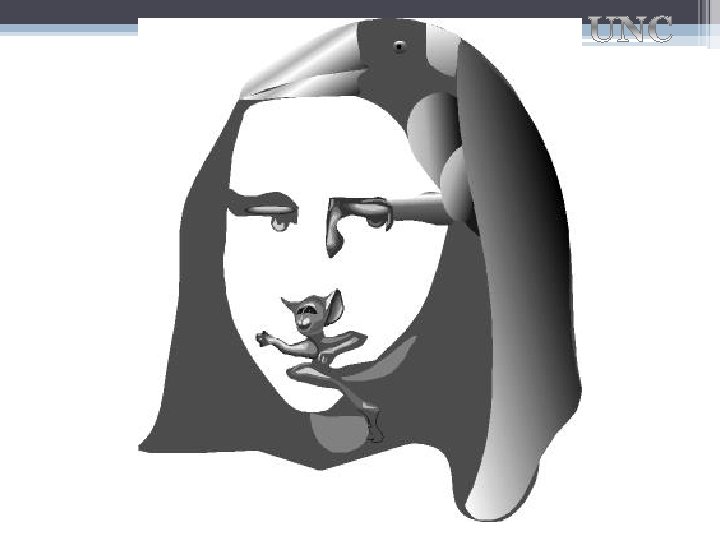
Multiscale Resolution • Images at coarse scale can still be recognized. Remember Dali’s painting (face in block ) • Shark Picture. (look closely). From artist Chris Jordan (select running the numbers II, scroll down to hammerhead shark). • Look carefully at face on next slide. What do you see?
Luminance/Brightness • Luminance ▫ Measured amount of light coming from some place • Brightness ▫ Perceived amount of light coming from source
Color Models • RGB (based on technology model) • HSB (HVS) model (based on perceptual color model) ▫ Hue - what people think of color ▫ Saturation - intensity, whiteness ▫ Brightness (Value) - light/dark
Contrast • Important for fg-bg colors to differ in brightness Hello, Hello, here here is is is some some text. Can Can Can you you you read read what what it it it says? says?
Color Background Contrast • Focus on the black circle for a few seconds, then switch to one of the white fields. For a moment, you will see a white circle (the complementary color to the black circle). This is due to the local change of the adaption level. • Another example (used in Florida Recount joke). From: Colin Ware
Successive Contrast • Surround matters, especially for colors • Afterburn effect: ▫ focus on colored panels ▫ then switch to white panel ▫ do this for saturated and non-saturated backgrounds • Color contrast effects ▫ use saturated colors sparingly, they may cause undesired effects ▫ neutral borders can help From Klaus Mueller
Chromatic Color is Irrelevant… • To perceiving object shapes • To perceiving layout of objects in space • To perceiving how objects are moving • Therefore, to much of modern life Many people go much of their life without realizing they are color blind.
Color is Critical… • To help us break camouflage • To judge the condition of objects (food) • To determine material types • Extremely useful for coding information
Implications • Color perception is relative • We are sensitive to small differences- hence need sixteen million colors when driving computer displays • Not sensitive to absolute values- hence we can only use less than 10 or 12 colors for coding • Brad’s view ▫ Can use successfully for labeling small number of categorical data (12 or less). ▫ Can in certain constrained cases be utilized as continuous scale (isoluminance example). But must be careful here; often not used properly in this case.
Electronic Chart Example
Applications • Color interfaces • Color coding (for nominal data) • Color sequences for ordinal data • Continuous Color for multi-dimensional data • Call attention to specific data • Increase appeal, memorability • Increase number of dimensions for encoding data
Color Categories • Are there certain canonical colors? ▫ Post & Greene ‘ 86 had people name different colors on a monitor ▫ Pictured are ones with > 75% commonality Black version: Colin Ware, Color Version: Post & Greene ‘ 86
Gender Differences for Color? • Number of colors men perceive vs women? ▫ No difference (millions) • Number of colors used in describing objects? How fast one call recall name (label) of color? ▫ Women are superior (more, faster) than men (Arthur, H. , Johnson, G. , & Young, A. (2007). Gender differences and color: Content and emotion of written descriptions. Social Behavior and Personality, 35(6), 827 -834. doi: 10. 2224/sbp. 2007. 35. 6. 827).
Color for Categories • Can different colors be used for categories of nominal variables? ▫ Yes ▫ Ware’s suggestion: 12 colors �red, green, yellow, blue, black, white, pink, cyan, gray, orange, brown, purple
Ordinal data Principles ▫ Order: ordered values should be represented by perceptually-ordered colors ▫ Separation: significantly different levels should be represented by distinguishable colors ▫ Many good choices can be derived from “strips” through perceptually uniform color spaces (grey scale, heated object scale, etc). ▫ Luminance: good for showing form ▫ Many hues: useful for showing readable values
Interval Sequences: Contour Lines and Color • Both can indicate regions ▫ Contour by showing the boundaries ▫ Color to distinguish different objects/groups. • Choice of spacing ▫ Regular intervals to enable interval comparison ▫ Specific values to highlight regions (sea level) ▫ Choice of spacing • Can attempt to use Uniform Color Space
Color for Sequences (continuous) Can you order these (low->hi)
Possible Color Sequences Gray scale Full spectral scale Single sequence part spectral scale Single sequence single hue scale Double-ended multiple hue scale
Continuous Uses: Color Scales • Examples of Grey, Psuedo, Hue Color scales. Applied to medical image. (From Hemminger Radiology work). (need images)
Color for Continuous Variables ▫ Is done, but beware this is tricky, must be careful ▫ For example see Ware, C. , & Beatty, J. (1988). Using color dimensions to display data dimensions. Human Factors, 30(2), 127 -142.
Color as Scale + Luminance • Isoluminance Color Display (Hemminger). • Studies use of color vs luminance for showing two dimensions of finding (anatomical structure versus cancer signal) on map. • What’s obvious shortcoming with this visualization? (story)
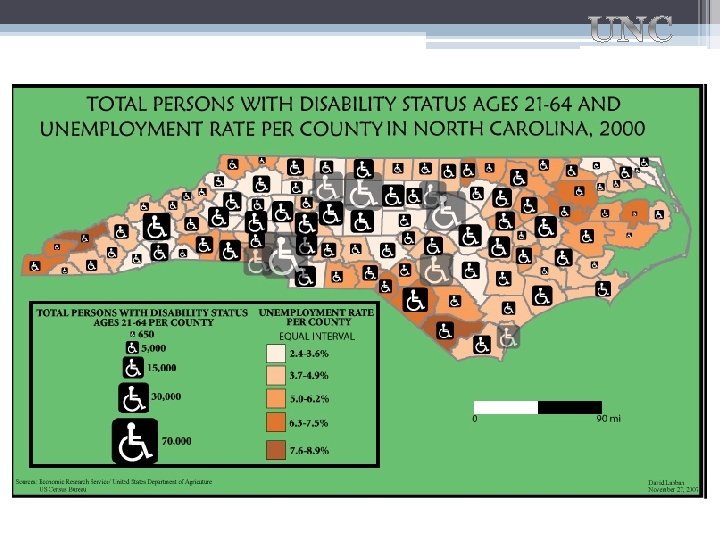
Bivariate Maps • Rows and columns: to preserve univariate information, display parameters should be perceptually orthogonal (ideally) • Display map data with more than one variable per map location is challenging. • First do we have to use color, or contours to indicate regions (states, counties)? • What visual types do we have left to show the variables present at each map location?
Hue Saturation Bivariate Map Tufte ‘ 83, pg. 153.
• Do we think this works? • How easy to perceive separate channels of information? ▫ Population density ▫ Change in population
• Absolute number of disability, does this inform? If number is proportional to population is it interesting? • How well does the separate symbol (wheelchair) which varies in size to show quantity, work? • How well does the combination of this symbol (wheelchair) work in conjunction with quantitative variable for number of people with disability?
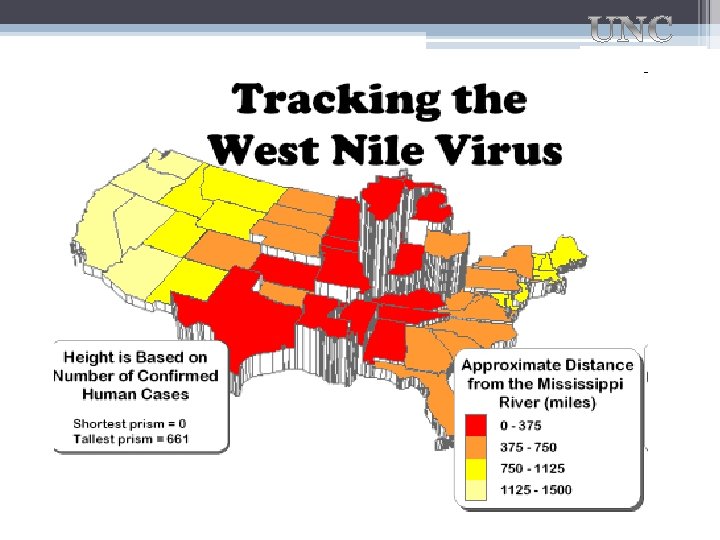
• How effective is the color for showing distance to the Mississippi river? • Could we leave it out? Show river with more emphasis and depend on map information to visually show correlation to location of river?
Consider Data • Nominal, ordinal, interval or ratio • Map or entity based coding • Amount of detail • Rate of change, i. e. is high spatial frequency present in a variable? If so may require different choice (think West Nile Virus example with widely varying rates all across the US).
Consider Audience (User) • Color deficient viewers? ▫ Don’t depend on red-green differentiation ▫ Use redundant scales • Application area conventions? ▫ Use familiar scales (or at least know when you’re not) • Color associations with variables? ▫ Use associated color • Color associations with data ranges? ▫ Use red for bad range (in U. S. ) ▫ Use red for hot
Take home messages • Use luminance for detail, shape and form • Use color for coding - few colors • Minimize contrast effects • Strong colors for small areas - contrast in luminance with background • Subtle colors can be used to segment large areas
More messages • Color excellent for multi-dimensional data • Use additional tools to get quantities • Beware of artifacts due to color re-sampling • We need precise color for specification and standardization
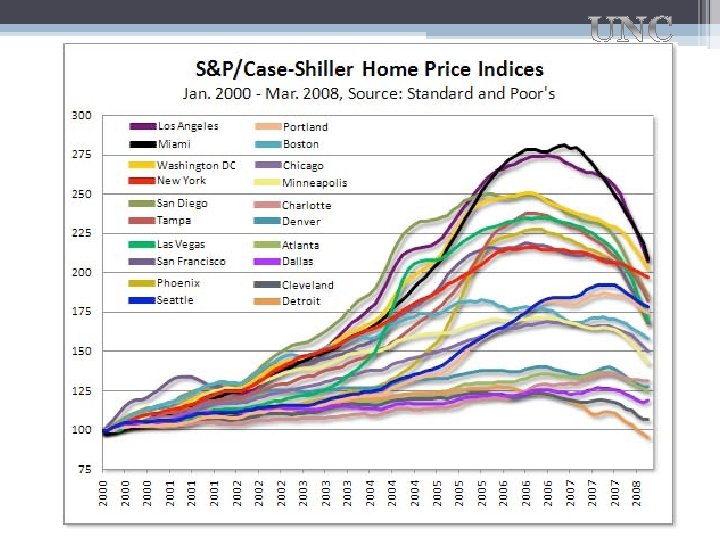
• What’s the best way to visualize this information? • Would map-based be better? • Can I easily pick out individual curves by color? (more than 10 -12) • How about height/chart figure for values? • What about a data table? • What are the questions we’re trying to answer?
Influence on Visualization • Why we care ▫ Exploit strengths, avoid weaknesses ▫ Optimize, not interfere • Design criteria ▫ Effectiveness ▫ Expressiveness ▫ No false messages
Design criteria: Effectiveness • Faster to interpret • More distinctions • Fewer errors This? Or this? 0 1 2 3 4 5 6 7
Sensory vs. Arbitrary Symbols • Sensory: ▫ Understanding without training ▫ Resistance to instructional bias ▫ Sensory immediacy �Hard-wired and fast ▫ Cross-cultural Validity • Arbitrary ▫ Hard to learn ▫ Easy to forget ▫ Embedded in culture and applications
Which Properties are Appropriate for Which Information Types? Final Take Aways
Channel Properties Luminance Channel • Detail • Form • Shading • Motion • Stereo Chromatic Channels • Surfaces of things • Labels • Categories, Berlin and Kay (about 6 -10) • Red, green, yellow and blue are special (unique hues)
Rankings: Encoding quantitative data Cleveland & Mc. Gill 1984, adapted from Spence 2006
Visual Property vs Data Type Stephen Few’s Table: Attribute Line length 2 -D position Orientation Line width Size Shape Curvature Added marks Enclosure Hue Intensity Quantitative Qualitative
Interpretations of Visual Properties • Some properties can be discriminated more accurately but don’t have intrinsic meaning. (Senay & Ingatious 97, Kosslyn, others) • If there are intrinsic meanings use them (advantage and avoid confusion). And be aware when you use them that you are not sending conflicting messages. ▫ Density (Greyscale) Darker -> More ▫ Size / Length / Area Larger -> More ▫ Position Leftmost -> first, Topmost -> first (culture/language specific) ▫ Hue Culture specific meanings ▫ Slope no intrinsic meaning ? ? ?
Analyze this! • Watch the following video (i. POD Shuffle Ad 2005) ▫ Describe how information is visualized. ▫ List the visual system mechanics that this video takes advantage of.