Visual Organizers Developed by Brenda Stephenson The University

Visual Organizers Developed by Brenda Stephenson The University of Tennessee

What are visual organizers? Visual organizers, also called graphic organizers, are a way to visually represent information for students. This tool can help deaf students understand concepts, relationships, analyze and organize data, and understand sequences and systems.

Why use them? Pare down the information to the main ideas Give students a different way of looking at the same information. Can be used as a cross-curriculum tool.

Guidelines Consistent: choose standard set, establish a routine Coherent: label clearly, limit number of ideas Creative: use during all stages of lesson, use illustrations, group activity

Uses • knowledge • concept • analysis • discussion • comprehension • cause/effect • synthesis • compare/contrast • evaluation • sequencing • problem solving • 5 Ws (5 Ws +H)

Types • Webs • Flow Chart/Cycle Chart • Hierarchy/Tree Maps • T-Chart • Venn Diagrams • Fun Graphics

Webs Also called Bubble Charts Cross-curriculum Uses include: concept discussion relationships cause/effect 5 Ws/5 Ws +H

Concept Web

Character Description: “Bride to Terabithia” Intelligent, imaginative, adventurous Short hair, wore simple clothing, tomboy Teacher pleaser Leslie Burke Character Creative thinker & problem solver Animal rights activist Opinionated

5 Ws + H What Who British chieftain, probably just a legend British Isles, Area of England, Scotland, & Ireland today. Where Removed Excalibur from stone to become rightful King of England King Character Arthur Quest is basically a crusade to fight the heathen in the Middle East. How When 5 th-6 th century, Middle Ages King Arthur goes on quest for Holy Grail, believe to hold great power Why

Math Show at least 6 ways to achieve the middle number 2 x 6 6+6 8+4 12 20 - 8 3 x 4 24/2

Cause/Affect Web

Cause/Affect Web Cause Affect Heat Boils Water Cold Freeze s

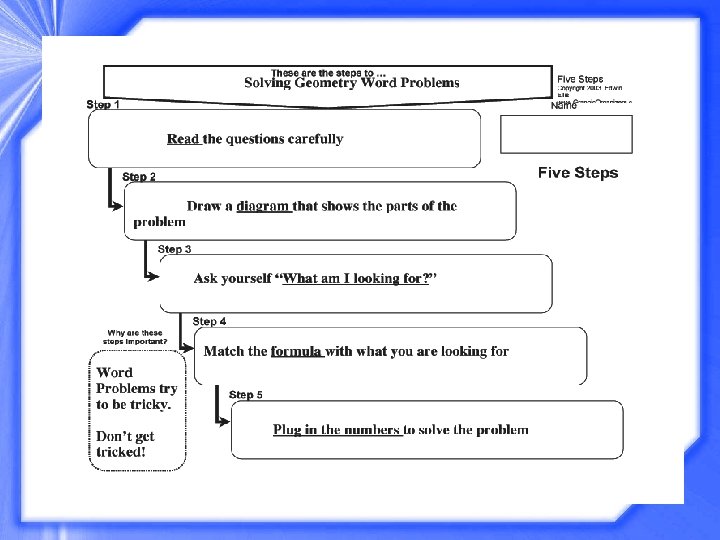
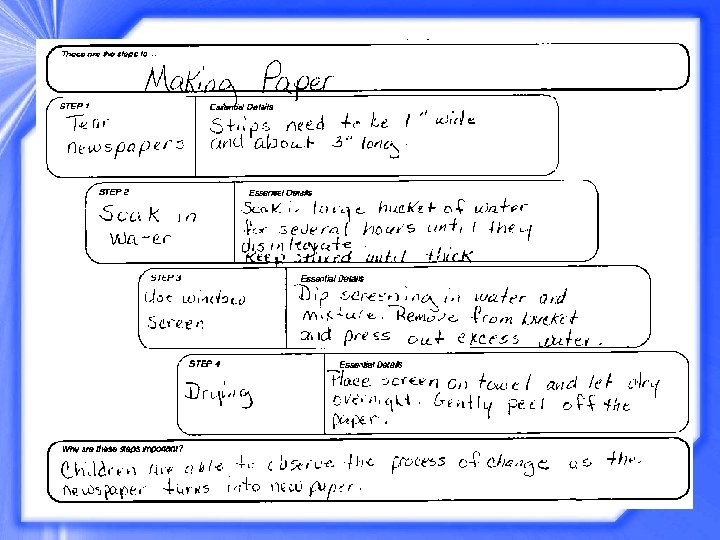
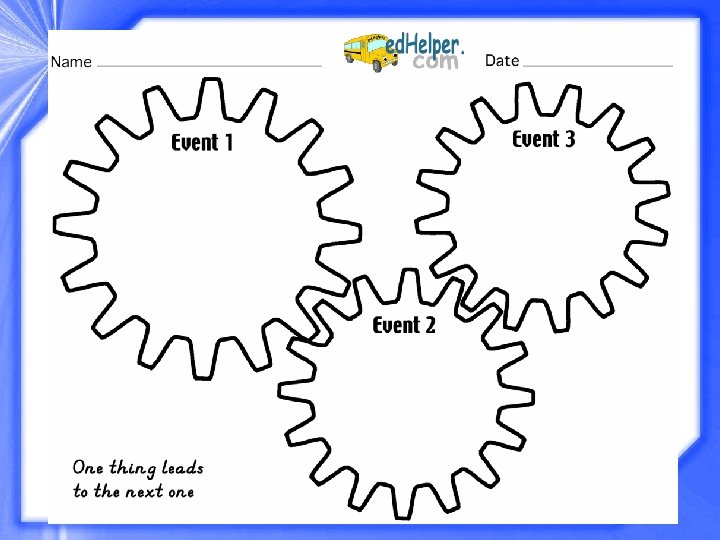
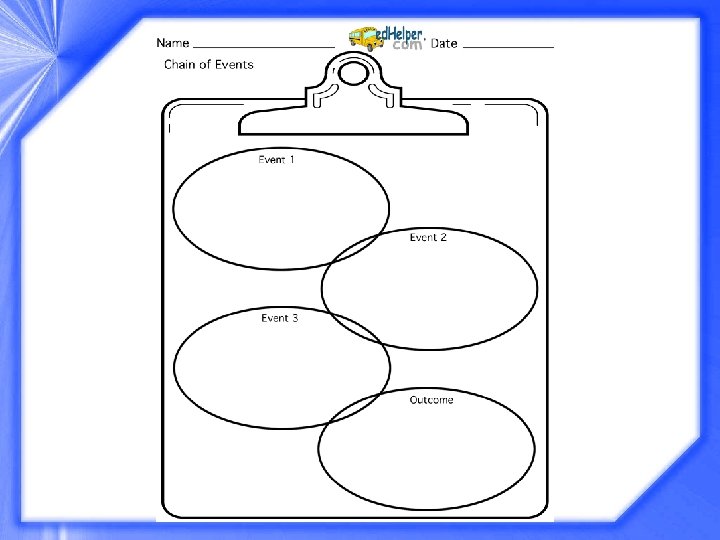
Flow Charts and Cycle Charts Cross-curriculum Uses include: knowledge comprehension application sequencing life cycles

Flow Chart details

Flow Chart Topic: “Where the Wild Things Are” Max gets into trouble details Max was misbehaving and his mother sends him to his room without his supper He imagines a place where the wild things are Max misses his family details Max is not afraid of wild things They make him king They have a party with dancing & feasting. Max travels back to his bedroom where he fins his supper waiting.

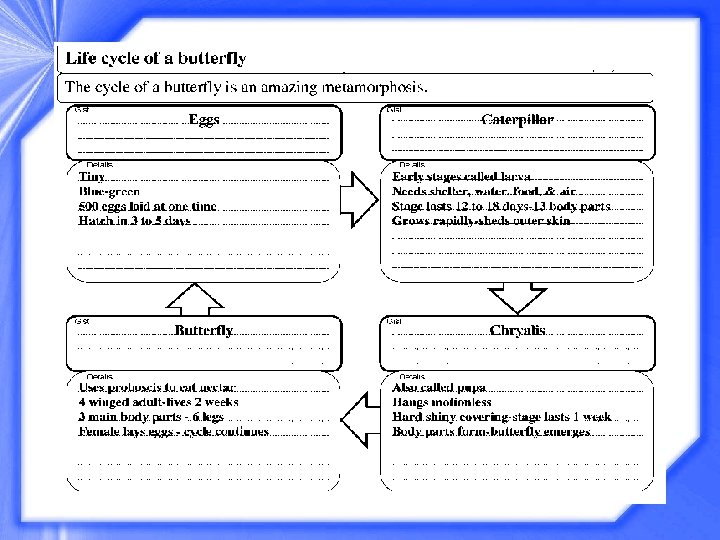
Cycle Chart

Butterfly Live Cycle

Hierarchy Maps Also called Tree Maps Cross-curriculum Uses include: knowledge comprehension analysis

Hierarchy Chart

Hierarchy Chart Civilizations: Meso-America Attribute Religion Examples Temples Priests Rituals Human sacrifices Blood sports pyramids Attribute Social Groups Attribute Support Activities Examples Priests Farmers Scribes Builders Slaves warriors Farming Basket making Irrigation canals Markets Roads weaving Attribute Writing Examples Alphabet Stone csarving Calendars Record keeping Oral to written history

Tree Chart Family History & Relationships Glenn Warren Mary Platt Lee Warren Charles Maude Brown ? ? Anna Brown Garfield Josephine George Nancy White Williams Hanks Scarboro Fred White Violet Warren Janie White Hensley Alfred White Bertha Hanks

Venn Diagrams Limited Cross-curriculum Uses include: knowledge analysis comprehension compare & contrast

Venn Diagram

Compare & Contrast Knoxville, TN 3 rd largest city in TN Foot of the Smoky Mtns Was once the capital of TN Chattanooga, TN State university located here 4 th largest city in TN Located on river Civil War battles fought here Borders Georgia

One the lines below, write all the factors that make up the number 12: 1, 12, 2, 6, 3, 4 54: 1, 54, 2, 27, 6, 9, 3, 18 12 12 4 54 1 27 2 54 3 9 6 18

Father r Mother Fathe M ot he r Types of Family Interactions Children Mother Children Father

T-Charts Limited Cross-curriculum Uses include: analysis comprehension planning/research

T-Chart What I Know What I Need Know

T-Chart What I Know What I Need Know What I Learned

T-Chart What I Know Visual way to show information Venn diagrams Flow charts Tree charts What I Need Know What I Learned How to use Where to find Different types Curriculum uses Guidelines: consistent, coherent, creative Internet sources, other teachers Hierarchy, cycle charts, webs Cross-curriculum Use as introduction, homework, group activities, tests

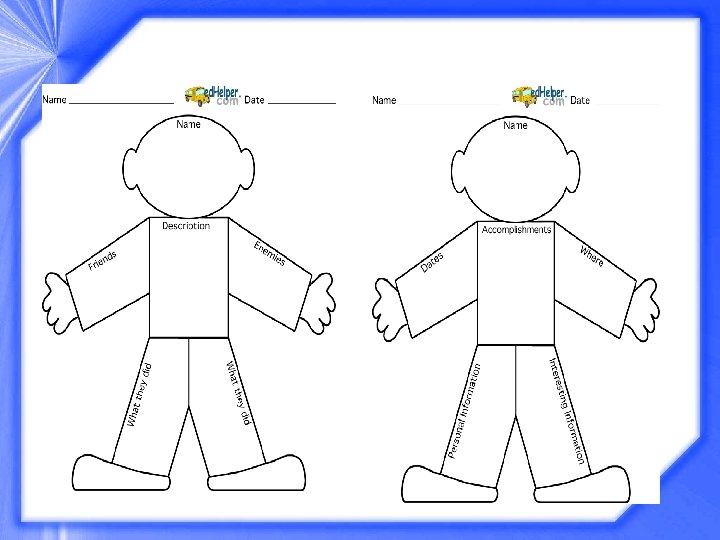
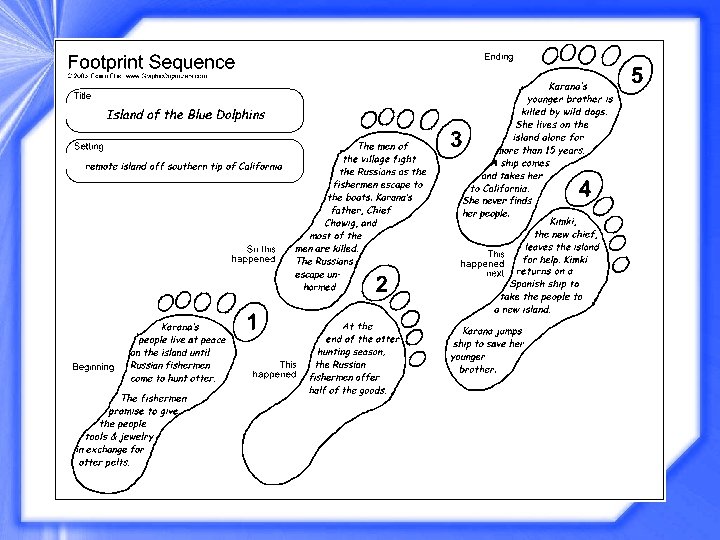
Fun Visual Organizers


Where do I find visual organizers? Here are some websites : www. edhelper. com/teacher/graphic_organizers www. graphicorganizers. com/downloads www. abcteach. com/graphicorganizers www. freeology. com/graphicorganizers www. educationoasis. com/curriculum/graphic_organizers www. thinkport. org/technology/template www. education-world. com

Summary Visual Tool Cross-curriculum uses Guidelines Visual or Graphic Organizers Planning necessary Many different types Variety of uses
- Slides: 43