Visual Management Visual Management Visual Management is a


")


 Color coded guards and labeling")


 is a tool for visual")


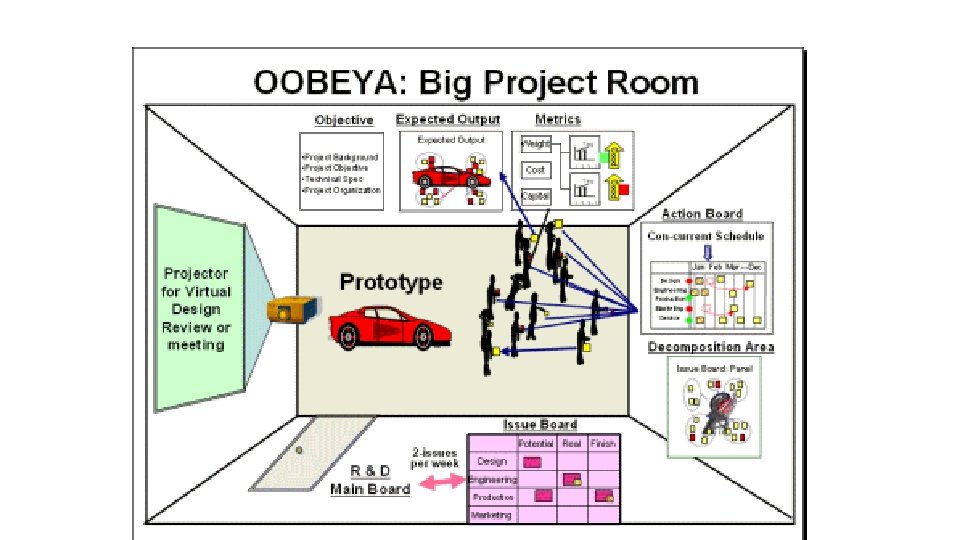


 Chart can wear")


- Slides: 103
Visual Management
Visual Management • Visual Management is a set of techniques for creating a workplace embracing visual communication and control throughout the work environment. • The visual management philosophy is underpinned by the view that ‘what gets measured & displayed gets done’ • It makes it easy to understand the processes which have been put into place
Visual Management Goals • Make everyone’s job easier • Give all associates a high degree of ownership in their work, and pride in their workplace • Increase communication by making information easier to understand • Improve company overall success
PRINCIPLES OF VISUAL MANAGEMENT SAFETY VISUAL FACTORY PRODUCTIVITY QUALITY
The Visual Management In the visual workplace, anyone will easily know the: who, what, when, where, why, and how of an area within 5 minutes
The foundation of continuous improvement
How do we create Visual Management? Workplace Organization
The Visual Workplace • is safe. • is clean and organized. • is easily understood. • is managed through involvement by all. • creates high quality products. • communicates progress.
Workplace Organization A Vital Link To Continuous Improvement
5 s
What is it? • 5 S is a workplace organization technique • It is a way to involve associates in the ownership of their workspace • It helps create and maintain the efficiency and effectiveness of a work area
What’s it for? • It is a way to create: • • • Cleaner work areas More organization Safer working conditions Less wasted time Efficient work processes and practices More available space
Different types of workplaces • There are basically three different types of workplaces: 1. Third Class : People throw trash around and no one cleans up. 2. Second Class: People throw trash around and someone else pick it up. 3. First Class : No one throws trash around and everyone works to keep things clean.
The 5 S Principles • SEIRI : Sort out • SEITON : Straighten/Set in Order • SEISO : Shining • SEIKETSU : STANDARDIZE • SHITSUKE : Sustain
5 s Ford’s CANDO C – Cleaning Up A – Arranging N – Neatness D – Discipline O – Ongoing Improvement Toyota’s 5 S S –Sort S – Straighten/Set in Order S – Sweep S – Standardize S – Sustain Six Sigma DMAIC D – Define Phase M – Measure Phase A – Analyze Phase I – Improve Phase C – Control Phase
Eliminate waste Sort SUSTAIN STANDARDIZE Set in order Shine
1 -The First S - Sorting Separating the Needed from the Not-Needed • Decide what you need. • Remove unnecessary clutter. • All tools, gauges, materials, classified and then stored. • Remove items which are broken, unusable or only occasionally used.
The First S - Sorting RED TAG • Red Tag Technique: • • • GIVE STAFF RED LABELS ASK STAFF TO GO THROUGH EVERY ITEM IN THE WORK PLACE ASK IF NEEDED & THOSE THAT ARE NEEDED, IN WHAT QUANTITY NOT NEEDED >> RED TAG IT STORE IN THE RED TAG AREA
The First S - Sorting • Place the suspected items in the RED TAG AREA for one week. • Allow the staff to re-evaluate the needed items. • At the end of week those need items should be returned.
Item Name &/or Description: Department: Value per Item: Classification: CE N GLE XX X ( --) 5 S --- RED TAG Ent er # in box Reason: Ent er # in box Action: Ent er # in box 1. Raw Material 2. Work-in-Process 3. Component 4. Finished Product 5. Machine / Equipment 6. Mold / Jig 7. Tool / Fitting 8. Other_______ 1. Unnecessary 2. Defective 3. Leftover Material 4. Unknown 5. Other_______ 1. Eliminate 2. Return 3. Move to Red Tag Storage 4. Other________ Completed: Tag Attached: Action Taken: Year_____ Month_____ Day_____ File completed Tag at ______
The First S - Sorting • Organisation: Priority Frequency of use How to use Low Less than once per year Once per year Throw away Store away from the workplace Average Once per month Once per week Store together but offline High Once Per Day Locate at the workplace
The First S - Sorting • Expected Results of Sorting : • Elimination of wastes of resources, material, spaces, …etc. • Reduce WIP inventory
2 -The Second S – Set in order A place for everything and everything in its place, clean and ready to use Organise layout of tools and equipment • Designated locations • Use tapes and labels • Ensure everything is available as it is needed and at the “point of use”
The Second S – Set in order Workplace Checkpoints: - • Storage places clearly marked? • Tools classified and stored by frequency of use? (Low, Average and high) • Pallets stacked correctly? • Safety equipment easily accessible? • Floors in good condition?
The Second S – Set in order • Expected Results of Sorting : • No more Searching. • Reduce Setting up time • Prevent : misplacing, Leaking oil, wasting energy or materials. . Etc. • Improve: • Space Utilization. • Eliminate: • Searching time • Dangerous conditions
Does this look well Straightened?
Outlines or Footprints A little out of place
3 -The Third S – Shining Cleaning for Inspection • Identify and eliminate causes of dirt and grime – remove the need to clean. • Sweep, dust, polish and paint. • Divide areas into zones. • Define responsibilities for cleaning. • Tools and equipment must be owned by an individual. • Focus on removing the need to clean.
The Third S – Shining • Expected Results of Sorting : • • Higher Quality work and products. More Comfortable and safer work environment. Greater visibility and retrieval time. Lower maintenance time.
Before and After
A well shined facility
A well shined facility
4 -The Fourth S - Standardizing Developing Common Methods for Consistency • Generate a maintenance system for the first three • Develop procedures, schedules, practices • Continue to assess the use and disposal of items • Regularly audit using checklists and measures of housekeeping • Real challenge is to keep it clean
A Place For Everything Even rags, gloves, and trash
A Place For Everything Every item has a place, is labeled, and color coded
5 - The Fifth S - Sustaining Holding the Gains and Improving • Determine 5 S Level of Achievement • Perform routine checks • Analyze results of routine checks • Measure progress and plan for continuous improvement
Visual Ranges Make It Easier to Sustain
Visual Ranges Make It Easier to Sustain
Sustain Everyone needs to do their part to keep things where and how they belong
5 S Checklist
5 S Supportive Strategies • Color coding • Point of use • Safety
Color coding things is a fast, easy way to separate different items and to visually determine if something is misplaced
Examples
Examples
Color Coded Scrap Hoppers
Part Color Coding Different color for each part number h. Colors correspond to colors of: 4 work units 4 tooling 4 gages 4 fixtures 4 settings
Color Coded Dies
2 -Point of Use • • • Looking For Tools Parts disposal Operating procedures Lock-out instructions Materials/Finished goods Information
Point of Use (Shadow Board-Visual Control)
Point of Use Not enough room to store at the point of use, so make them mobile
Point of Use Fixtures rotate so they take up less space and are kept at the point of use
Point of use Information
Safety: The 6 th - S Is of great concern when considering workplace organization and the 5 S’s
Safety the Sixths S
Safety (Visual Control Signage) Color coded guards and labeling
Sufficient Room to Exit the Work Unit Exit One small exit for up to 9 operators
Safety Well labeled, but what keeps people out of coils?
Safety Color coded and visual -easily accessible?
VISUAL MANAGEMENT INITIATIVES 1. Visual Control Boards. 2. Andon 3. Footprints 4. Signage 5. Obeya 4. Hansei
Visual Display Information regarding Q C D M S • Q - Quality C - Cost D - Delivery M - Material S - Safety
VISUAL BOARD What is Visual Control Board 1. A color-coded , physical visual control system used for monitoring of shop-floor activities and KPIs. Use of Visual Control Board 1. Visual boards are used as activators and data communication centre. 2. The visual board area is used for shop-floor meetings. 3. A centre of periodical progress reviews and updates. 4. Used to drive the business processes from the boardroom to the shop floor. Benefits of Visual Control Board 1. It quickly gives visibility to the progress of each tasks for further action. 2. Identifies the resources and activities being undertaken.
VISUAL BOARD Red zone indicates the supplier is on the verge of not satisfying their customer. Very low level of goods maintained. Yellow zone indicates customer requirements are being met. Low level of finished goods maintained. Green zone indicates the customer’s needs are being fulfilled. Supplier is building more than the customer is requiring and it may be time to stop production until demand is more in line with supply. Other pertinent information (e. g. . Quality performance) would be contained in the information section. The cards hanging on the hooks in the colored zones reflect the part number identified in the section, a given quantity of material in one container. When a card is on the hook it indicates an empty container. This is an example of a pull board that could be used with internal operations, as shown, or even with external customers.
ANDON What is Andon? 1. Andon (Japanese for lantern) is a tool for visual management and refers to a system of signals used to indicate the operational status (at a glance) of a machine or work center. 2. It can be used manually or automatically. 3. It also one of the principle elements of the Jidoka quality-control method.
ANDON Use of Andon 1. Alerts management and other workers to quality or process problem. 2. Gives the worker the ability to stop production when a defect is found, and immediately call for assistance. 3. Indicates where the alert was generated, and may also provide a description of the trouble whether shortage of material or maintenance call or supervisor call. .
ANDON Defect created or found Common reasons for manual activation of the Andon Part shortage Equipment/Tool malfunction A safety problem exists
Types of Andon ANDON 1 Visual Andon Graphics Text § Display production data in real time. § Calculate shift efficiencies and production targets. Coded signal lights Green - no problems § Ideal for STOP / WAIT / GO signaling in busy factories § Boost health and safety. 2 Yellow - situation requires attention, production flow at risk Red - PRODUCTION STOPPAGE: IMMEDIATE ASSISTANCE REQUIRED Audio Andon Coded Tones Coded Tunes Buzzers / Alarms Prerecorded Messages
FOOTPRINT What is Footprint 1. Markings on the floor or work area outlining specifically where items should be placed. Benefit 1. To ease employees during storage or retrieval. 2. It avoids employees wasting time looking for things or pondering their next move. 3. The workplace becomes clean and better organized. 4. Operation on the shop floor and office become easier and safer q. 5. Visible location of parts or equipment for easy traceability and save time of searching
FOOTPRINT CREATING FOOTPRINT 1. A footprint is an outline of the items required at work areas indicating where the items should be placed. 2. Rules about footprints or floor borders a) Mark from the floor up to workbenches etc b) Start with plastic tape to test out, then move to paint c) Use colours to code footprints as shown in the following example, as a guideline : Light Blue - Raw parts/material Black - Finished good/parts Red - Non-conforming/KIV parts/material White - Other than parts/material Yellow – Border of work area
FOOTPRINT Yellow for work area border Black for finished part Light blue for raw material LINE SOZAI 5 S CORNER KANSEI TOOL CABINET NG QC CORNER Red for non-conforming part White for equipment VISUAL BOARD
Floor Labeling Example
SIGNAGE Signage is any kind of graphics created to display information. Displays To make staff aware of related data and information – charts, graphs etc Controls To guide the action of staff members – sign boards, dos and don’ts signs
Signs Example Designated Location
Signage Example Components Kanban: What, Where, and How many
Designated Location Example Egg Carton Display
Signage Example Information Boards
Signs Example
The best visual displays are easy to understand Symbols • are easily understood • give immediate status • engage viewer’s attention
Symbols make status visible and easy to understand
What do these symbols tell us? CAPABILITY Machine Number Machine Type P 1 Device Characteristic Potential Study Long Term Study Restudy Date Person Responsible Cp Capable Cpk Study Date
To add impact to visual displays, relate items to a cost.
Product display for waste awareness
Signage Examples Lighted displays capture attention
Signage Safety First ! Always. • Make safety records visible • Perform regular safety audits • Display lost time injuries / accidents • Keep track of where, when, why, and how accidents occur
Obeya • Japanese for "large room" or "war room" - refers to a form of project management used in Asian companies (including Toyota).
Obeya Team decision-making tools
Visual Display & Visual Measurement
How to implement Visual Display 1. 2. 3. 4. 5. 6. Identify subject to focus on Identify problems or success associated with the subject Identify the audience for visual display Choose the best location for the display Develop and test the display Improve, finalize, and implement the display
Review: Does your visual display offer these benefits? • Communicate information about performance • Make standards visible • Makes problems recognizable • Make work safer and easier • Recognize an achievement • Creates a shared knowledge base
Visual Measurement The BOS Chart The BOS (Business Operating System chart) Chart can wear many hats: • Visual display • Problem solving tool • Progress indicator • Assign responsibilities
Follow these steps to use BOS for Visual Measures The best reason to include BOS Charting with measure displays is because BOS requires action ! Key Measurable Data Analysis Improvement Activities Improvement Tracking
LINE: ________ DATE: ________ BOS Key Measurable TREND LINE SUGGESTIONS Ref # Suggestions Comp Resp. Date %Comp 25 50 75 100 25 50 75 100 Ref # ANALYSIS (PARETO) Description IMPROVEMENT TRACKING
Step 1 Involve users in the measurement Team members collect data; track numbers: • Total product produced • per hour, per shift, per day, per week, etc. • • • Average time to produce one unit PPM - number of defects Scrap - percentage of total produced Changeover time Downtime / Uptime
Step 2 Team determines what to BOS Chart • Something needing improvement • Team has control • Important to customer • Important to our company
Step 3 Team members update BOS • Use team meeting to study data • Team plans improvement activities • Everyone participates • Computers not required
Step 4 Make BOS results visible at the Work Unit
To develop Visual Measures decide. . . • What needs to be measured ? • Who is the user / audience ? • How often do we take the data ? • Who will do the tracking ? • How will we display data so that it speaks ? • Where do we best locate the display ?
Reality Check for Measures Answer these four questions about the measures you use: • Are they simple and easy to use? • Do they change over time? • Do they provide rapid feedback? • Do they foster continuous improvement?
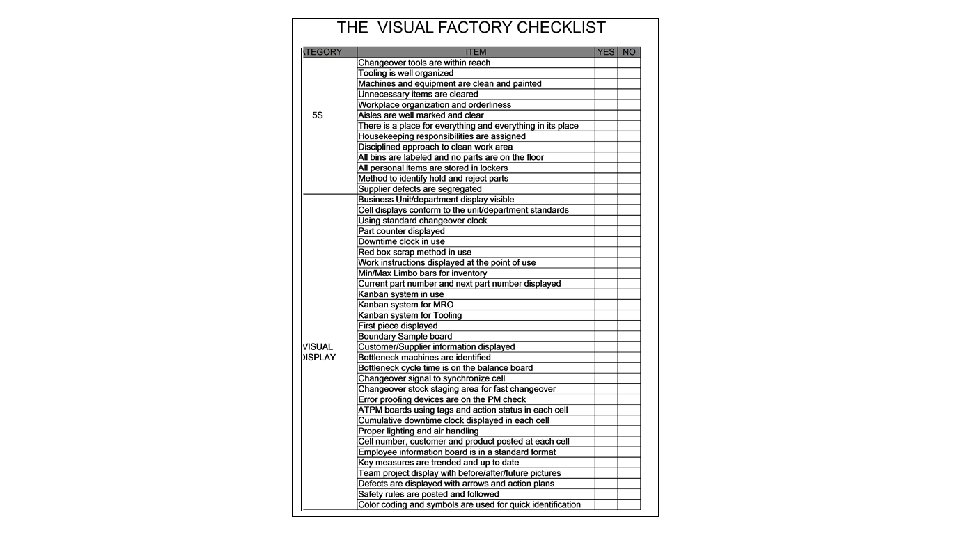
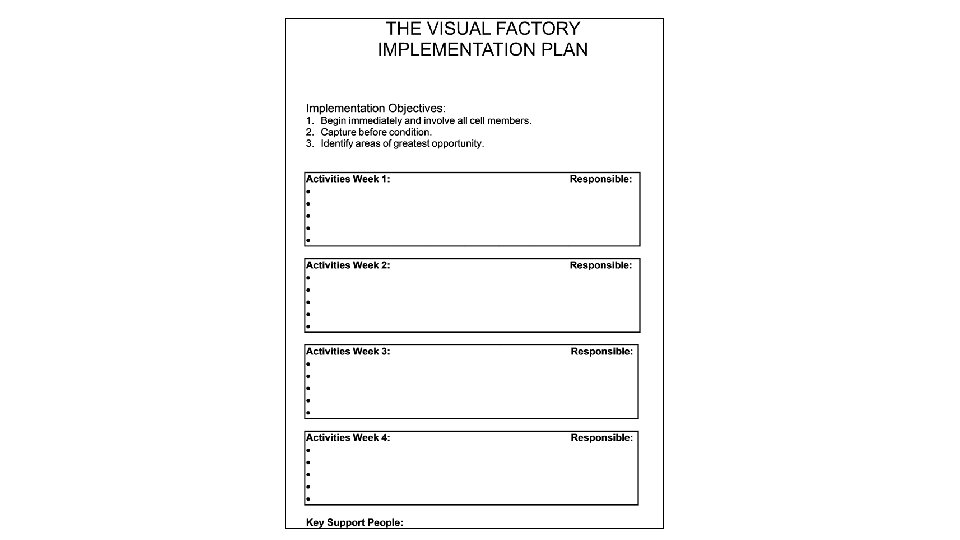
The Visual Management Check List and Implementation
End of Visual Management