Visual interpretation Chapter 10 Visual interpretation in important


 overlays to show outlines, mark features,")


- Slides: 89
Visual interpretation Chapter 10
• Visual interpretation in important to GIS development and application. • It is the interpretation of aerial photography by a photo interpreter. – Regarded as somewhat useful but oldfashioned likely to be replaced by digital analyses
• Visual interpretation is now seen in the new context. – Skills that a photo interpreter uses are applied equally to photographs as well as digital images – So a new name has come into use that of image analyst or image interpreter
• In addition, remote sensing data has become more detailed, much like photography • Finally, computer science is not evolved to the point where image analysis can be done completely automatically
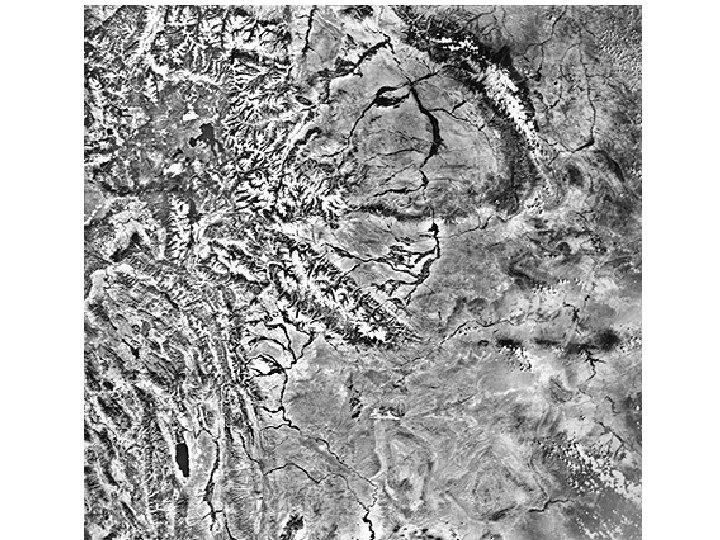
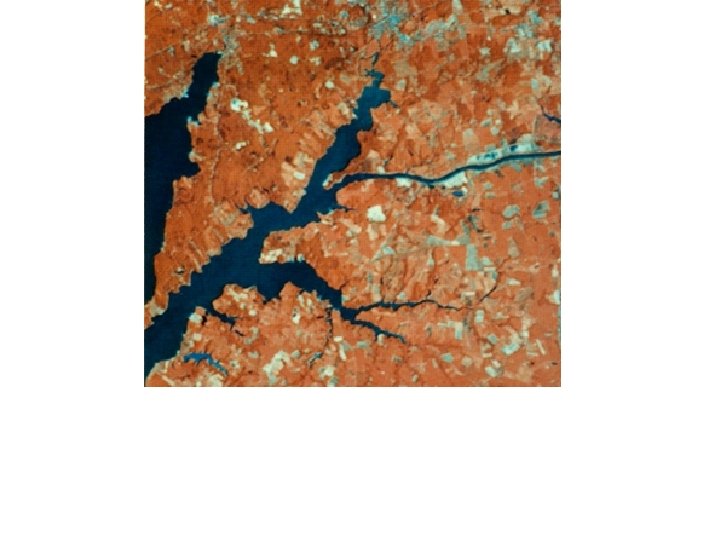
Characteristics of aerial imagery • Visual interpretation is used to extract information from fine resolution imagery at scales of 1: 40, 000 or larger – And includes almost all aerial photography and fine scale satellite imagery (e. g. IKONOS) – Excludes coarse resolution imagery produced by satellites such as Landsat
Characteristics of aerial imagery • GIS requires the following conditions be met – Geometric errors removed – Detailed spatial information is contained – Can provide taxonomic details such as separation of corn from wheat – Spatial relationships can be examined such as vegetation distribution and water bodies – Patterns of change from one day to the next are monitored – Equipment and experienced staff are available – Historical phenomena can be examined such as landuse change
Sources of imagery • Two common sources – Archival imagery previously acquired for another purpose. – Imagery acquired specifically for the project at hand
Archival imagery • Several sources are available. – USGS – US National Archives and Records Administration – State agencies • Department of Transportation • Department of natural resources. • Such imagery must often be bought
Archival imagery • In most cases, computerized databases permit online searches. • Many states update photography on a regular basis. – These are useful in examining change
Custom acquisition • Imagery is acquired, according to the user specifications. – The date scale emulsion coverage and other characteristics are determined by the user. • The disadvantages include – high cost – requirement for planning well in advance. – effort devoted to preparing and monitoring the specifications – delays and cancellations due to weather or equipment malfunctions
Custom acquisition • Users should prepare a contract or statement of work – Specifies in detail the products and services required from the firm with respect to cost, deadlines, and products to be prepared • Contract is a means for controlling the completeness and quality of the imagery
Custom acquisition • The photo interpreter may participate in making decisions about scale, date, time of day, deadlines, choice of film, and coverage
Custom acquisition • Photo interpreter should ask: – Will imagery be adequate for the purpose of the project? – Is the film emulsion satisfactory for the task? – Is the season suitable? – Will planned time of day provide appropriate shadowing? – In stereophotography, what will the overlap be?
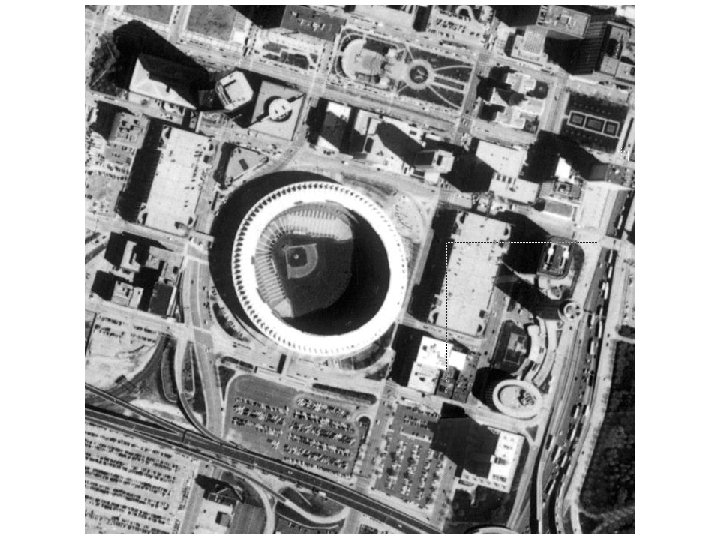
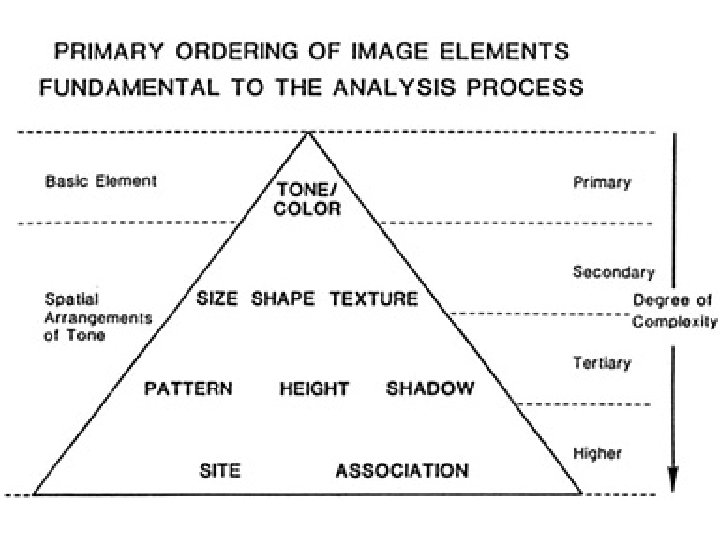
Elements of image interpretation • Image analysis requires explicit recognition of eight elements of image interpretation that form the framework and understanding of an image – – – – Shape Size Tone Texture Shadow Site Association pattern
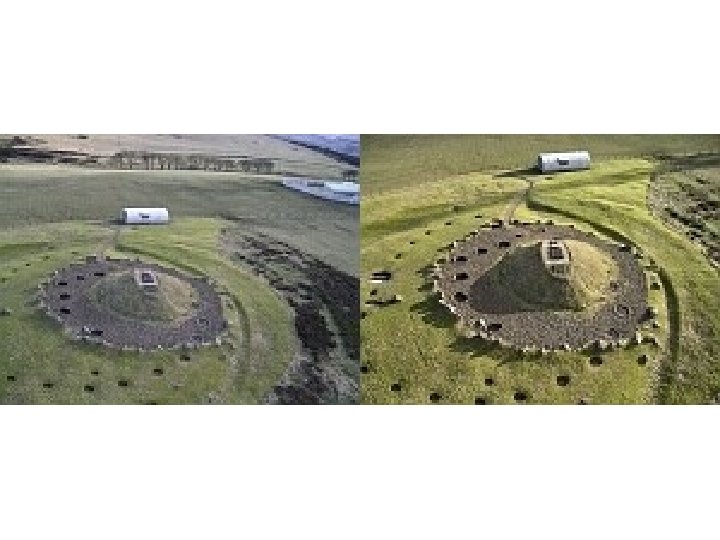
Shape • The outline of a feature – Important to note that shape depends on perspective – Overhead perspective, introduces scale effect
Size • The first to the dimensions of a feature • Relative size determined by comparing the object with familiar nearby features • Absolute size refers to the use of the aerial image to derive measurements
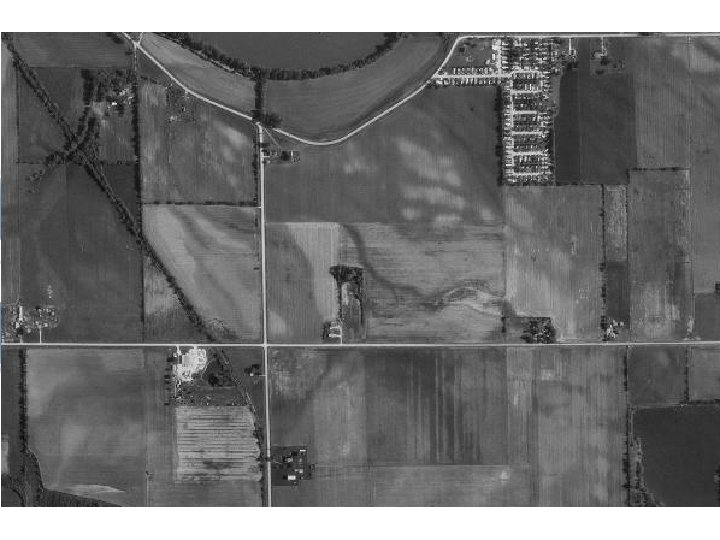
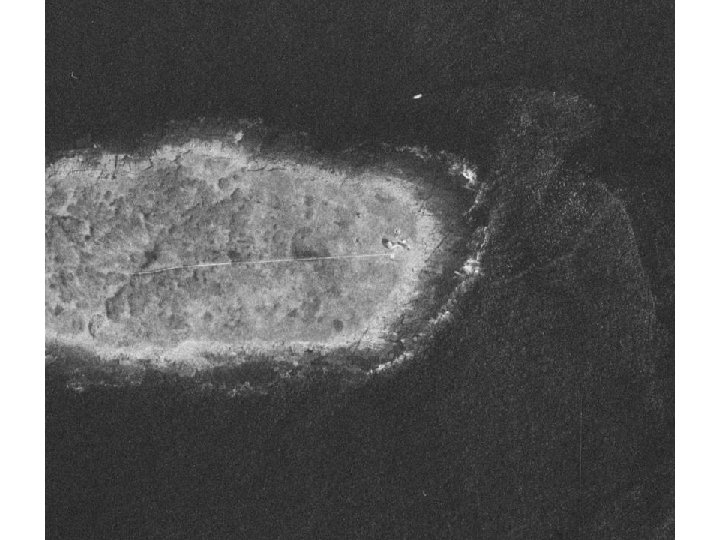
Tone • Refers to the average brightness of an area or, in the case of color imagery, to the dominant color of the region – Depends on the nature of the surface in the ankles of observation and illumination. – Smooth surfaces behave like specular reflectors, they tend to reflect radiation in a single direction • These features may appear bright or dark – Rough surfaces behave this diffuse reflectors. • Scatter radiation in all directions. • A peer is medium gray tones
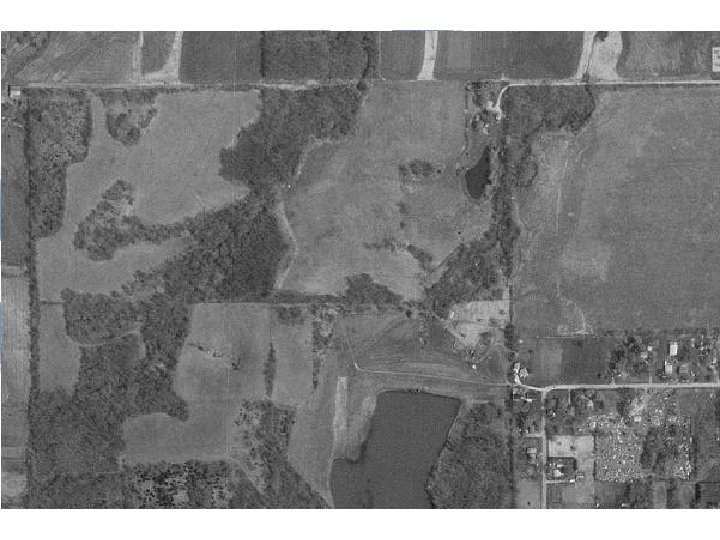
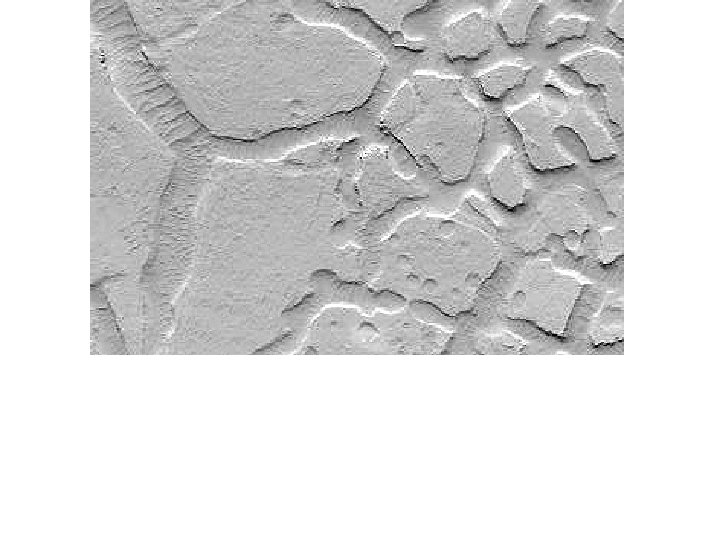
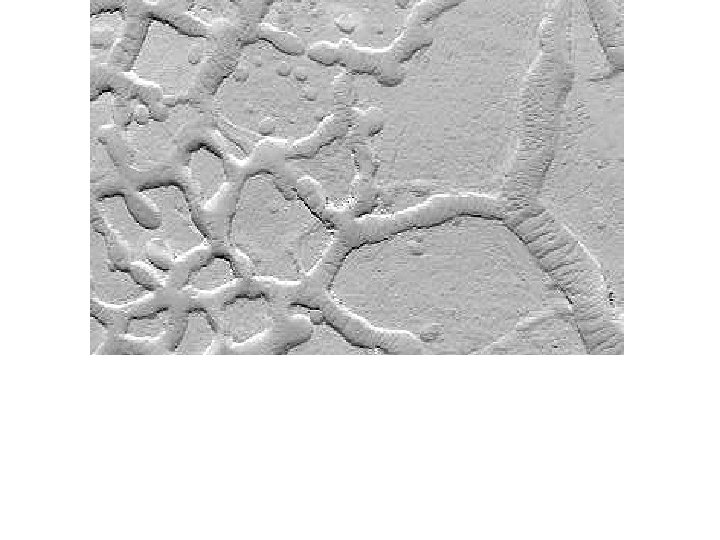
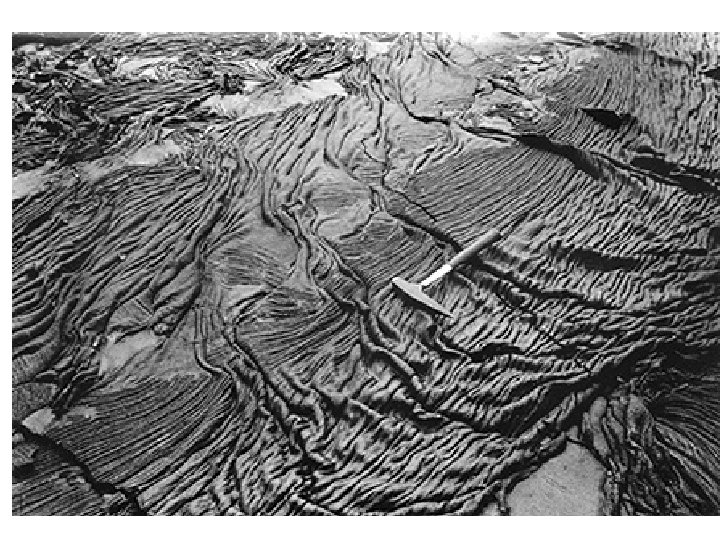
Texture • Refers to the variation in tone over a surface or the apparent roughness of the surface as seen in the photo • Created by micro shadows in small irregularities in the surface.
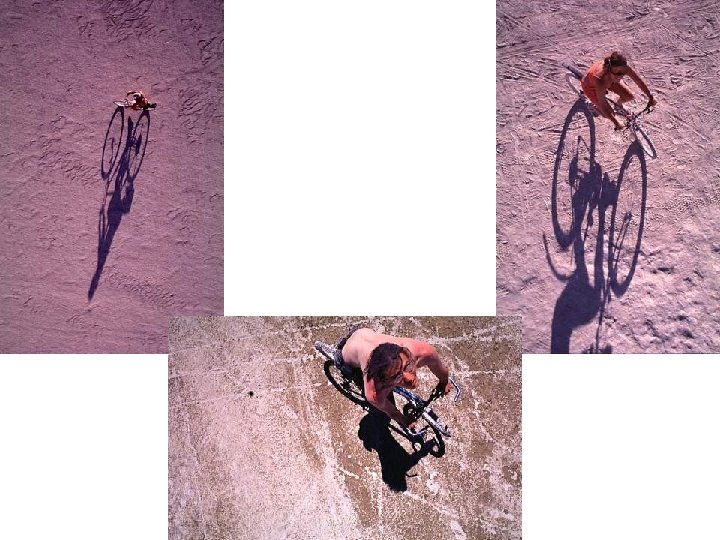
Shadow • Refers to large distinctive shadows that revealed the outline of a future as projected onto a flat surface. – Depends on the nature of the object, angle of illumination, perspective, and slope of the ground surface
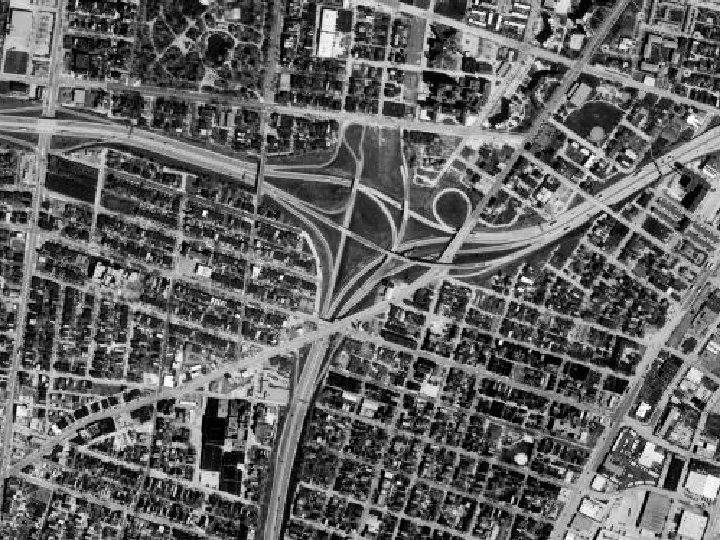
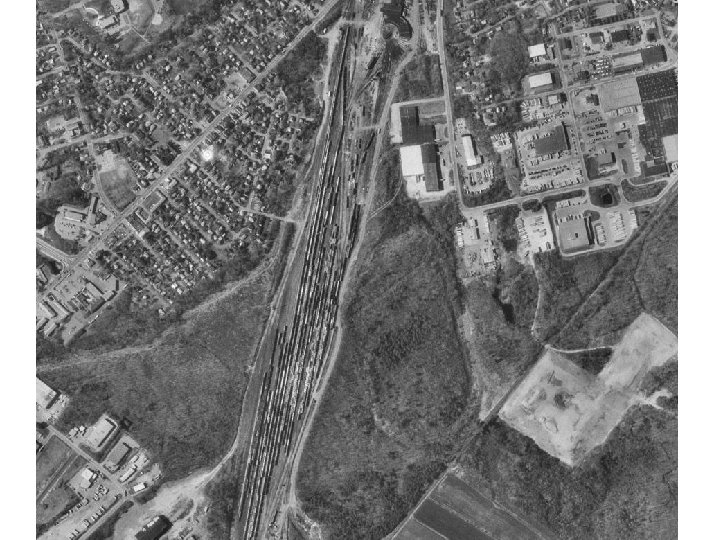
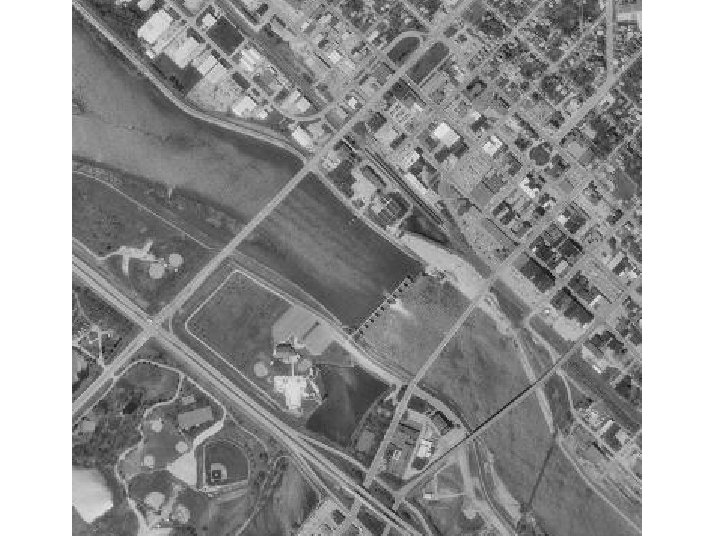
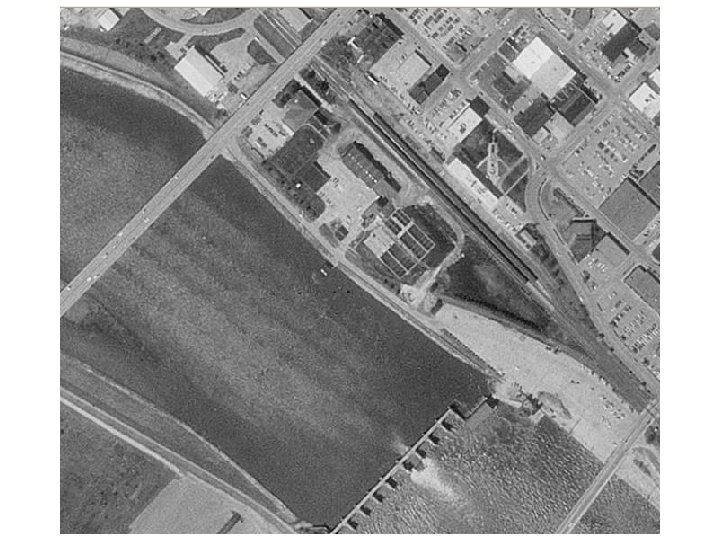
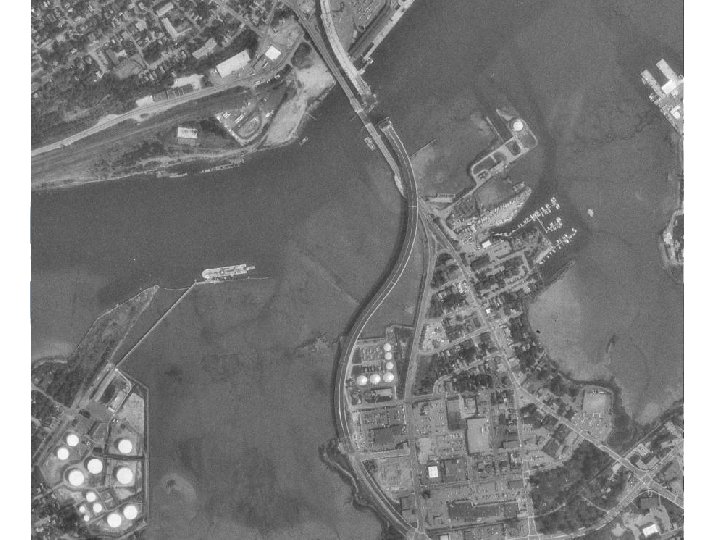
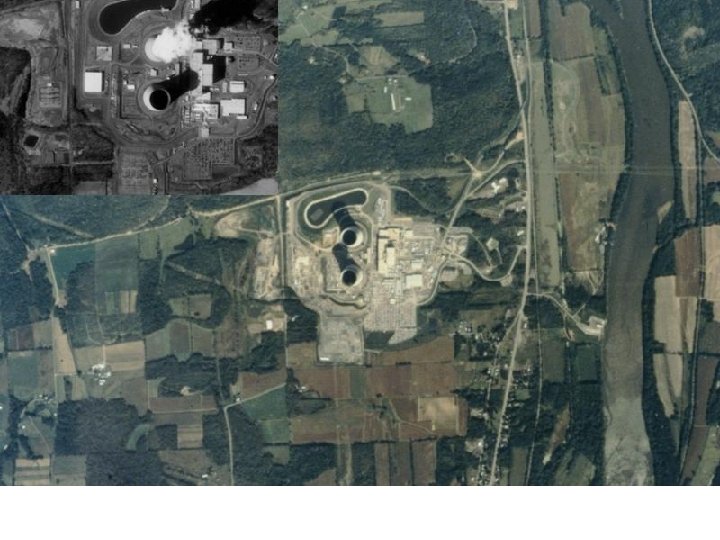
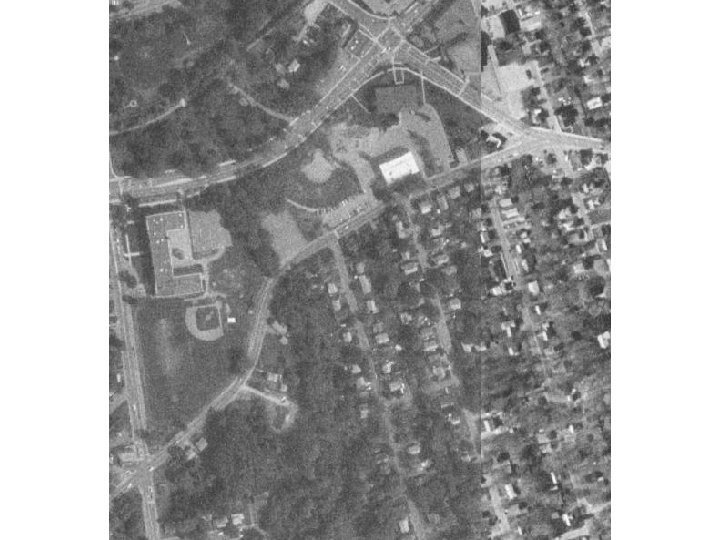
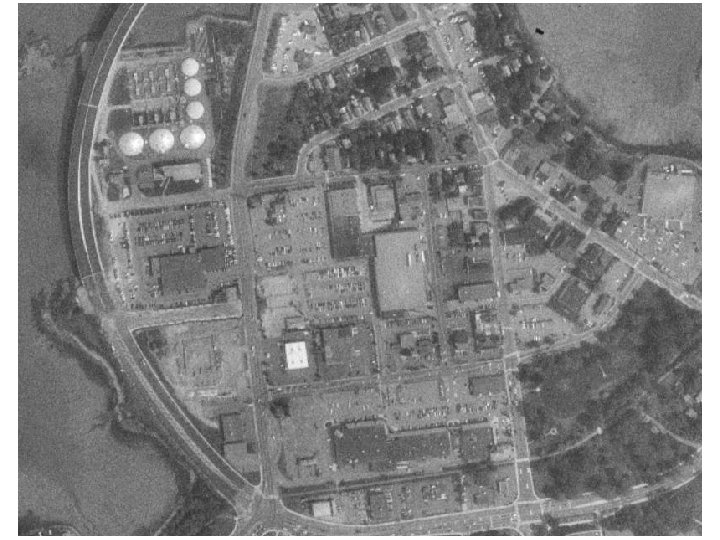
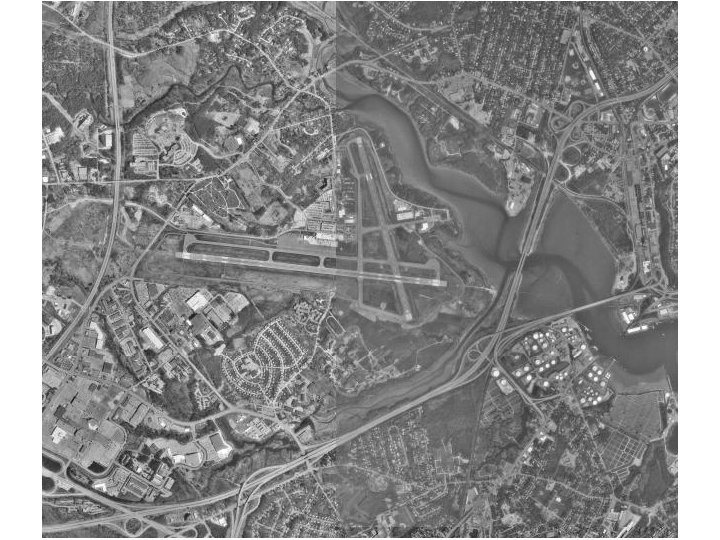
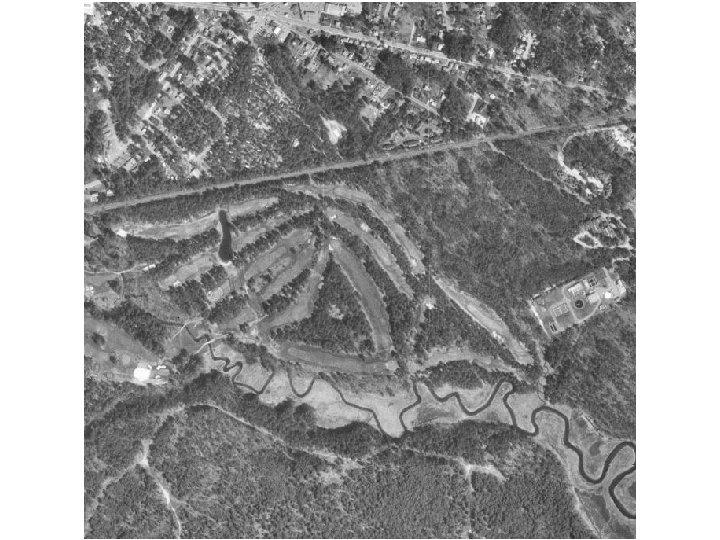
Site • Refers to a futures position with respect to topography and drainage. – Some things occupy a distinctive topographic position because of their function • Sewage treatment facilities at the lowest feasible topographic position. • Power plants located adjacent to water for cooling
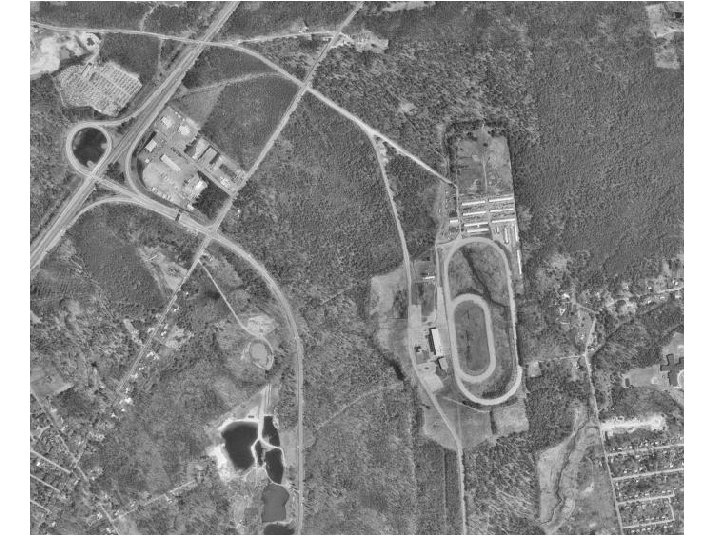
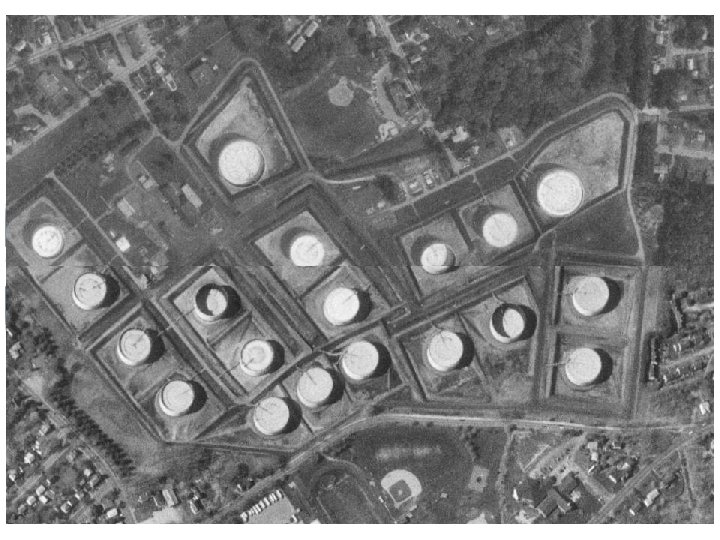
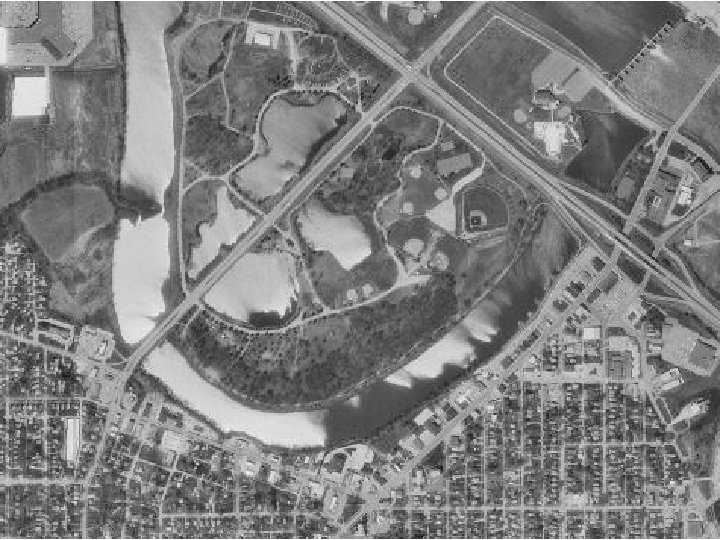
Association • Association refers to the distinctive spatial interrelationships between features – Schools often associated with athletic fields. – Large parking lots often associated with malls
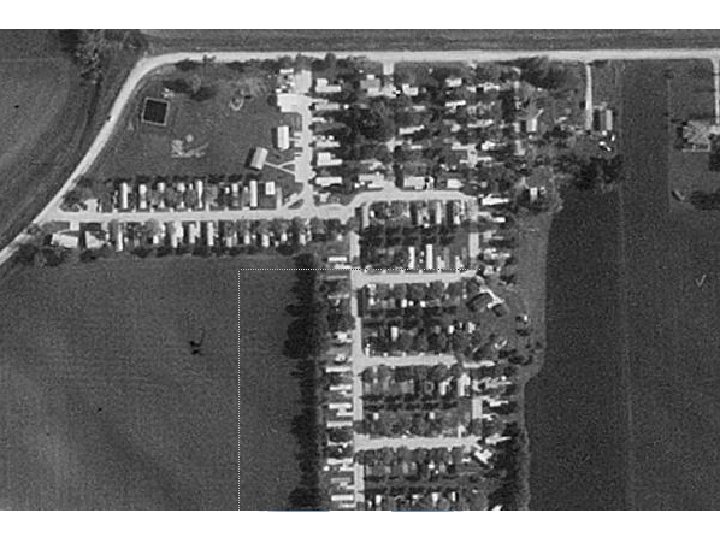
Pattern • Refers to distinctive arrangement of features – Orchards have trees plant can rows – Mobile home parks have rectangular buildings arranged in rows
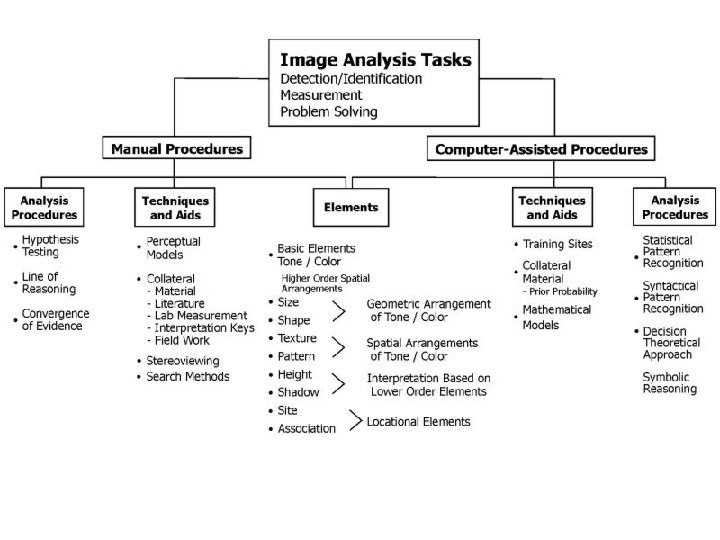
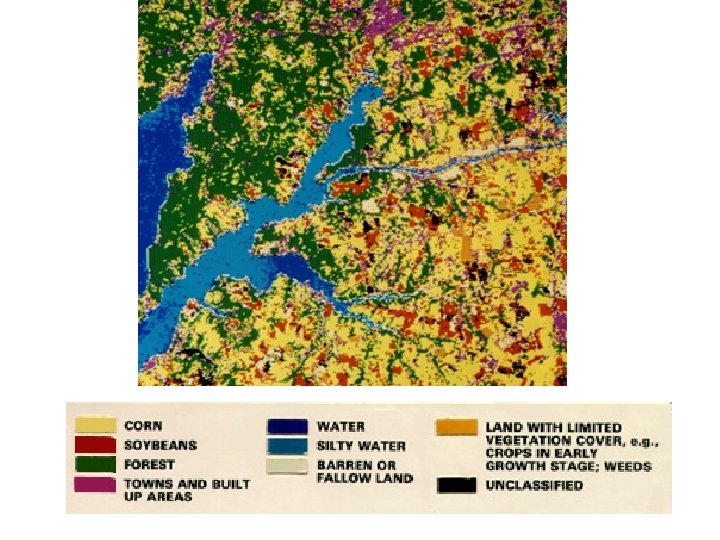
Image interpretation tasks • Classification - Assign objects to classes – Detection, recognition, identification. – Interpreter confidence is ranked as possible, probable • Enumeration - Count items • Measurement- mensuration – Uses image scale to derive measurements such as length with distance and volume • Delineation – demarcation of regions
Interpretation strategies • Field observation. – Required when the image and its relationship to ground conditions are imperfectly understood • Direct recognition. – Interpreter derives information directly from inspection of the image • Inference – Based on visible features can derive information about invisible features – Certain relationships and identify features
Interpretation strategies • Interpretive overlays. – Useful when relationships between visible patterns are used to reveal patterns not directly visible. – Soils may be revealed by relationships with vegetation patterns, slope, and drainage • Photomorphic regions – Identify regions of uniform appearance on an image. – Does not attempt to resolve individual landscape components. • Mostly used with small-scale imagery in which coarse resolutions tend to average separate components
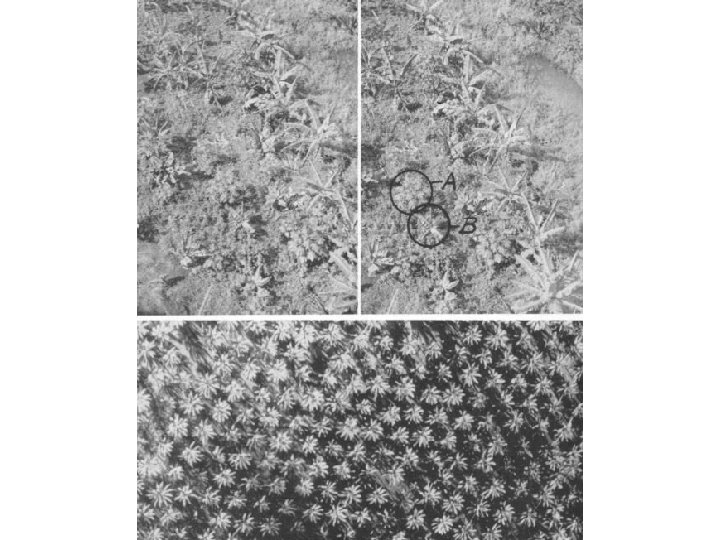
Interpretation strategies • Image interpretation keys. – Keys are reference information designed to enable rapid identification of features. – Usually a collection of annotated images or stereograms and a description, which may include sketches or diagrams
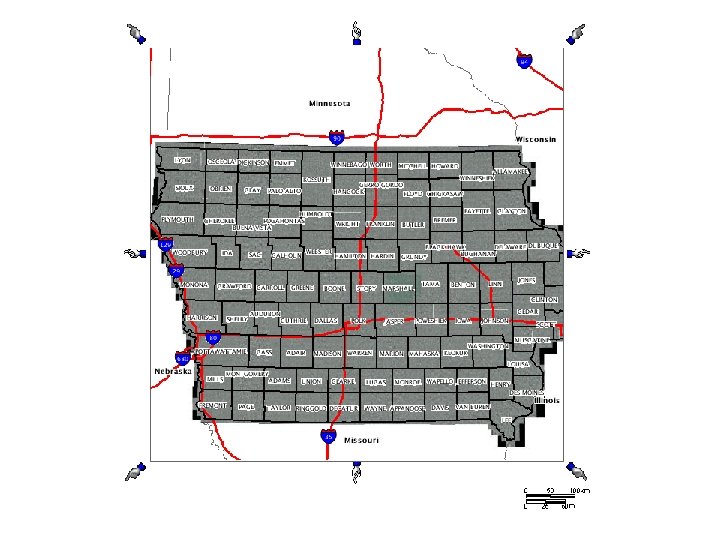
Aerial mosaics and image maps • IMAP is characterized by the planimetrically accurate representation of your surface and uses symbols to represent select features • An aerial image is not really a map because Tilton relief displacement introduced your metric errors – Its features are represented without selection or symbolization
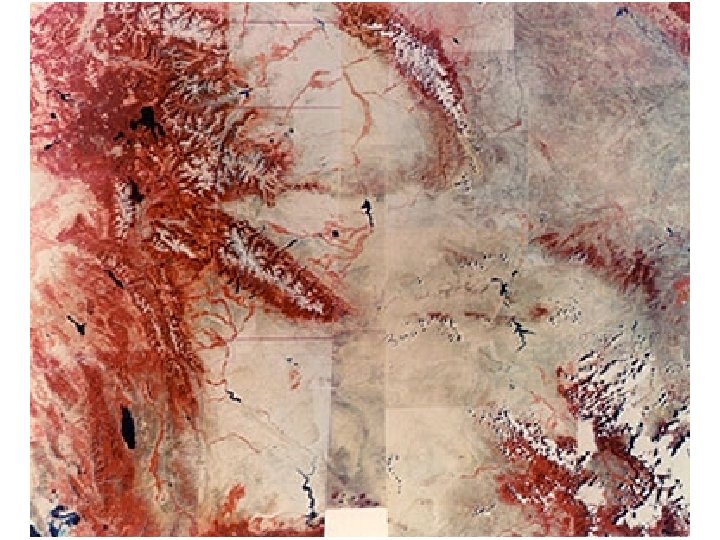
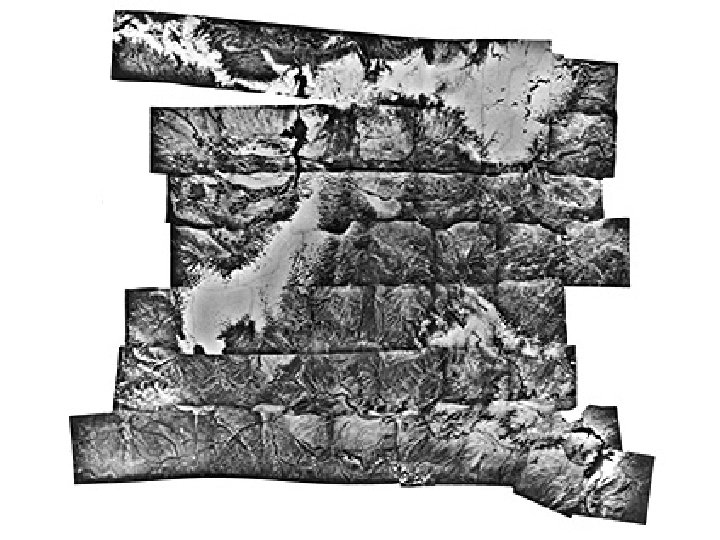
Aerial mosaics and image maps • A aerial images form the basis of useful map-like representation of the Earth’s surface such as mosaics and orthophotos • Aerial mosaics are produced by assembling adjacent aerial photographs to form a single image
Aerial mosaics and image maps • Uncontrolled mosaics performed by assembling adjacent photographs without strict concern for geometric integrity
Aerial mosaics and image maps • A controlled mosaic presents the detail of an aerial photograph in planimetrically correct position
Aerial mosaics and image maps • An aerial index is created by placing adjacent area photographs together in their approximate relative position without represent econometric relationships – These are to be used as a guide for identifying those photographs that represent an area that is needed without searching the entire collection
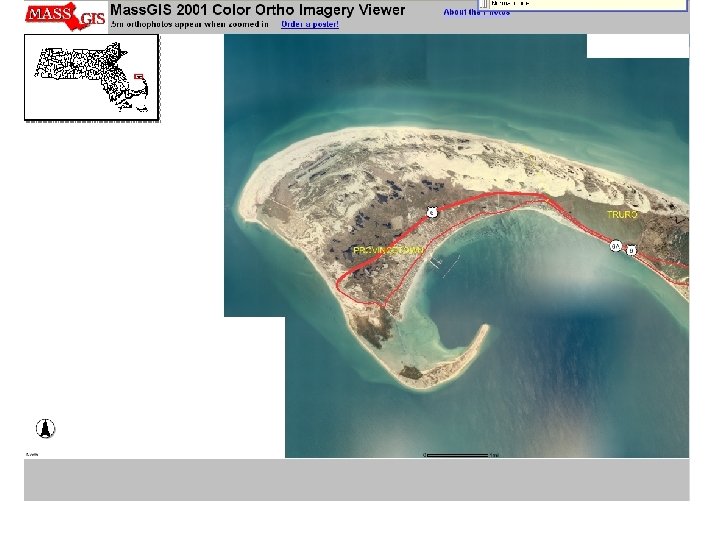
Aerial mosaics and image maps • Orthophotos are aerial photographs prepared using stereoscopic parallax and photogrammetric principles to remove the effects of relief displacement and tilt to provide a planimetrically correct aerial image
Aerial mosaics and image maps • And orthophoto quadrangle is an orthophoto that represents the same region as the USGS topographic quadrangle – These can be thought of as image maps • The digital orthophoto quadrangle (DOQ) is a digital version
Field observations and accuracy assessment • Field observations are necessary because aerial imagery is not infallible or a total source of information – The information is derived through interpretation
Field observations and accuracy assessment • Think of a map or GIS as a statement about conditions of a certain place – The more precise the statement, the more useful it is to the user • Delineate small parcels, specific labels, etc. – The less precise the statement, the less useful • The larger the parcels, more general labels, etc.
Field observations and accuracy assessment • For example, a broad area labeled as a forest – Versus • Smaller areas each individually labeled as oak, pine, and fir.
Field observations and accuracy assessment • Field data are first-hand observations collected on the ground – Often use copies of images or maps to annotate in the field • Field work can create delays, increased expense, and other difficulties – But it is essential for establishing the validity of the work
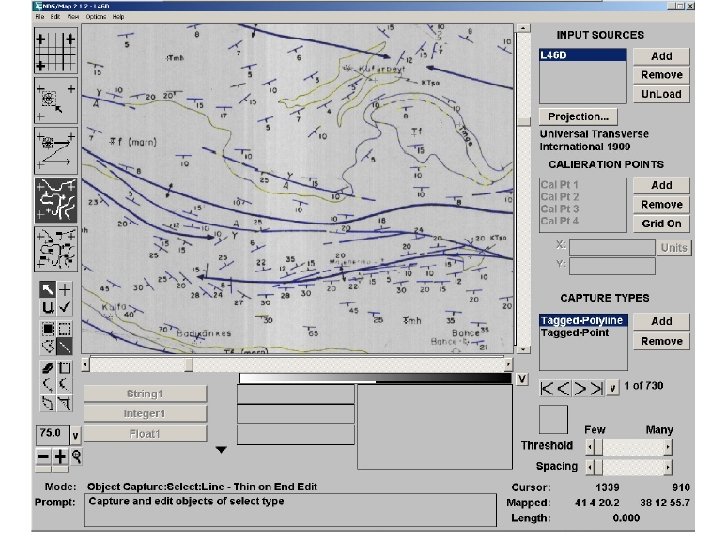
On-screen digitizing • Traditionally, photointerpreters used transparent (mylar) overlays to show outlines, mark features, and make annotations – These then had to be digitized, transferred and registered to a planimetrically correct base layer
Manual Digitizing Most common form of coordinate data input Requires a digitizing table – Ranging in size (25 x 25 cm to 150 x 200 cm) • Ideally the map should be flat and not torn or folded • Cost: hundreds (300) to thousands (5000)
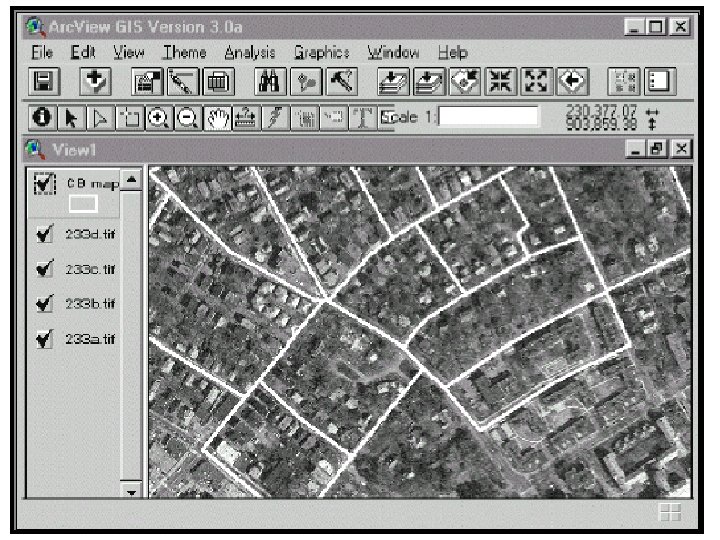
On-screen digitizing • In digital imagery it requires taking a raster image and putting a drawing a vector layer on top of it. – This all can be saved as one file – Can then be transferred directly to a GIS • This is called heads-up digitizing
Heads-Up Digitizing II • Raster-scanned image on the computer screen • Operator follows lines on-screen in vector mode
Digitizing Errors • Undershoots • Dangles • Spurious Polygons
On-screen digitizing • Not inherently difficult • Requires consistency and attention to detail • Can be challenging – Edges can be difficult to identify – Shadows – Low image contrast
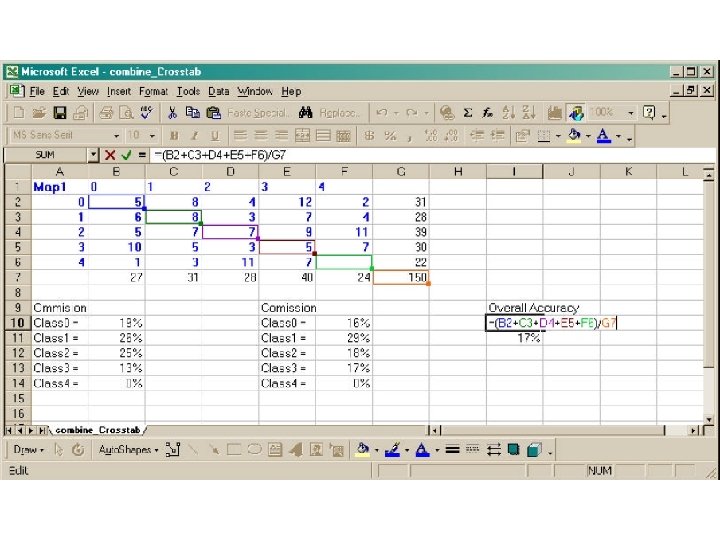
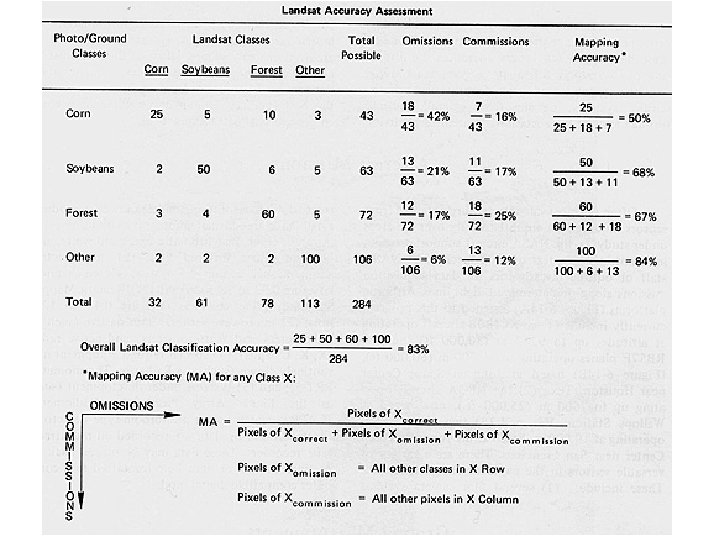
Accuracy Assessment • Procedures well established to evaluate the accuracy of interpretation – For maps with polygons of specific types, an overall map accuracy and individual class accuracies can be determined • Requires a set of reference data points that have known characteristics – Ideally should be random – That may miss some categories, so, often random selection combined with collecting across all classes and across the entire study area
Accuracy Assessment • Should keep field collected data for input separate from, field data used for accuracy assessment • Assessment is a table called the error matrix – Each reference point and its matching map label are compared
The kappa statistic • There are so many values in the error matrix that it becomes confusing to people. – Want a single number that encapsulates the significance of the error matrix. – This is the kappa (κ) statistic • Difference between the observed agreement reported by the diagonal and the agreement that might be due solely to chance
The kappa statistic • Kappa is estimated by k hat • Observed = accuracy reported in error matrix – Sum correct / total • Expected = correct classification due to chance
The kappa statistic • The statistic adjusts the percentage correct by subtracting the estimated contribution of chance agreement – A κ=0. 83 means that the classification is 83% better than would be expected from chance assignment of pixels to categories – Kappa ranges between +1 and -1
Interpretation Equipment • Paper prints or transparencies • Magnification • Flatbed scanners – Dpi – up to about 3500 • Light tables • Densitometers • Stereo imagery equipment