Visual EDF Software to Check the Normality Assumption

: l Our")
 Depressio n Difference Depressio n (Placebo) Beats Difference (Caffeine) (Placebo)")


- Slides: 16
Visual EDF Software to Check the Normality Assumption Dr. Maria E. Calzada Dr. Stephen M. Scariano Loyola University New Orleans Calzada@loyno. edu http: //www. loyno. edu/~calzada
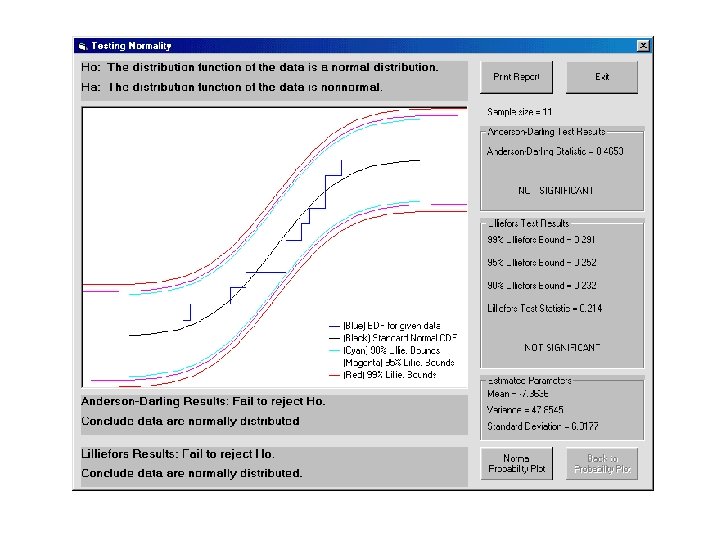
Problem 7. 11 of Moore’s the Basic Practice of Statistics reads (paraphrased): l Our subjects are 11 people diagnosed as being dependent on caffeine. Each subject was barred from coffee, colas, and other substances containing caffeine. Instead they took capsules containing their normal caffeine intake. During a different time period, they took placebo capsules… Table 7. 3 contains data on two of several tests given to the subjects. “Depression” is the score of the Beck Depression inventory. Higher scores show more symptoms of depression. “Beats” is the beats per minute the subject achieved when asked to press a button 200 times as quickly as possible. We are interested in whether being deprived of caffeine affects these outcomes. l
Subject Depressio n (Caffeine) Depressio n Difference Depressio n (Placebo) Beats Difference (Caffeine) (Placebo) Beats 1 5 16 -11 281 201 80 2 5 23 -18 284 262 22 3 4 5 -1 300 283 17 4 3 7 -4 421 290 131 5 8 14 -6 240 259 -19 6 5 24 -19 294 291 3 7 0 6 -6 377 354 23 8 0 3 -3 345 346 -1 9 2 15 -13 303 283 20 10 11 12 -1 340 391 -51 11 1 0 1 408 411 -3
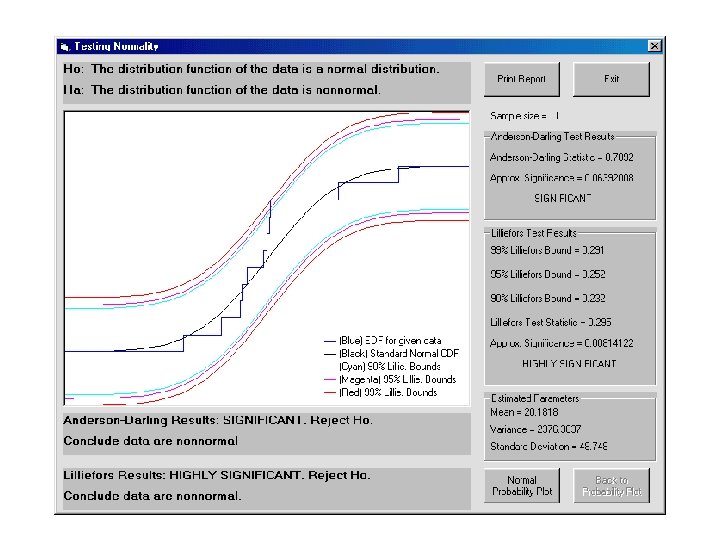
l Does this matched pairs study give evidence that being deprived of caffeine raises depression scores? Check that the differences are not strikingly nonnormal. l Now check the differences in beats per minute with and without caffeine. You should hesitate to use the t procedures on these data. Why?
Histogram of the difference in depression scores, as given by SPSS. Are these data normal?
Histogram of the difference in Beats score. Are these data normal?
Normal probability plot for difference in depression data
Normal probability plot for difference in beats data
l While slight departures from normality are usually inconsequential, substantive departures from normality can seriously impair the validity of statistical procedures framed under the “Normality Assumption. ” l The problem is: How can we help our students distinguish between “slight departures” and “substantive departures” from normality.
EDF TESTS FOR NORMALITY l We have written a Visual Basic Program that implements the Lilliefors test for normality and the Anderson-Darling Test for normality. l We like the visual aspects of the Lilliefors test. l We like the power of the Anderson-Darling Test.
Lilliefors Test We compute the distances between the data’s Empirical Distribution Function and the Cumulative Standard Normal Distribution. l If these distances are “not too large” we do not have evidence to reject the “Normality Assumption. ” l Upper- percentiles for the largest distance have been tabulated using Monte-Carlo Simulations. l
Anderson-Darling Test l Based on the accumulating square distance function l Usually l Our program implements the discrete Anderson. Darling test statistic developed by Stephens (1974) to approximate
Conclusions l The Anderson-Darling and Lilliefors tests are important tools that should be routinely used alongside probability plots to check the normality assumption. l The stand-alone desktop program enhances the craft of exploratory data analysis. l Program is available for downloading at http: //www. loyno. edu/~calzada
Some References David S. Moore. The Basic Practice of Statistics, Second Edition. Freeman, 2000. l H. Lilliefors(1969). “On the Kolmogorov-Smirnov Test for Normality with Mean and Variance Unknown. ” Journal of the American Statistical Association 64, pp. 387 -389. l M. A. Stephens (1974). “EDF Statistics for Goodness of Fit and Some Comparisons. ” Journal of the American Statistical Association 69, pp. 730 -737. l