Visual Basic Debugging Tools Appendix D 972021 Dr
Visual Basic Debugging Tools Appendix D 9/7/2021 Dr. Monther Aldwairi 1
Outline • Debugging strategies • Error Types – Compile, Run-Time and Logical errors • VB Debugger – Breakpoints, watches and stepping through • Error Trapping • Common Errors 9/7/2021 Dr. Monther Aldwairi 2
Debugging • Errors in a program are called bugs • The process of finding and correcting them is called debugging • Debugging aims at eliminating or reducing the number of bugs in a program, thus making it behave as expected. 9/7/2021 Dr. Monther Aldwairi 3
Debugging strategies • Tracing – Putting print statement in the code to verify flow and variable values during execution – Remove print statements after the error is detected • Logfile – Text file to which a debugging trace is written – Debuggers read the log file (GDB for example) • Error Trapping and Handling – Used to trap fatal errors 9/7/2021 Dr. Monther Aldwairi 4
Preferable Debug Method • Use a debugger! • Allows you to pause during execution in order to view or alter variables 1. Setting breakpoints (to suspend program execution) 2. Defining watch values (to see current value of variables 3. Stepping into a program (executing one instruction at a time) 9/7/2021 Dr. Monther Aldwairi 5
Error Types • Compiler Errors – Syntactic, or compilation, errors occur when VB commands are written improperly. • Run-time errors – An application attempts to perform an action that the system cannot execute • Logical errors – Caused by faulty program logic. 9/7/2021 Dr. Monther Aldwairi 6
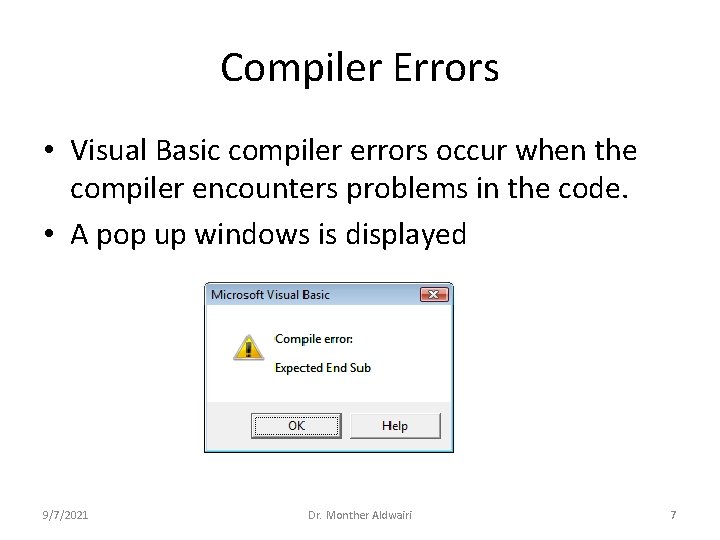
Compiler Errors • Visual Basic compiler errors occur when the compiler encounters problems in the code. • A pop up windows is displayed 9/7/2021 Dr. Monther Aldwairi 7
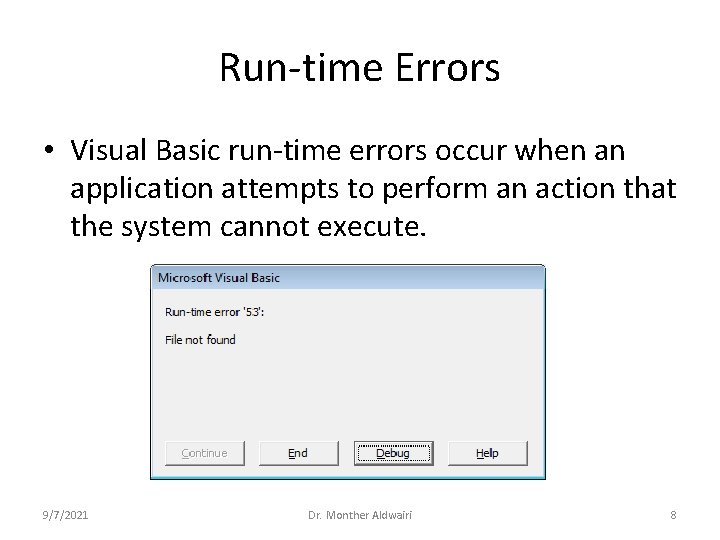
Run-time Errors • Visual Basic run-time errors occur when an application attempts to perform an action that the system cannot execute. 9/7/2021 Dr. Monther Aldwairi 8
Logical Errors • The program compiles and runs fine • The program does not give the expected output • General debugging strategy: 1. Place breakpoint near (preferably, slightly ahead) of suspected error source. 2. Execute program in normal fashion, until breakpoint is encountered. 3. Define or more watch values and step through the program, one instruction at a time. 4. Follow watch values to identify location, and possibly, source, of error. 9/7/2021 Dr. Monther Aldwairi 9
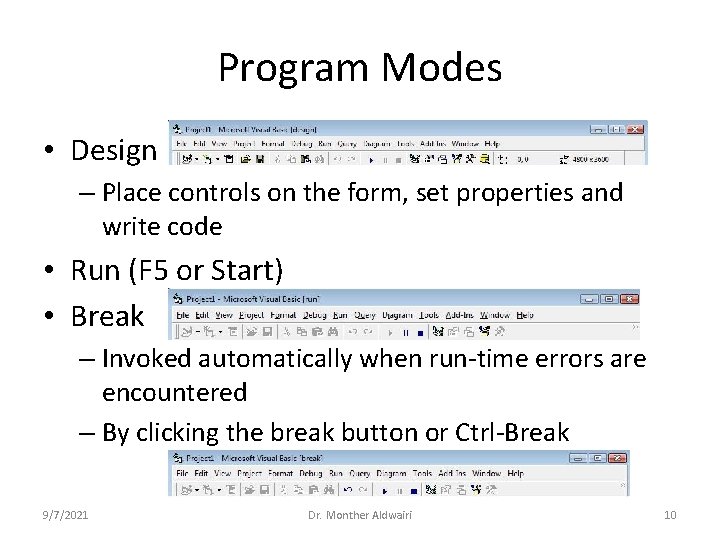
Program Modes • Design – Place controls on the form, set properties and write code • Run (F 5 or Start) • Break – Invoked automatically when run-time errors are encountered – By clicking the break button or Ctrl-Break 9/7/2021 Dr. Monther Aldwairi 10
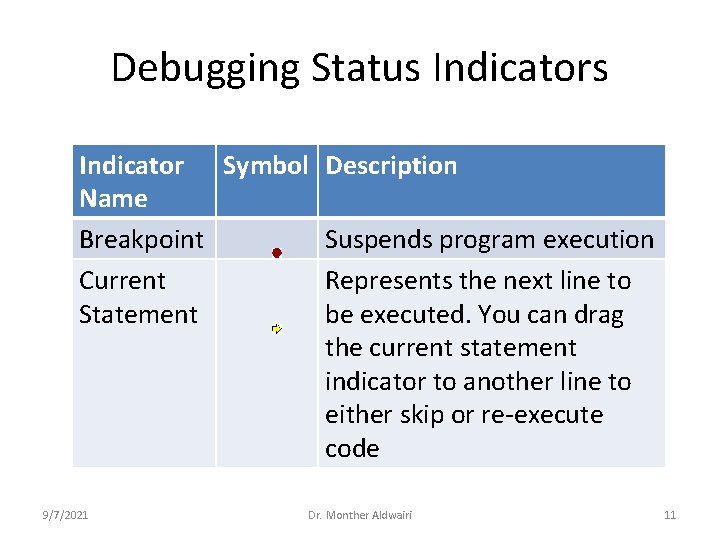
Debugging Status Indicator Symbol Description Name Breakpoint Suspends program execution Current Represents the next line to Statement be executed. You can drag the current statement indicator to another line to either skip or re-execute code 9/7/2021 Dr. Monther Aldwairi 11
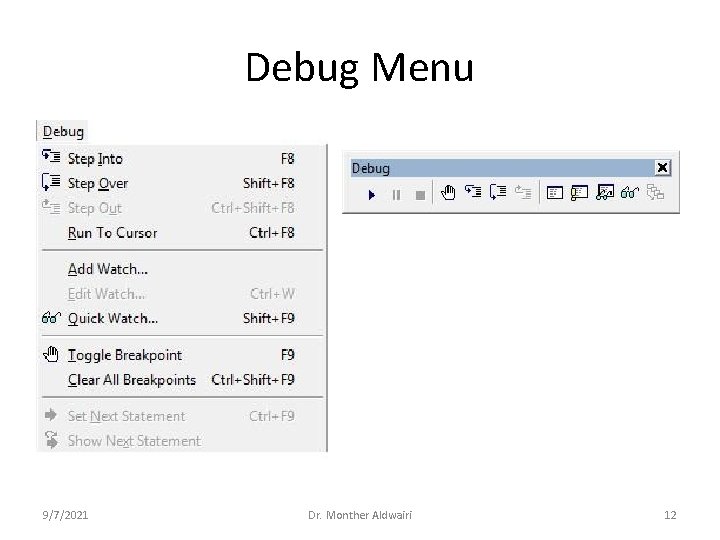
Debug Menu 9/7/2021 Dr. Monther Aldwairi 12
Breakpoints • Select statement, or click anywhere within statement, and set breakpoint: 1. Select Toggle Breakpoint from the Debug menu, or 2. Click on the Toggle Breakpoint button within the Debug toolbar, or 3. Press function key F 9. • A dark red point to the left of a statement indicates the existence of a breakpoint. • The break in the program occurs just before the selected statement is executed. 9/7/2021 Dr. Monther Aldwairi 13
Breakpoints • To remove breakpoint use one of the three possibilities listed earlier to set a breakpoint. – To remove all break points select Clear All Breakpoints from the Debug menu, or use Ctrl. Shift-F 9 • Temporary breakpoint: click within a statement, select Run to Cursor from the Debug menu, or use Ctrl-F 8. 9/7/2021 Dr. Monther Aldwairi 14
Defining watch values • Watch values are the current values of variables or expressions • There are two types of watch values: 1. Ordinary watch values: remain active as you step through the program 2. Break watches: The cause a break when True or when the values changes 9/7/2021 Dr. Monther Aldwairi 15
To define watch values 1. Select Add Watch, from the Debug menu, and enter information in the Add Watch dialog box. 2. Right-click on the Watches window, select Add Watch. 3. Highlight an expression in the Code Editor window, and select Add Watch, from the Debug menu. 4. Highlight an expression in the Code Editor window. Then, right-click and select Add Watch. 5. Shift+F 9 for quick watches 9/7/2021 Dr. Monther Aldwairi 16
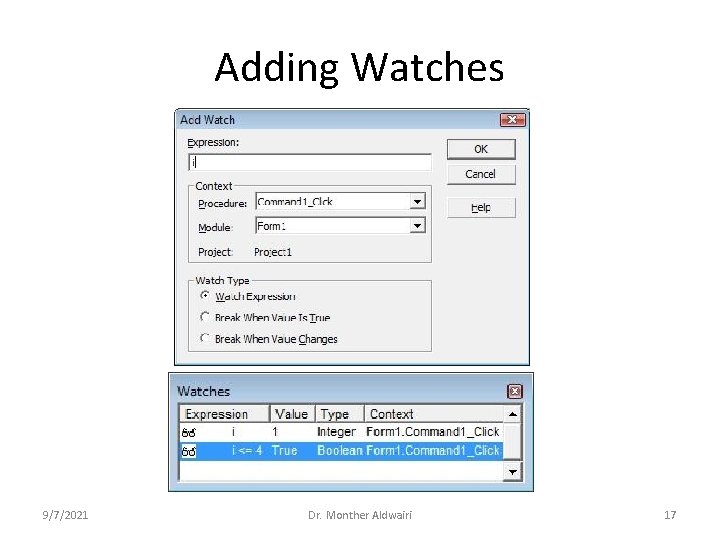
Adding Watches 9/7/2021 Dr. Monther Aldwairi 17
Stepping through a program • Three different types of stepping: 1. Step Into results in line-by-line stepping of current procedure and subordinated procedures. 2. Step Over results in line-by-line stepping of current procedure, bypassing subordinated procedures. 3. Step Out results in execution of all remaining statements within the current procedure, and then pauses at the first statement following the procedure access in the parent routine. • Note procedures will be discussed later in CH 4 9/7/2021 Dr. Monther Aldwairi 18
Stepping through a program • To carry out line-by-line stepping do one of the following: 1. Select Step Into (or Step Over, Step Out) from the Debug menu 2. Press F 8 to Step Into, Shift+F 8 to Step Over, Ctrl+Shift+F 8 to Step Out 3. Click on the Step Into button (or Step Over or Step Out button) on the Debug toolbar 9/7/2021 Dr. Monther Aldwairi 19
Error Trapping • We will teach you later in Chapter 8 how to trap and handle fatal errors 9/7/2021 Dr. Monther Aldwairi 20
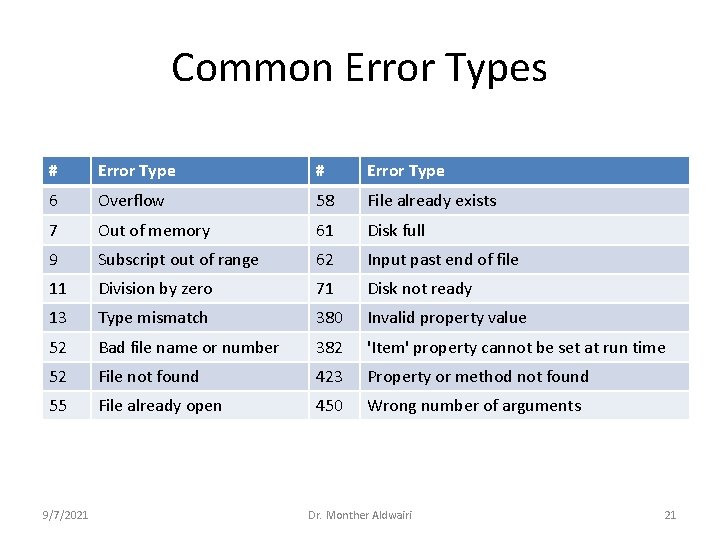
Common Error Types # Error Type 6 Overflow 58 File already exists 7 Out of memory 61 Disk full 9 Subscript out of range 62 Input past end of file 11 Division by zero 71 Disk not ready 13 Type mismatch 380 Invalid property value 52 Bad file name or number 382 'Item' property cannot be set at run time 52 File not found 423 Property or method not found 55 File already open 450 Wrong number of arguments 9/7/2021 Dr. Monther Aldwairi 21
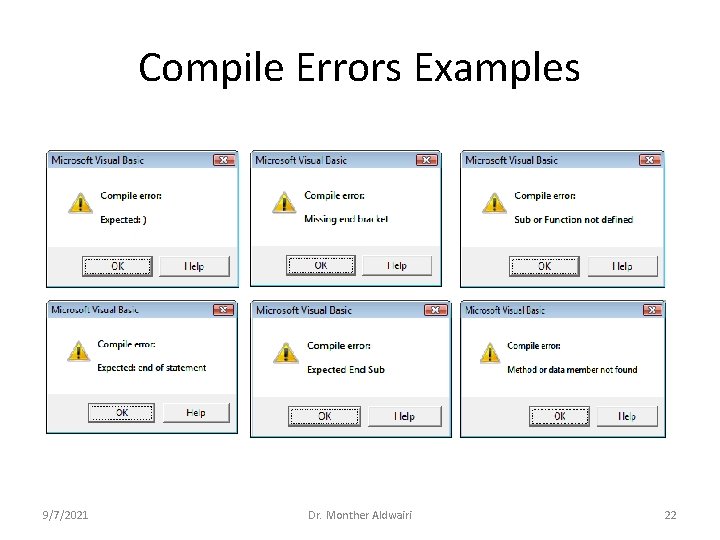
Compile Errors Examples 9/7/2021 Dr. Monther Aldwairi 22
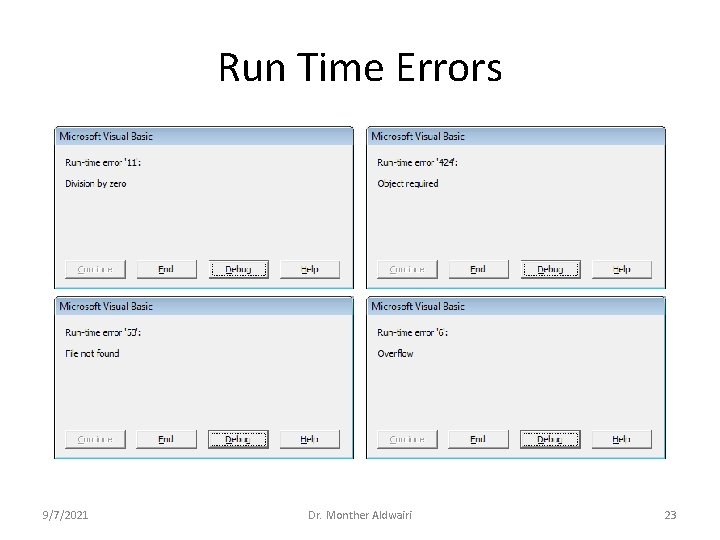
Run Time Errors 9/7/2021 Dr. Monther Aldwairi 23
- Slides: 23