Vision Every child in every district receives the


 Time")


 • Installation (Sustainability) • Initial Implementation • Full")


 Matters… At or Above Benchmark Below Well Below Benchmark Average")
 Too At or Above Benchmark Below Well Below Benchmark")


- Slides: 52
Vision: Every child in every district receives the instruction that they need and deserve…every day. ORTIi: A Framework for Delivering on the Promise of Reaching and Teaching ALL Students David Putnam, Jr. , Ph. D. , Director, ORTIi Annual Conference, Eugene, April 2018
Targets for Today’s Session • Why is RTI important? • Lessons learned and guiding principals • Overview of the essential components of a comprehensive and healthy RTI system • Implementation framework for RTI • Outcome data highlighting predictors of success • Opportunities to access ORTIi support
Why is RTI Important? We have a LITERACY CRISIS!
We’ve Learned… The most impactful thing we can do for ALL students, including economically disadvantaged, English Learners, and students of color is to… teach them to read!
Teaching Reading is Both Essential and Urgent! • “Students who can’t read are doomed to a life of less. ” (Rob Saxton, previous superintendent, TTSD) • Assuming students will ‘catch up’ with practice as usual is not wise. Catching up is a low probability occurrence. • Improving outcomes for struggling students will require a very different kind of effort in both the short and long run.
Differences Learning to Read Estimates from National Institute of Child Health and Human Development Population % Journey to Reading Instructional Requirements 5 Easy: children read before starting school Need no formal decoding instruction 35 Relatively Easy Learn to read regardless of instructional approach 40 Formidable Challenge Need systematic and explicit instruction 20 One of the most difficult tasks to be mastered in school Need intensive, systematic, direct, explicit instruction
We Know What Works Effective teaching variables Effect size Other variables Effect size Student expectations +1. 44 Socioeconomic Status +0. 57 Response to Intervention +1. 07 Parental Involvement +0. 51 +0. 90 Computer based instruction +0. 75 School Finances +0. 37 +0. 23 Reciprocal Teaching Aptitude by Treatment +0. 74 Interactions* +0. 19 Feedback +0. 73 Family Structure +0. 17 Teacher-Student Relationships +0. 72 Retention -0. 16 Formative Evaluation Teacher Clarity John Hattie, Visible Learning for Teachers, 2012
RTI, when implemented well. . • Increased student achievement (Marston, Muyskens, Lau, & Canter, 2003) • Improved proportionality or indicators of equity • Earlier delivery of special education services • Lower rates of SLD (Burns, Appleton, & Stehouwer, 2005), A. M. Van. Derheyden & M. K. Burns (2010)
Lessons Learned and Guiding Principles
Our Vision “Every child in every district receives the instruction that they need and deserve… every day”
Our Mission Cultivate thinking and skills in leadership at all levels to build and sustain a comprehensive multi-level system of prevention and support that identifies and serves the instructional needs of all children INTERNAL CAPACITY SELF-SUSTAINING
ORTIi A Brief History of (ORTIi) Time
Oregon RTI Project Growth & Lessons Learned TTSD Prior to Contract with ODE: Implementing PBIS District Wide Installing RTI for ALL and SLD Working with ODE on Policy and Procedures
Cadre 1: 20052006 Tigard. Tualatin Pendleton Sherida n Ont ario Roseburg # of Districts: 4 % of Oregon Student Population 0% 4. 7% 50% 100%
Cadre 2: 20062007 North Clackamas Hood River Ione Canby Crow. Applegate. Lorane Pilot Rock Bethel # of Districts: 13 Lowell Nyssa % of Oregon Student Population 0% 10. 8% 50% 100%
Cadre 3: 20072008 Astoria Sherwood Nestucc a Valley Scio Grants Pass # of Districts: 18 Baker % of Oregon Student Population 0% 13. 8% 50% 100%
Cadre 4: 20082009 Seasid e Leadership Matters…. Most!!! Hermiston Fern Ridge Central Curry # of Districts: 22 % of Oregon Student Population 0% 15. 5% 50% 100%
Cadre 5: 2009 Knappa 2010 Its all about the Core! Cascade Springfield North Bend # of Districts: 28 Crook Bend- Count La. Pine y % of Oregon Student Population 0% 21. 5% 50% 100%
Cadre 6: 20102011 Go Slow to Go Fast Parkros e* Gresham. Barlow* Estacad a Lebano n Sweet Sister Home s Bandon Glendal e Central Point # of Districts: 37 % of Oregon Student Population 0% 27. 6% 50% 100%
Cadre 7: 2011 -2012 20112012 St. Why & How Before What Helens. David Douglas Junctio n City Yoncalla North Lake Klamath County # of Districts: 45 Paisley Lake Count y % of Oregon Student Population 0% 31. 9% 50% 100%
Cadre 8: 2012 -2013 2012 PL Clatskanie* 2013 & Transfer of Knowledge Morrow Forest Grove North Powde r North Marion Mitchell Mc. Kenzie* John Day Reedsport Butte Falls # of Districts: 55 % of Oregon Student Population 0% 34. 1% 50% 100%
Cadre 9: 20132014 Distributed Practice: Repeated Training Rainer Gladston e Mapleto n Coquille Harney County Sutherlin Port Orford Brookings. Harbour # of Districts: 63 % of Oregon Student *Projected Population* 0% 35. 6% 50% 100%
Cadre 9. 2: 20132014 Clatskani e Jewel l Milton-Freewater North Wasco TTSD BLSD RSD OSD Creswel l Eagl e Point Plus h Adel Three Rivers # of Districts: 72 Klamath Falls City % of Oregon Student *Projected Population* 0% 38. 9% 50% 100%
School Culture and Scappoos Culturally Responsive Practices e Cadre 10: 20142015 Neah-Kah. Nie Gaston Monroe Parkrose TTSD Mollala River Jefferson County Jefferso n. Alban Pine-Eagle y Marcola BLSD RSD OSD Mc. Kenzi e Pinehur st # of Districts: 84 % of Oregon Student *Projected Population* 0% 42. 5% 50% Harney ESD Crane Diamond Double O Drewsey Frenchglen Pine Creek South Harney Suntex 100%
Cadre 10: 20142015 Neah-Kah. Nie Gaston Monroe Jefferso n. Alban y Marcola RSD Scappoos e Mollala River Parkrose TTSD Jefferson County Middle School: • Seaside • Sisters BLSD Mc. Kenzi • Sutherlin e • Sweet Home Pinehur st # of Districts: 89 % of Oregon Student *Projected Population* 0% Pine-Eagle OSD 42. 5% 50% Harney ESD Crane Diamond Double O Drewsey Frenchglen Pine Creek South Harney Suntex 100%
Cadre 10: 20152016 Neah-Kah. Nie Gaston Monroe Jefferso n. Alban y Marcola RSD Scappoos e Mollala River Parkrose TTSD Jefferson County Math: • Baker • Bethel BLSD Mc. Kenzi • Crook County e • Grants Pass • N. Clackamas Pinehur st # of Districts: 91 % of Oregon Student *Projected Population* 0% Pine-Eagle OSD 42. 5% 50% Harney ESD Crane Diamond Double O Drewsey Frenchglen Pine Creek South Harney Suntex 100%
Cadre 11: 20172018 Vernonia Newberg Yamhill-Carlton St Paul EBP + PL + Public Practice = “Secret Sauce” Oregon Trail Dufur TTSD Wallowa Sherman Co. Salem. Philomath Keizer Prairie City BLS OSD South RSD Umpqua # of Districts: 103 % of Oregon Student *Projected Population* 0% 51. 5% 50% 100%
Overview of ORTIi Essential Components
9 Clear Vision of Learning for ALL ORTIi Essential Components SLD Decision Making Core Initial and Progress Monitoring Ongoing Intervention PD Placement Interventions Ongoing BIT Meets Intervention Coaching Regularly Review Observe & Principal Universal Screening Actionable Decision Attends Feedback Rules RTICore Materials and Instruction Meetings Leadership Growth Mindset & High Expectations For ALL Students Review Teaming & DBDM Culture Professional Learning Culture of Collaboration to Improve Outcomes
Implementation Framework for RTI
Students CAN NOT benefit from interventions they DO NOT receive! Rob Horner, circa 2010
Implementation Takes Time • Exploration (Sustainability) • Installation (Sustainability) • Initial Implementation • Full Implementation (Effectiveness & Sustainability) 2– 4 Years 4 -5 Fixsen, Naoom, Blase, Friedman, & Wallace, 2005
Install, Implement, Refine Year 1 Why & How Year 2 Culture Leadership, DBDM, PL TIER 1 Core Program Univ. Screen TIER 2/3 SPED Core Rev Mtg Interventions X Int. Place Mtg X Prog. Mon. X Int. Rev. Mtg. X IPS/SLD X X Year 3 Year 4
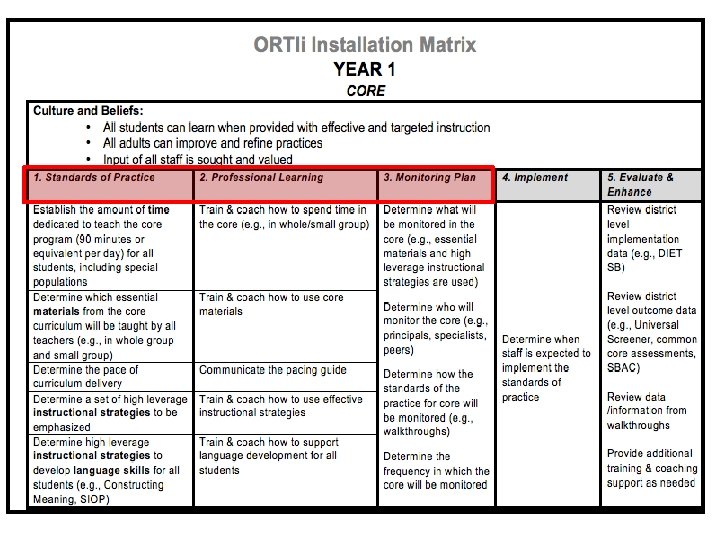
How can you improve strategic planning for RTI? Standards of Practice Professional Learning Monitoring Implementation
How can you improve strategic planning for RTI? Standards of Practice Professional Learning Monitoring Implementation
Standards of Practice Example
How can you improve strategic planning for RTI? Standards of Practice Professional Learning Monitoring Implementation
Professional Learning for RTI • Goal – To teach and support staff to consistently and fluently use the skills necessary to implement RTI • Effective instruction • Assessment • Data based decision making Trainings Coachin g PLCs Peer observation
How can you improve strategic planning for RTI? Standards of Practice Professional Learning Monitoring Implementation
Monitoring for RTI • Goal – To determine if staff is consistently and fluently using the practices that been have agreed upon and taught – To identify a plan to provide additional support as needed Principal walkthroughs Learning Walks Instructional rounds Self Monitoring
How can you improve strategic planning for RTI? Standards of Practice Professional Learning Monitoring Implementation
Outcome Data …or the proof is in the pudding! • • Overall achievement Outcomes vis a vis implementation Reduced disproportionality More accurate SLD identification
1 -year Change in Percentage of 1 st – 3 rd Graders at Low Risk: (By district, 2015 -2016) 35% 22 out of 28 (79%) of active ORTIi districts increased the percentage of 1 st – 3 rd graders identified as proficient readers on universal screening measures 31% 30% 25% 20% 15% 10% 5% 0% -5% -10% 23% 18% 17% 16% 13% 12% 11% 11% 10% 10% 8% 7% 7% 7% 6% 5% 3% 2% 0% -1% -2% -3% -7%
1 -year Change in Percentage of 1 st – 3 rd Graders at High Risk: (By district, 20152016) 10% 5% 5% 1% 2% 2% 3% 0% -5% -10% -15% -20% -25% -30% -10% -9% -9% -10% -15% -16% -17% -19% -25% -3% -3% -4% -2% -7% -8% 23 out of 28 (82%) of active ORTIi districts decreased the percentage of 1 st – 3 rd graders identified as high risk for reading difficulties on universal screening measures
Quality of RTI Implementation Matters At or Above Benchmark Below Well Below Benchmark Average % of 1 st – 3 rd Graders in each DIBELS Next Benchmark Category (SPRING 100% 2016) 90% 80% 70% 60% 50% 40% 30% 20% 10% 0% 21% 14% 31% 65% 54% Schools with DIET-SB 2 Over 85% STRONG RTI 15% Schools with DIET-SB 2 Under 70% DEVELOPING RTI
School Culture (The WHY) Matters… At or Above Benchmark Below Well Below Benchmark Average % of 1 st – 3 rd Graders in each DIBELS Next Benchmark Category (SPRING 100% 2016) 90% 80% 70% 60% 50% 40% 30% 20% 10% 0% 20% 12% 33% 16% 68% Schools with Culture Over 90% STRONG Culture 51% Schools Culture Underwith 70% DEVELOPING Culture
… AND Leadership (The HOW) Too At or Above Benchmark Below Well Below Benchmark Average % of 1 st – 3 rd Graders in each DIBELS Next Benchmark Category (SPRING 100% 2016) 90% 80% 70% 60% 50% 40% 30% 20% 10% 0% 19% 12% 35% 15% 69% 50% Schools STRONG Schools DEVELOPING L andwith C Over 90% L andwith C Under 70% Culture AND Leadership
Opportunities to Access ORTIi Support
ORTIi: Fast Forward 2017 -18: Start a new 3 -year cycle • New Elem. Literacy Cadre Started August, 2017 – 4 years • New Elem. Math Cadre Starts August, 2018 – 2 years • New MS Literacy Cadre Starts August, 2018 – 3 years
Informal Opportunities • • www. oregonrti. org Selected trainings Annual Conference One-time brief assessment and consultation
You are not alone in this work! • http: //www. oregonrti. org/ – ORTIi • http: //www. intensiveintervention. org/ – National Center on Intensive Intervention • http: //www. rtinetwork. org/ – RTI Action Network