Vision Every child in every district receives the


- Slides: 15
Vision: Every child in every district receives the instruction that they need and deserve…every day. Examining Your Disaggregated Screening Data DIBELS Next University of Oregon Website
• This webinar will show you which reports you can use in your DIBELS database to look at your screening data disaggregated by subgroup (for example): – White Students – Latino/Hispanic Students – Black Students – English Language Learners – Students receiving Special Education – Economically Disadvantaged Students
data: Importing your Demographic Datagetting your • If you need assistance demographic data inputted into your DIBELS database: – Refer to DIBELS technical support • support@dibels. uoregon. edu • 1 -888 -497 -4290 OR – Contact your ORTIi coach
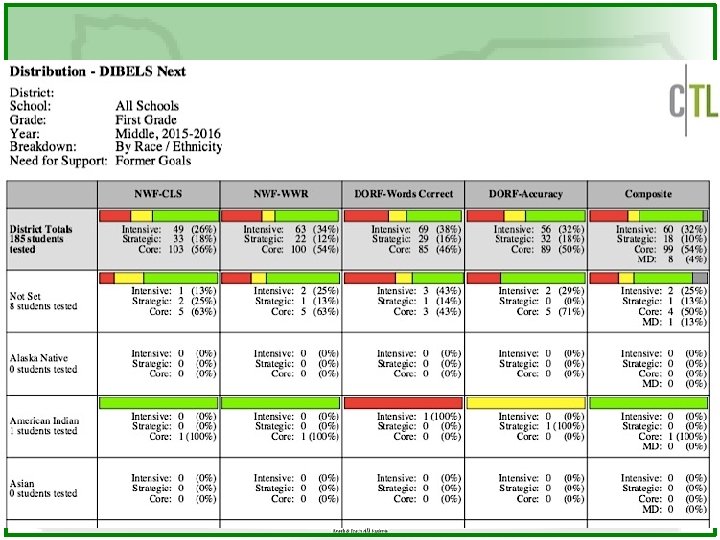
Finding you Disaggregated Data: Reports Distribution
Select Breakdown By: Demographics Please note: You will need to report disaggregated data for K, 1 st, 2 nd, & 3 rd Grade to ORTIi
Demographics Reporting
Optional to report to ORTIi For ELL/LEP students
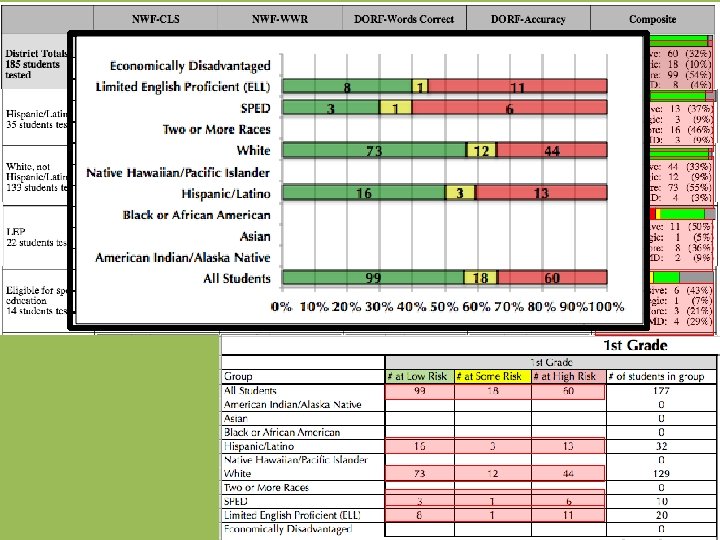
Two Options for Reporting Data to ORTIi 1. Send ORTIi the Distribution Report for K, 1 st, 2 nd & 3 rd Grade for Fall, Winter, and Spring. – Include any demographic group with more than 5 kids: • • • All Students at the grade level Distribution Reports: American Indian/Alaska Native • By Race/Ethnicity Asian • By Free and Reduced Black or African American Lunch (optional) Hispanic/Latino • By Special Education Native Hawaiian/Pacific Islander • By Additional Codes (ELL) White Two or More Races SPED Limited English Proficient or ELL Economically Disadvantaged (Optional)
Two Options for Reporting Data to ORTIi 2. Enter the data into the ORTIi Disaggregated Data Reporting Template and send to ORTIi – Located on the ORTIi website under Data Tools or ask your ORTIi coach for the file
If you DON’T give all DIBELS measures, use the DORF Words Correct If you give all DIBELS measures and a composite score is available, use the composite score
Things to Remember • You have two options for reporting the data: – Send the appropriate DIBELS Distribution Reports to ORTIi – Enter the Data into the ORTIi Disaggregated Data Reporting Template • Report disaggregated screening data for Fall, Winter, & Spring of K, 1 st, 2 nd, & 3 rd Grade • Only include student groups that have 5 or more • Reporting for Economically Disadvantaged is optional
Questions to Consider • Are you looking at this data at the district/school level? • Do you see any large achievement gaps? • Do certain groups have significantly less/more students above benchmark? – What is your plan to address these gaps?
Questions Contact your ORTIi coach OR Contact Jon Potter at jpotter@ttsd. k 12. or. us