Vision Every child in every district receives the


 Phonics")


 Team CARE Team")


 is currently reading a median of 45")


")


")


 ü Consistent corrective")


")


 Peer ROI (All District) Attained ROI")


 Peer ROI (Similar EL) Peer ROI")


")

- Slides: 71
Vision: Every child in every district receives the instruction that they need and deserve…every day. Individual Problem Solving (IPS) & Using RTI for SLD Eligibility: Guided Practice Day November, 2017
ASSESSMENT DATA-BASED DECISION MAKING INSTRUCTION SPED referral? Formal Diagnostic As needed Progress Monitoring Weekly-Monthly Universal Screening 3 times/year Tier 3 Individualized Intervention Tier 2/3 Supplement al Intervention Research-Based Core Curriculum w/ Strong Instruction Individual Problem Solving Problem Team 6 -8 weeks Intervention Review Team 6 -8 weeks Schoolwide Screening reviewed 3 times/year
Norms for the Day • Demonstrate good audience skills – Silence cell phones – Limit side conversations during presentations – Engage in active listening – Turn off email • Participate in your team discussions • Ask questions during work time • Take a break if/when you need one
Vision: Every child in every district receives the instruction that they need and deserve…every day. Individual Problem Solving
The purpose of Individual Problem Solving is not Prereferra l
The Water… Focus on “the water” • Instruction • Curriculum • Environment 6 E C I
Change the ICE to meet needs of the Learner Instruction: Curriculum: How you teach What you teach Environment: Learner: Who you teach Where you teach 7
Who are students that require individual problem solving? Students with significant deficits This may include: Students with identified disabilities A healthy system individually problem solves for about 5% of the student population 8
Who are students that require individual problem solving? Phonics for Reading (30 min) Phonics for Reading + Read Naturally (45 min) 68 46 48 9 50 51 55 49 45 54 57 58 66 62 60 Time for IPS
Group or Individual Problem? Not a child problem Amy Jackson Jose Marcus 10
Group or Individual Problem? Amy Jose Marcus Jackson 11 Individual Problem
Referrals should not come from individual teachers, they should come from your Intervention Review Team
The Problem Solving Process How is it working? 4. Plan Implementation & Evaluation What are we going to do about the problem? 13 1. Problem Identification Improved Student Achievement 3. Plan Development What is the problem? 2. Problem Analysis Why is the problem occurring?
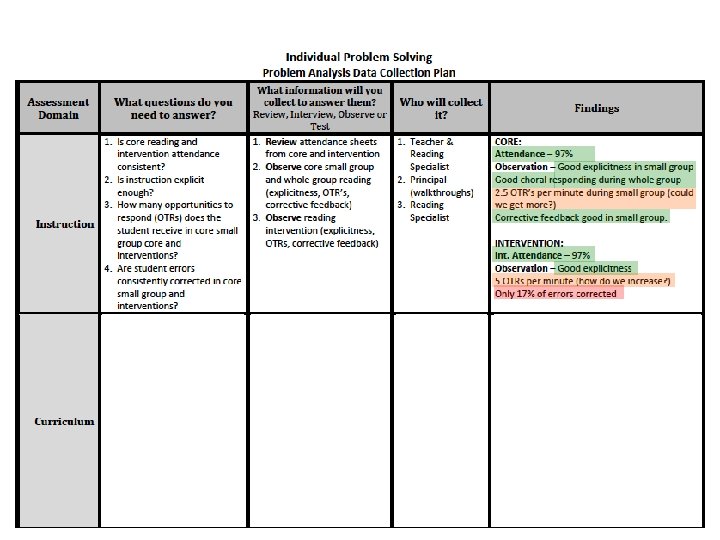
Problem Solving Form 14
Logistics • Who is on this team? – Core Problem Solving team members: • • School Psych/Counselor Principal Lit Specialist SPED Teacher – Variable depending on the student: • Grade Level teacher • ELL representative • Parent – Are invited but can provide input prior to problem solving meeting
Not another team SAT Team SST Team Individual Problem Solving (IPS) Team CARE Team
Logistics • When does this occur? – Ideally in 2 meetings • Initial Meeting: Complete steps 1 -3 – Problem ID, Problem Analysis, Plan Development • 6 -8 weeks later: Step 4: Plan Evaluation Intervention Review Team Gather Data Initial Problem Solving Meeting Steps 1 -3 Intervene Problem Solving Review Meeting Step 4 üNotify Parent (Parent Brochure) May start Initial Problem Solving during your intervention review meeting if you have the data and time
Parent Notification 18
Logistics • When does this occur? – Ideally in 2 meetings • Initial Meeting: Complete steps 1 -3 – Problem ID, Problem Analysis, Plan Development • 6 -8 weeks later: Step 4: Plan Evaluation Intervention Review Team Gather Data 1 -2 weeks Initial Problem Solving Meeting Steps 1 -3 üNotify Parent (Parent Brochure) üCore PS Team: Intervene 6 -8 weeks Problem Solving Review Meeting Step 4 üImplement Intervention üEnsure Fidelity üCompiles data üDetermines additional data needed üCollects additional data
Roles: Who is responsible for collecting information? Priorities: ü Observation: Instruction/Curriculum/Environment/Learner ü Developmental history: Learner ü Record review (including previous intervention data): Instruction/Curriculum/Environment/Learner ü Additional diagnostic assessment: Learner
Step 1: Problem Identification 1. Problem Identification Improved Student Achievement 22 What is the problem?
Step 1: Problem Identification A problem is defined as a discrepancy, using data/evidence, between: Expected performance Current performance 23 Problem Definition
Step 1: Problem Identification • Calculating magnitude of discrepancy Expected performance % of Expected Performanc e Current performance 90 WCPM 83% of expected 75 WCPM 75 ÷ 90 50% of expecte d 45 WCPM 22% of expecte d 45 ÷ 90 20 WCPM 24 20 ÷ 90
Discrepancy between Current Performance & Expected Performance 25
Step 1: Problem Identification Problem Definitions should be: 1. Objective – observable and measurable 2. Clear – passes “the stranger test” 3. Complete – includes examples (and nonexamples when necessary) and baseline data 26
Problem Definition: Example Nathan (2 nd grader) is currently reading a median of 45 words correct per minute (wcpm) with 83% accuracy when given 2 nd grade level text. He also answers an average of 3/10 comp questions correct on weekly in-class tests. 2 nd grade students in his school are reading an average of 85 wcpm with 97% accuracy on 2 nd grade text and answering 9/10 comp questions correct. 27
Problem Definition: Non. Example Nathan struggles with being a fluent reader and is not meeting the 2 nd grade reading benchmark. He makes a lot of mistakes and is currently reading at a 1 st grade level. He also has difficulties answering comprehension questions at grade level and does poorly on his weekly reading tests. 28
Calculate Magnitude of Discrepancy and Write Problem Definition Refer to your Problem Solving Sample Form for examples on what a Problem Definition could look like. 29
Review Step 1 (Problem ID)
The Problem Solving Process 1. Problem Identification Improved Student Achievement 2. Problem Analysis Why is the problem occurring? 31
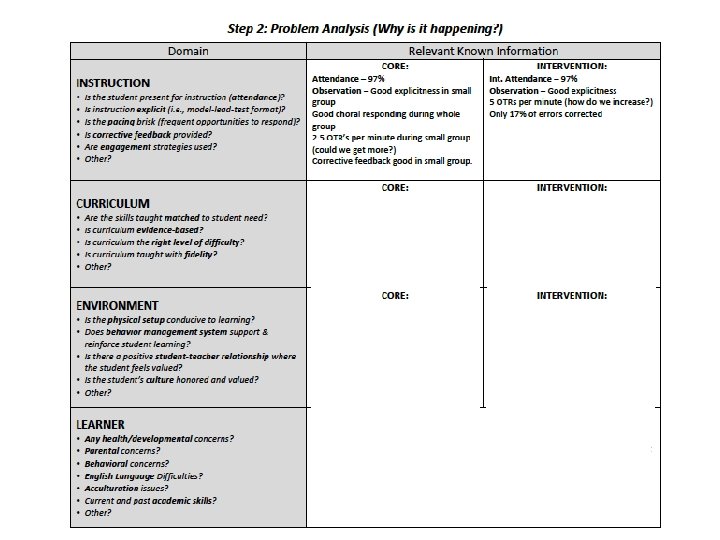
Problem Analysis 32
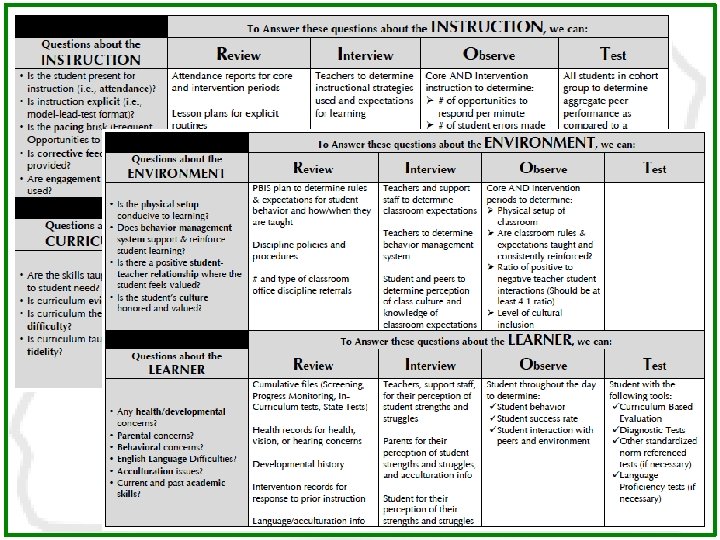
What questions do you have about the Instruction, Curriculum, Environment, and Learner? Instruction: Curriculum: • Is instruction explicit? • Is pacing brisk? • Is corrective feedback provided? • Is instruction engaging? • Other? • Are skills taught matched to student need? • Evidence-based materials? • Right level of difficulty? • Implemented with fidelity? • Other? • Physical setup? • Behavior Management system? • Positive student-teacher relationship? • Student culture valued? • Other? • Health concerns? • Parental concerns? • Behavioral concerns? • Language difficulties? • Acculturation? • Current/past academic skills? • Other? Only collect data that answers a Environment: Learner: question that you NEED answered 33
What do you know and what do you need to know? • You already have a lot of information about instruction, curriculum, and environment • Collect new data ONLY when it is answering an unanswered question
The plan is a group effort I What we know What we can do in core And more What we need to know C E L
Problem Hypothesis
Problem Hypothesis • Why is the problem occurring? • Example: – Nathan’s reading accuracy, fluency and comprehension problems occur because he lacks strategies for decoding silent-e words and vowel digraphs (oa, ea, ae, ou, etc). His current instruction does not provide enough opportunities to practice or enough corrective feedback. He also currently has a low level of engagement and is highly distracted in both his classroom and intervention room. 39
Prediction Statement • What will make the problem better? • Example: – Nathan will improve if he receives small group, explicit instruction in his identified missing skills. He also needs instruction that utilizes high pacing and effective active engagement strategies to keep him highly engaged in instruction, and an environment that is quiet, without distraction from other students. Increasing opportunities to respond and corrective feedback will help improve his accuracy and 40 fluency in reading as well.
Make a Hypothesis: Why is the student struggling?
Review Step 2 (Problem Analysis)
Step 3: Plan Development 1. Problem Identification Improved Student Achievement What are we going to do about the problem? 43 3. Plan Development 2. Problem Analysis
Goal • Define the outcome at the beginning – This intervention will be successful if… Starting Point: 45 WCPM Goal in 8 weeks: 64 WCPM – What about classroom assessments? Intervention checkouts? Other assessments?
Step 3: Plan Development
ü More opportunities to respond during Core and Intervention (Double Dose) ü Consistent corrective feedback ü Additional small group during core (phonics) ü Follow error correction procedure in curriculum ü Double Dose Phonics intervention time ü Create behavior management system to improve student motivation and engagement ü Target instruction on identified missing skills ü Accelerate progress by providing “more” of current intervention ü Coordinate instruction across teachers
Curriculum Instruction Environment
The plan is a group effort I What we know What we can do in core And more What we need to know C E L
Develop your Plan
Review Step 3 (Plan Development)
Step 4: Plan Implementation & Evaluation How is it working? 4. Plan Implementation & Evaluation 1. Problem Identification Improved Student Achievement 3. Plan Development 51 2. Problem Analysis
Progress monitoring data… as compared to peer/expected growth 52
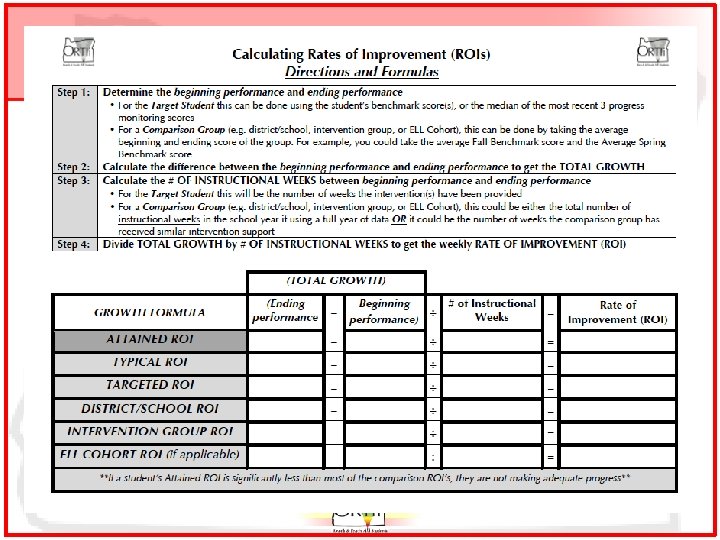
How much progress is enough? In order to answer know how much progress is enough, we need to compare Rates of Improvement (ROI’s): Attained ROI Actual growth of the target student as compared to Typical ROI Targeted ROI Peer ROI Expected growth of a student who starts the year at benchmark and remains at benchmark through Winter and Spring Growth needed for the student to meet the end-ofyear benchmark Growth of students receiving the same instruction
3 rd Grade DIBELS ORF Attained ROI Intervention Change 54 – 36 = 18 WCPM 100 18 WCPM / 20 Weeks = 0. 9 WCPM/week 54 36 Sep Oct Nov Dec Jan Feb Mar Apr May
How much progress is enough? In order to answer know how much progress is enough, we need to compare Rates of Improvement (ROI’s): Attained ROI 0. 9 WCPM/week Actual growth of the target student as compared to Typical ROI Targeted ROI Peer ROI Expected growth of a student who starts the year at benchmark and remains at benchmark through Winter and Spring Growth needed for the student to meet the end-ofyear benchmark Growth of students receiving the same instruction
3 rd Grade DIBELS ORF Typical ROI 100 – 70 = 30 WCPM / 36 Weeks = 0. 83 WCPM/week 100 86 70 Sep Oct Nov Dec Jan Feb Mar Apr May
How much progress is enough? In order to answer know how much progress is enough, we need to compare Rates of Improvement (ROI’s): Attained ROI 0. 9 WCPM/week Actual growth of the target student as compared to Typical ROI Targeted ROI Peer ROI Expected growth of a student who starts the year at benchmark and remains at benchmark through Winter and Spring 0. 83 WCPM/week Growth needed for the student to meet the end-ofyear benchmark Growth of students receiving the same instruction
3 rd Grade DIBELS ORF Targeted ROI 100 – 36 = 64 WCPM / 36 Weeks = 1. 77 WCPM per week 100 86 70 36 Sep Oct Nov Dec Jan Feb Mar Apr May
How much progress is enough? In order to answer know how much progress is enough, we need to compare Rates of Improvement (ROI’s): Attained ROI 0. 9 WCPM/week Actual growth of the target student as compared to Typical ROI Targeted ROI Peer ROI Expected growth of a student who starts the year at benchmark and remains at benchmark through Winter and Spring 0. 83 WCPM/week 1. 77 WCPM/week Growth needed for the student to meet the end-ofyear benchmark Growth of students receiving the same instruction
3 rd Grade DIBELS ORF Peer ROI 104 – 68 = 36 WCPM All 3 rd Graders in District (last year) 100 68 40 All 3 rd Graders in similar intervention Group Sep Oct 104 36 WCPM / 36 Weeks = 1 WCPM per week 68 68 – 40 = 28 WCPM / 20 Weeks = 1. 4 WCPM per week Nov Dec Jan Feb Mar Apr May
How much progress is enough? In order to answer know how much progress is enough, we need to compare Rates of Improvement (ROI’s): Attained ROI 0. 9 WCPM/week Actual growth of the target student as compared to Typical ROI Targeted ROI Peer ROI Expected growth of a student who starts the year at benchmark and remains at benchmark through Winter and Spring 0. 83 WCPM/week 1. 77 WCPM/week Growth needed for the student to meet the end-ofyear benchmark 1. 4 1 Growth WCPM/week of students receiving the same instruction WCPM/week
Comparisons Comparison Targeted ROI Peer ROI (Intervention Group) Peer ROI (All District) Attained ROI Typical ROI (WCPM/week) 1. 77 1. 4 1 0. 9 0. 83
Compare EL’s to a peer group based on the 5 L’s • • • Language (native) Level of native language proficiency Level of English language proficiency Length of time in school Length of time in country Not all EL’s are the same!
3 rd Grade DIBELS ORF Peer ROI: ELL Student All 3 rd Grade ELs with similar: • Language • Native language proficiency • English Language proficiency • Time in school • Time in country 60 – 35 = 25 WCPM 28 WCPM / 20 Weeks = 1. 25 WCPM per week 100 60 35 Sep Oct Nov Dec Jan Feb Mar Apr May
Comparisons Comparison Targeted ROI Peer ROI (Intervention Group) Peer ROI (Similar EL) Peer ROI (All District) Attained ROI Typical ROI (WCPM/week) 1. 77 1. 4 1. 25 1 0. 9 0. 83
Practice: 3 rd grade student Target Student: Started at 45 WCPM, ended at 58 WCPM (7 Inst Weeks) Benchmarks: Fall: 70 WCPM; Spring: 100 WCPM (32 Inst Weeks) Intervention Peers: Started at 39, ended at 53 (7 Inst Weeks) 3 rd Grade Peers: Fall: 75 WCPM; Spring: 110 WCPM (32 Inst Weeks)
Practice: 4 th grade student Target Student: Started at 62 WCPM, ended at 69 WCPM (8 Inst Weeks) Benchmarks: Fall: 90 WCPM; Spring: 115 WCPM (32 Inst Weeks) Intervention Peers: Started at 79, ended at 67 (8 Inst Weeks) 4 th Grade Peers: Fall: 89 WCPM; Spring: 121 WCPM (32 Inst Weeks)
Practice: 4 th grade student Target Student: Started at 62 WCPM, ended at 69 WCPM (8 Inst Weeks) Benchmarks: Fall: 90 WCPM; Spring: 115 WCPM (32 Inst Weeks) Intervention Peers: Started at 79, ended at 67 (8 Inst Weeks) 4 th Grade Peers: Fall: 89 WCPM; Spring: 121 WCPM (32 Inst Weeks) 69 115 62 90 8 32 0. 9 WCPM/Week 121 79 89 67 32 7 1 WCPM/Week 0. 8 WCPM/Week 1. 7 WCPM/Week
Review Step 4 (Plan Implementation/Evaluation)
Logistics: Timeline Intervention Review Team Gather Data 1 -2 weeks Initial Problem Solving Meeting Steps 1 -3 üNotify Parent (Parent Brochure) üCore PS Team: Intervene 6 -8 weeks Problem Solving Review Meeting Step 4 üImplement Intervention üEnsure Fidelity üCompiles data üDetermines additional data needed üCollects additional data