Virtual Potential Temperature Potential temperature The potential temperature


- Slides: 9
Virtual Potential Temperature
Potential temperature : The potential temperature is the temperature that the parcel would attain if adiabatically brought to a standard reference pressure P 0 usually (1000 mb) or (100 k. Pa). Potential temperature is a more dynamically important quantity than the actual temperature. This is because it is not affected by the physical lifting or sinking associated with the flow over obstacles. Potential temperature is a useful measure of the static stability of the unsaturated atmosphere. When θv is constant, the atmosphere is statically neutral. When it decreases with elevation, the atmosphere is unstable to vertical motions, and convection. When it increases with elevation, the atmosphere is statically stable. Potential temperature perturbations potential temperature perturbation is defined as the difference between the potential temperature of the ABL and the potential temperature of the free atmosphere above the ABL. Virtual temperature (Tv) : Virtual temperature is the temperature at which dry air would have the same density as the moist air, at a given pressure. The virtual temperature of unsaturated moist air is always greater than the absolute air temperature. The suspension of cloud droplets in an air parcel, it always reduces the virtual temperature. Buoyancy is one of the driving forces for turbulence in the BL. Thermals of warm air rise because they are less dense than the surrounding air, and hence positively buoyant
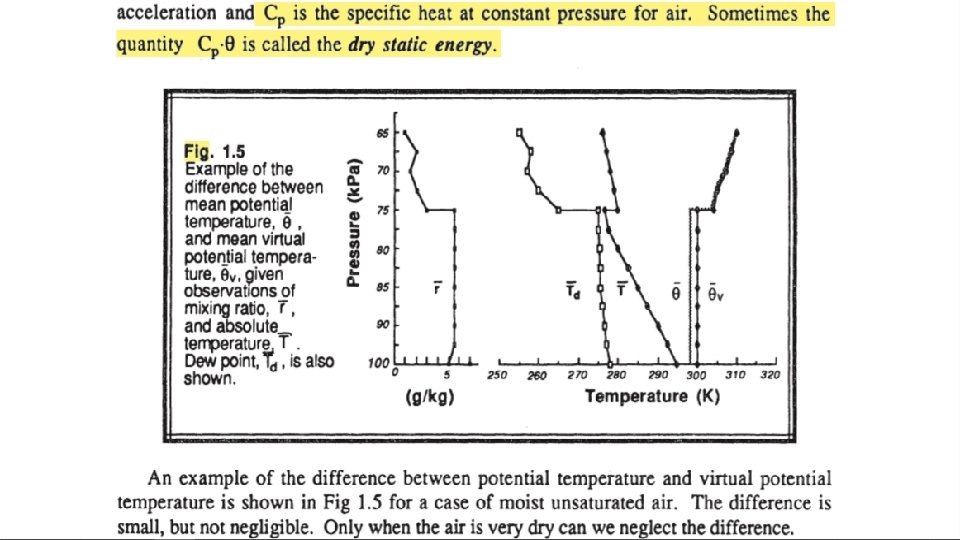
Virtual potential temperature : Virtual potential temperature is similar to potential temperature in that it removes the temperature variation caused by changes in pressure. Virtual potential temperature is useful as a surrogate for density in buoyancy calculations and turbulence transport which includes vertical air movement.
the virtual potential temperature is only about 4 K warmer than the potential temperature, this difference is on the same order as the difference between the warm air rising in thermals and the surrounding environment.
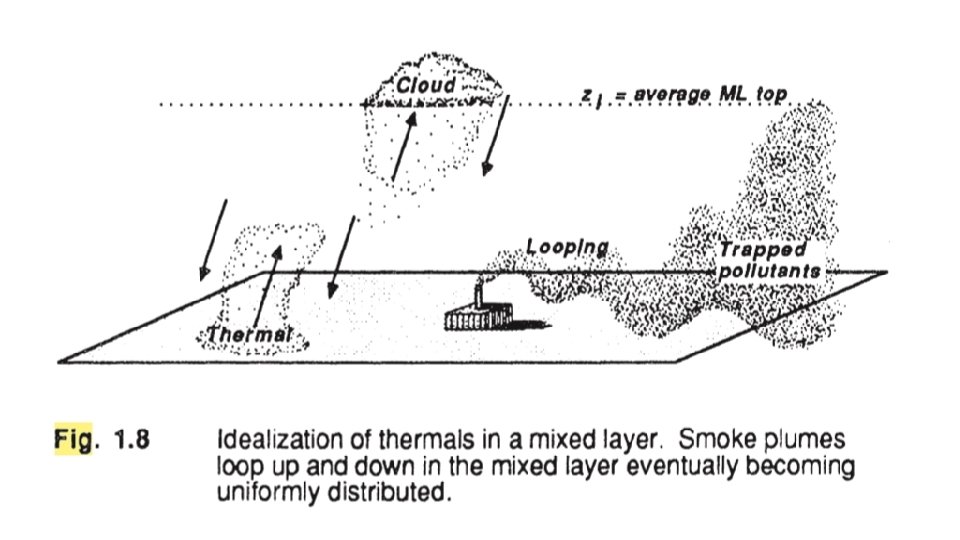
Ø Mixed Layer The turbulence in the mixed layer is usually convectively driven. Convective sources include heat transfer from a warm ground surface and radiative cooling from the top of the cloud layer. The first situation creates thermals of warm air rising from the ground, while the second creates thermals of cool air sinking from cloud top. Both can occur simultaneously, particularly when cool stratocumulus topped mixed layer is being advected over the warmer ground. Even when convection is the dominant mechanism, there is usually wind shear across the top of the ML that contributes to the turbulence generation. On initially cloud-free days, ML growth is tied to solar heating of the ground. Starting about a half hour after sunrise, a turbulent ML begins to grow in depth. This ML is characterized by intense mixing in a statically unstable situation where thermals of warm air rise from the ground (Fig 1. 8). The ML reaches its maximum depth in late afternoon. In this mixed layer, potential temperature and water vapor mixing ratio are nearly uniform. High or middle overcast can reduce the insolation at ground level. This, in turn, reduces the intensity of thermals. On these days the ML may exhibit slower growth, and may even become non-turbulent or neutrallystratified if the clouds are thick enough.
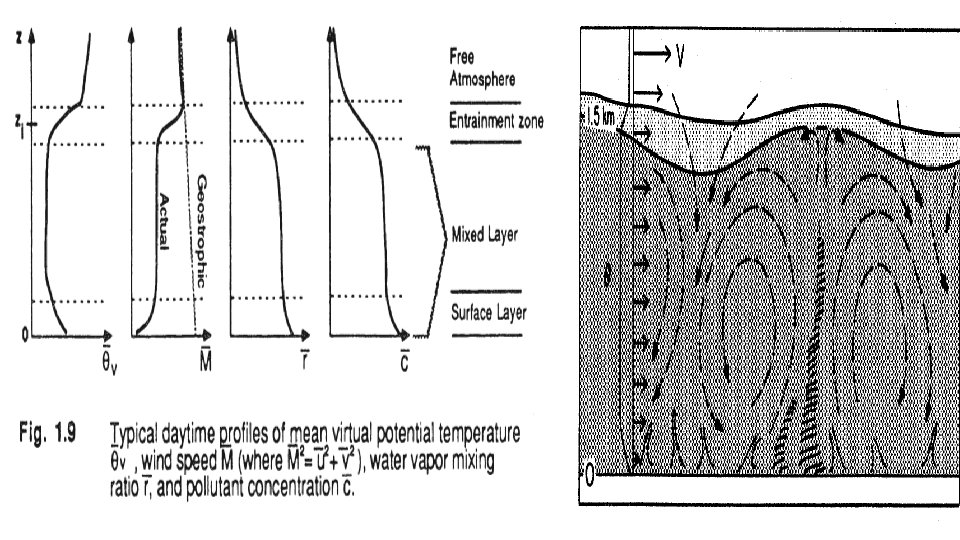
The resulting profiles of virtual potential temperature, mixing ratio, pollutant concentration, and wind speed frequently are as sketched in Figure 1. 9. Virtual potential temperature profiles. The virtual potential temperature is nearly adiabatic (i. e. , constant with height) in the middle portion of the mixed layer (ML), and is super-adiabatic in the surface layer. At the top of the ML there is usually a stable layer to stop the turbulent eddies from rising further. When the layer is very stable so that the temperature increases with height, it is usually called capping inversion. This capping inversion can keep deep convection from developing thus restraining the domain of turbulence. It is called the entrainment zone because entrainment into the ML occurs there. Wind speeds The boundary layer wind is usually sub-geostrophic, due to surface drag and vertical mixing of momentum. The middle portion of the ML frequently has nearly constant wind speed and direction. Wind speeds decrease towards zero near the ground. resulting in a wind speed profile that is nearly logarithmic with height in the surface layer. Mixing ratios tend to decrease with height, even within the center portion of the ML. This reflects the evaporation of soil and plant moisture from below, and the water vapor mixing ratio is nearly constant in the ML. The moisture decrease across the top of the ML is very pronounced. Pollutant sources are near the earth's surface. Thus, pollutant concentrations can build up in the ML while FA concentrations remain relatively low. Pollutants are transported by eddies such as thermals;