
Virological predictors of clinical outcome Anna Maria Geretti



- Slides: 34
Virological predictors of clinical outcome Anna Maria Geretti Royal Free Hampstead NHS Trust & UCL Medical School London
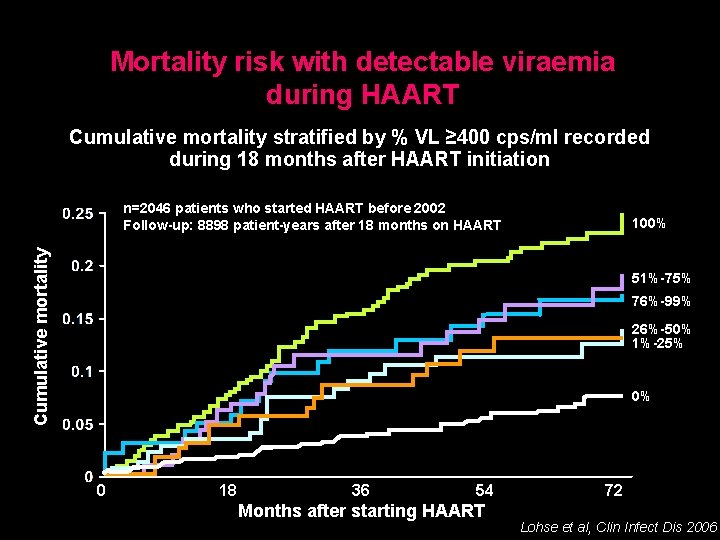
Mortality risk with detectable viraemia during HAART Cumulative mortality stratified by % VL ≥ 400 cps/ml recorded during 18 months after HAART initiation n=2046 patients who started HAART before 2002 Follow-up: 8898 patient-years after 18 months on HAART Cumulative mortality 100% 51%-75% 76%-99% 26%-50% 1%-25% 0% 0 18 36 54 Months after starting HAART 72 Lohse et al, Clin Infect Dis 2006
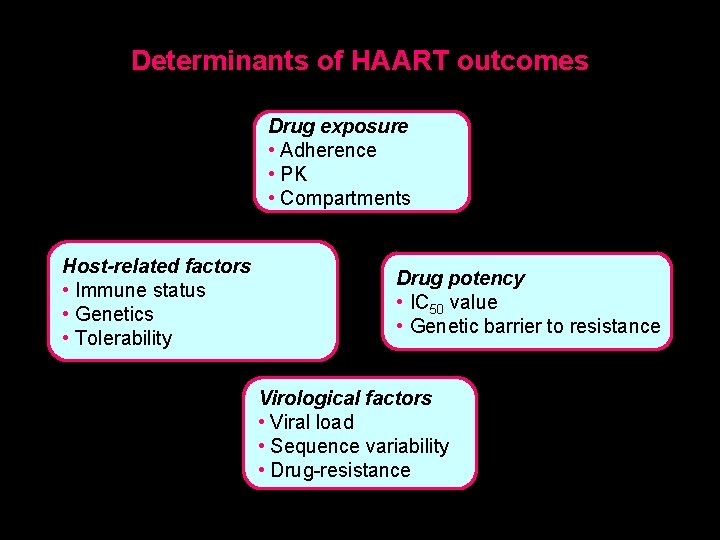
Determinants of HAART outcomes Drug exposure • Adherence • PK • Compartments Host-related factors • Immune status • Genetics • Tolerability Drug potency • IC 50 value • Genetic barrier to resistance Virological factors • Viral load • Sequence variability • Drug-resistance
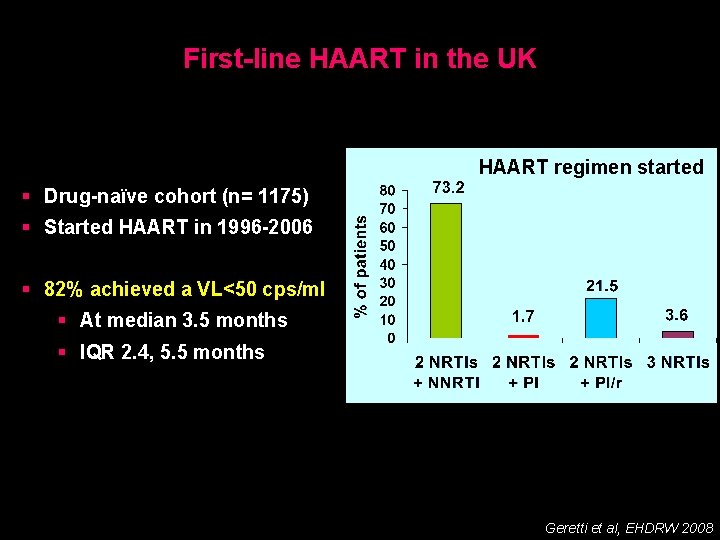
First-line HAART in the UK HAART regimen started § Drug-naïve cohort (n= 1175) § Started HAART in 1996 -2006 § 82% achieved a VL<50 cps/ml § At median 3. 5 months § IQR 2. 4, 5. 5 months Geretti et al, EHDRW 2008
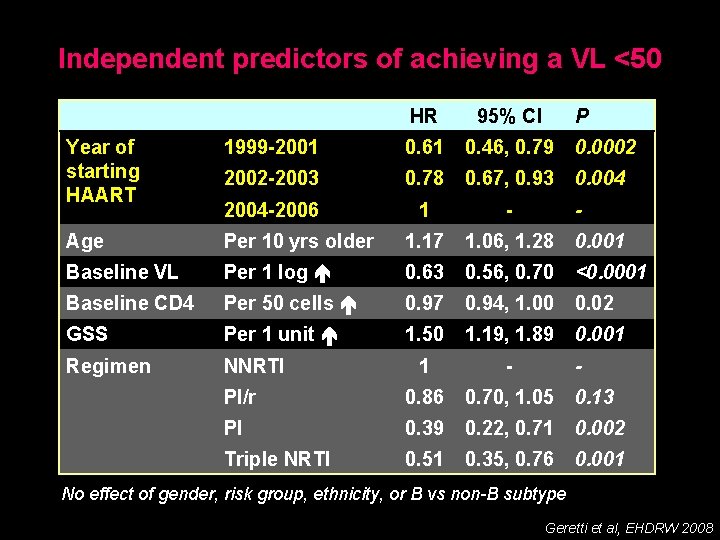
Independent predictors of achieving a VL <50 HR 95% CI P Year of starting HAART 1999 -2001 0. 61 0. 46, 0. 79 0. 0002 2002 -2003 0. 78 0. 67, 0. 93 0. 004 2004 -2006 1 - Age Per 10 yrs older 1. 17 1. 06, 1. 28 0. 001 Baseline VL Per 1 log 0. 63 0. 56, 0. 70 <0. 0001 Baseline CD 4 Per 50 cells 0. 97 0. 94, 1. 00 0. 02 GSS Per 1 unit 1. 50 1. 19, 1. 89 0. 001 Regimen NNRTI 1 - PI/r 0. 86 0. 70, 1. 05 0. 13 PI 0. 39 0. 22, 0. 71 0. 002 Triple NRTI 0. 51 0. 35, 0. 76 0. 001 - - No effect of gender, risk group, ethnicity, or B vs non-B subtype Geretti et al, EHDRW 2008
Exploring the determinants of HAART failure § Impact of low-level viraemia § Impact of HIV-1 subtype § Impact of transmitted drug resistance
Exploring the determinants of HAART failure § Impact of low-level viraemia § Impact of HIV-1 subtype § Impact of transmitted drug resistance
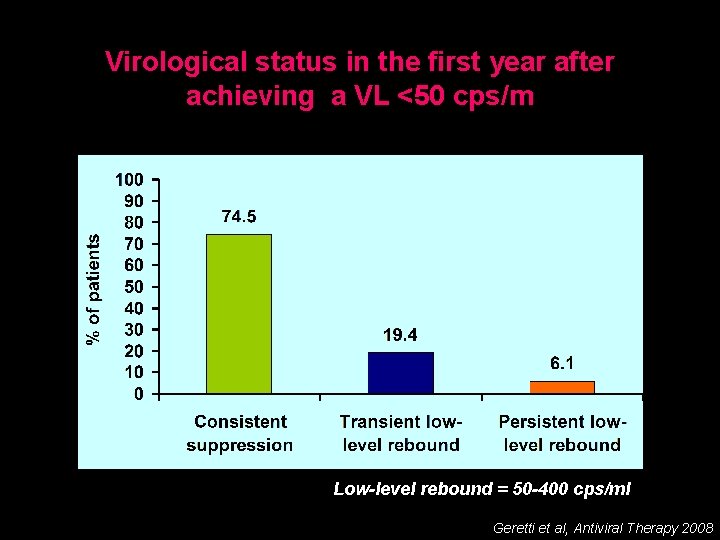
Study objectives § Investigate the long-term virological outcomes of a large cohort initially showing good responses to first-line HAART § Explore the occurrence and impact of low-level viraemia between 50 and 400 cps/ml Geretti et al, Antiviral Therapy 2008
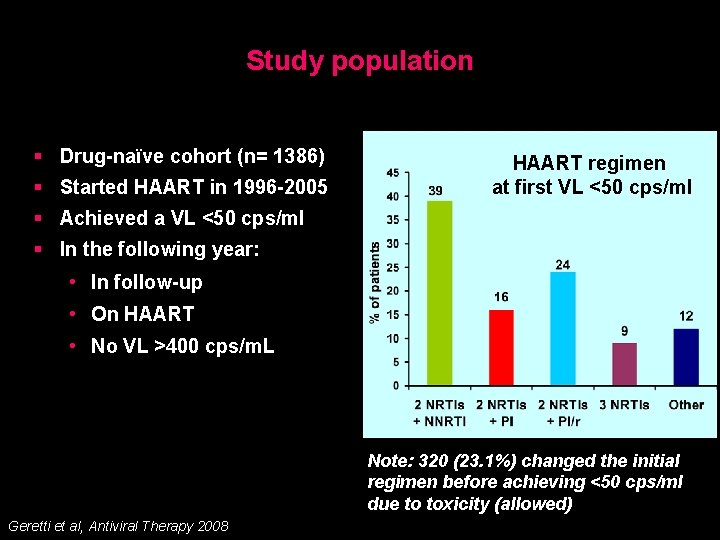
Study population § Drug-naïve cohort (n= 1386) § Started HAART in 1996 -2005 HAART regimen at first VL <50 cps/ml § Achieved a VL <50 cps/ml § In the following year: • In follow-up • On HAART • No VL >400 cps/m. L Note: 320 (23. 1%) changed the initial regimen before achieving <50 cps/ml due to toxicity (allowed) Geretti et al, Antiviral Therapy 2008
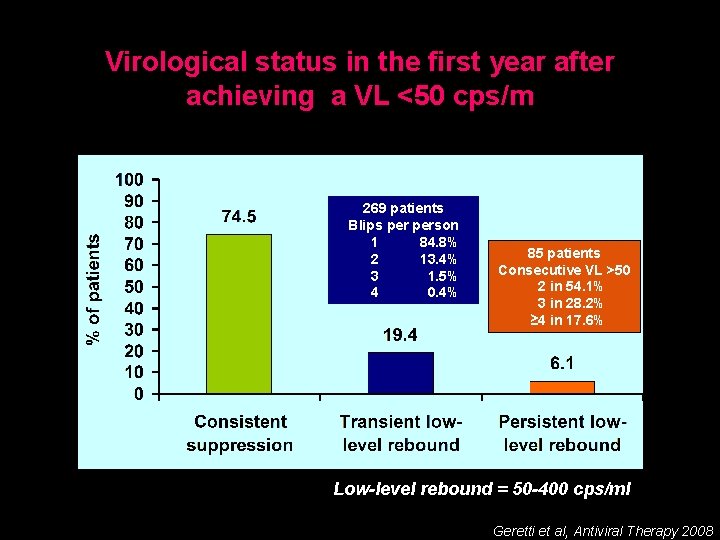
Virological status in the first year after achieving a VL <50 cps/m Low-level rebound = 50 -400 cps/ml Geretti et al, Antiviral Therapy 2008
Virological status in the first year after achieving a VL <50 cps/m 269 patients Blips person 1 84. 8% 2 13. 4% 3 1. 5% 4 0. 4% 85 patients Consecutive VL >50 2 in 54. 1% 3 in 28. 2% ≥ 4 in 17. 6% Low-level rebound==50 -400 copies/ml cps/ml Geretti et al, Antiviral Therapy 2008
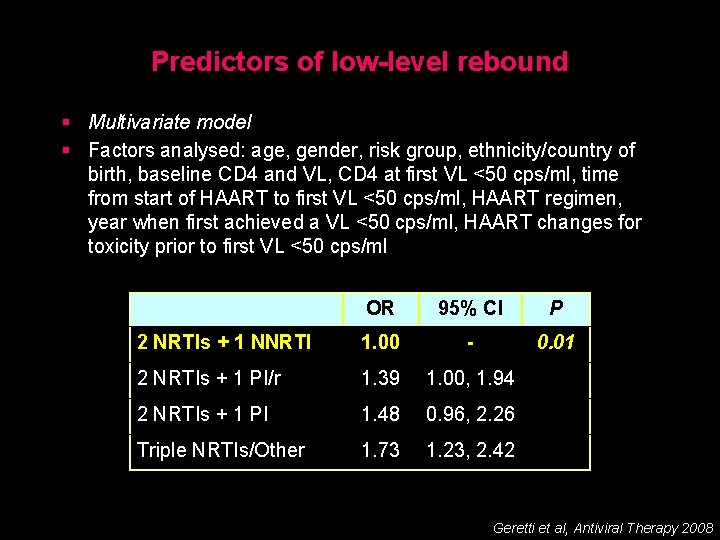
Predictors of low-level rebound § Multivariate model § Factors analysed: age, gender, risk group, ethnicity/country of birth, baseline CD 4 and VL, CD 4 at first VL <50 cps/ml, time from start of HAART to first VL <50 cps/ml, HAART regimen, year when first achieved a VL <50 cps/ml, HAART changes for toxicity prior to first VL <50 cps/ml OR 95% CI P 2 NRTIs + 1 NNRTI 1. 00 - 0. 01 2 NRTIs + 1 PI/r 1. 39 1. 00, 1. 94 2 NRTIs + 1 PI 1. 48 0. 96, 2. 26 Triple NRTIs/Other 1. 73 1. 23, 2. 42 Geretti et al, Antiviral Therapy 2008
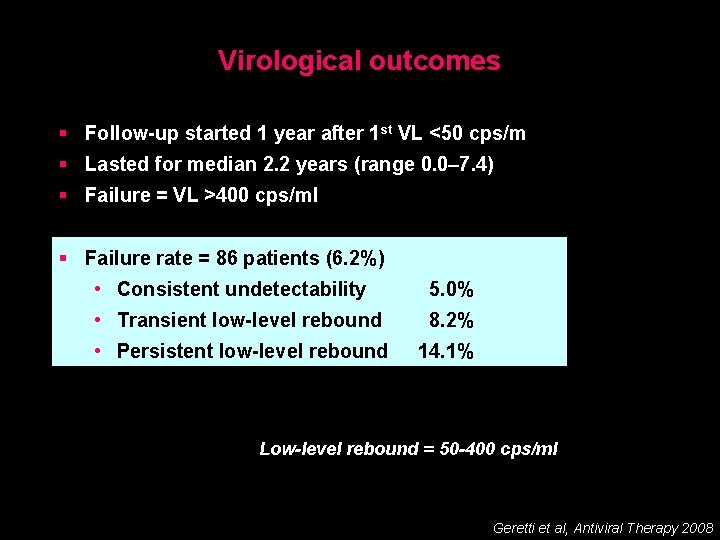
Virological outcomes § Follow-up started 1 year after 1 st VL <50 cps/m § Lasted for median 2. 2 years (range 0. 0– 7. 4) § Failure = VL >400 cps/ml § Failure rate = 86 patients (6. 2%) • Consistent undetectability 5. 0% • Transient low-level rebound 8. 2% • Persistent low-level rebound 14. 1% Low-level rebound = 50 -400 cps/ml Geretti et al, Antiviral Therapy 2008
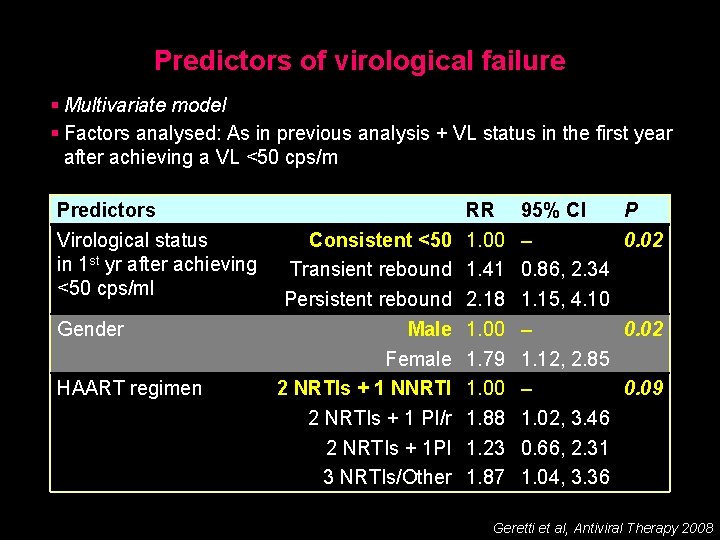
Predictors of virological failure § Multivariate model § Factors analysed: As in previous analysis + VL status in the first year after achieving a VL <50 cps/m Predictors Virological status in 1 st yr after achieving <50 cps/ml Gender HAART regimen Consistent <50 Transient rebound Persistent rebound Male Female 2 NRTIs + 1 NNRTI 2 NRTIs + 1 PI/r 2 NRTIs + 1 PI 3 NRTIs/Other RR 1. 00 1. 41 2. 18 1. 00 1. 79 1. 00 1. 88 1. 23 1. 87 95% CI – 0. 86, 2. 34 1. 15, 4. 10 – 1. 12, 2. 85 – 1. 02, 3. 46 0. 66, 2. 31 1. 04, 3. 36 P 0. 02 0. 09 Geretti et al, Antiviral Therapy 2008
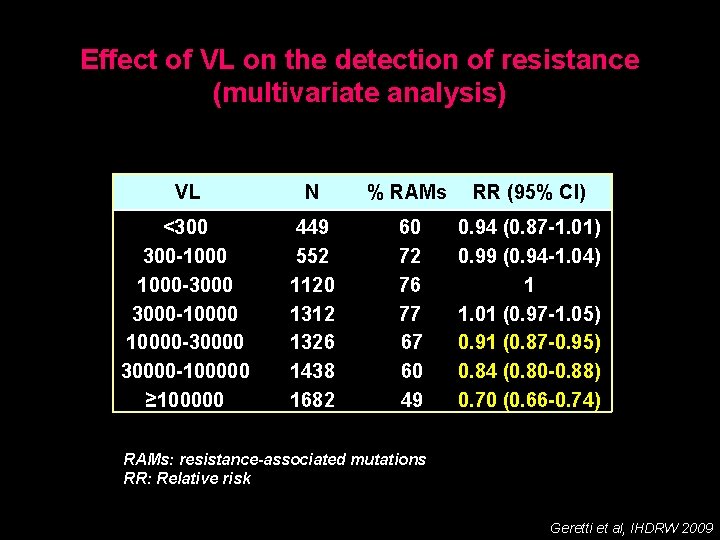
Effect of VL on the detection of resistance (multivariate analysis) VL N % RAMs RR (95% CI) <300 300 -1000 -3000 -10000 -30000 -100000 ≥ 100000 449 552 1120 1312 1326 1438 1682 60 72 76 77 67 60 49 0. 94 (0. 87 -1. 01) 0. 99 (0. 94 -1. 04) 1 1. 01 (0. 97 -1. 05) 0. 91 (0. 87 -0. 95) 0. 84 (0. 80 -0. 88) 0. 70 (0. 66 -0. 74) RAMs: resistance-associated mutations RR: Relative risk Geretti et al, IHDRW 2009
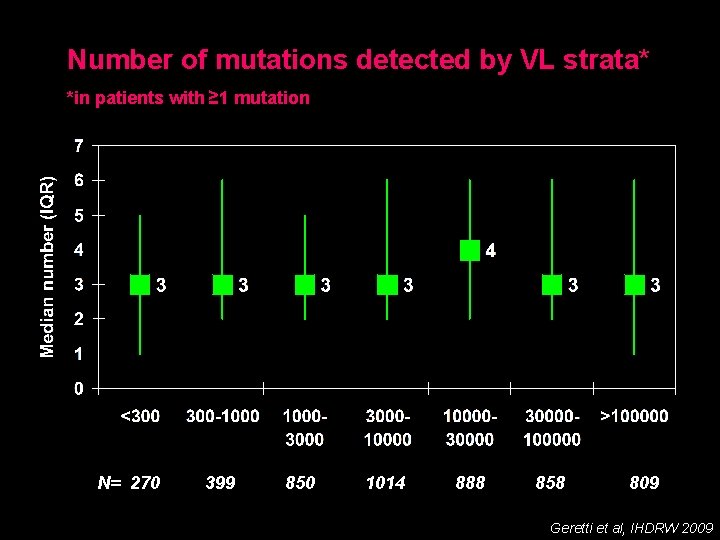
Number of mutations detected by VL strata* *in patients with ≥ 1 mutation N= 270 399 850 1014 888 858 809 Geretti et al, IHDRW 2009
Exploring the determinants of HAART failure § Impact of low-level viraemia § Impact of HIV-1 subtype § Impact of transmitted drug resistance
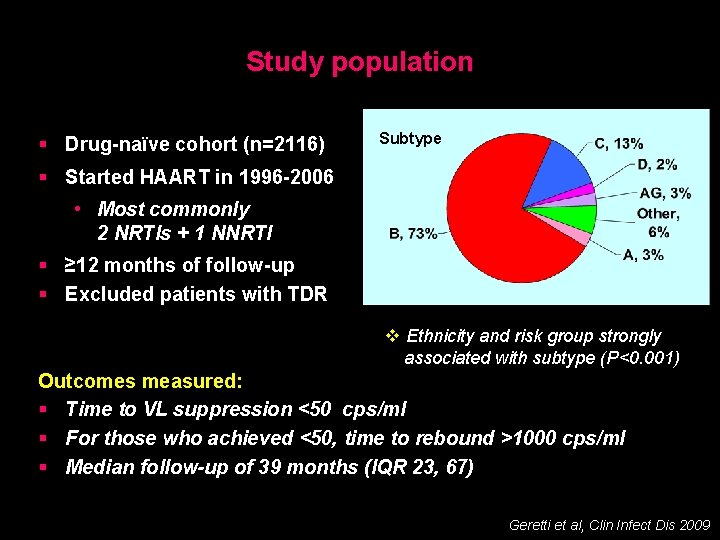
Study population § Drug-naïve cohort (n=2116) Subtype § Started HAART in 1996 -2006 • Most commonly 2 NRTIs + 1 NNRTI § ≥ 12 months of follow-up § Excluded patients with TDR v Ethnicity and risk group strongly associated with subtype (P<0. 001) Outcomes measured: § Time to VL suppression <50 cps/ml § For those who achieved <50, time to rebound >1000 cps/ml § Median follow-up of 39 months (IQR 23, 67) Geretti et al, Clin Infect Dis 2009
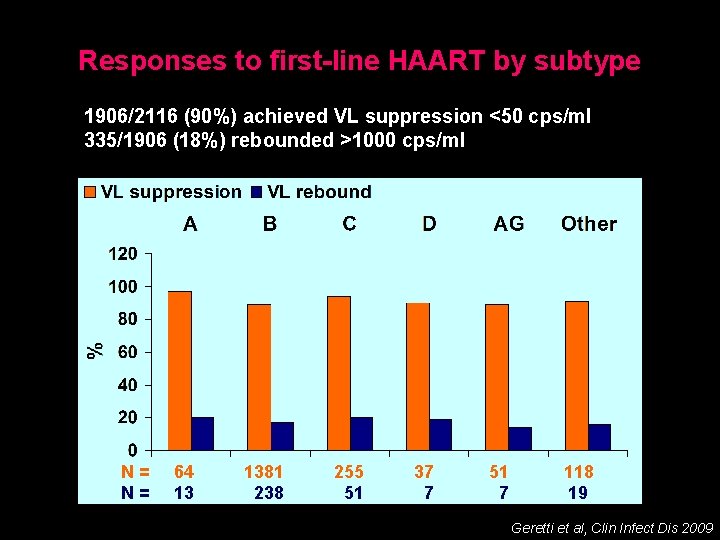
Responses to first-line HAART by subtype 1906/2116 (90%) achieved VL suppression <50 cps/ml 335/1906 (18%) rebounded >1000 cps/ml N= N= 64 13 1381 238 255 51 37 7 51 7 118 19 Geretti et al, Clin Infect Dis 2009
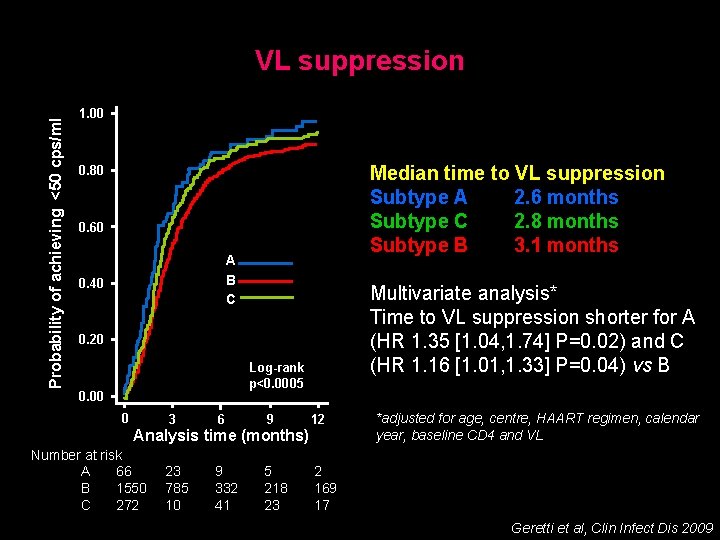
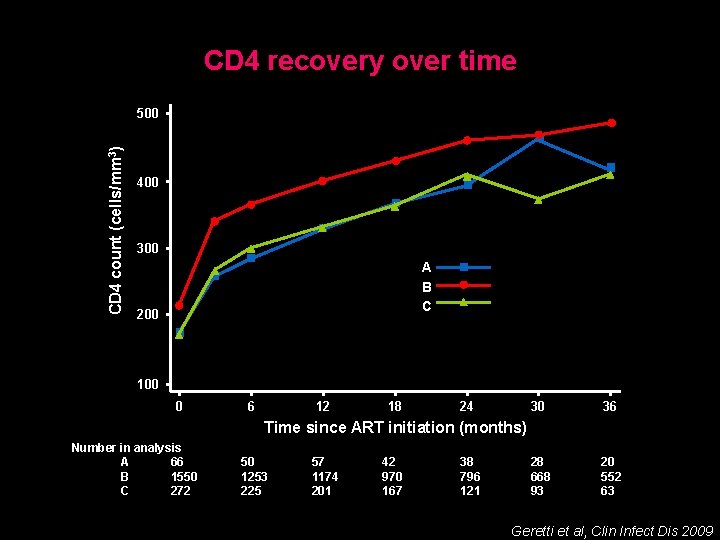
Probability of achieving <50 cps/ml VL suppression 1. 00 Median time to VL suppression Subtype A 2. 6 months Subtype C 2. 8 months Subtype B 3. 1 months 0. 80 0. 60 A B C 0. 40 Multivariate analysis* Time to VL suppression shorter for A (HR 1. 35 [1. 04, 1. 74] P=0. 02) and C (HR 1. 16 [1. 01, 1. 33] P=0. 04) vs B 0. 20 Log-rank p<0. 0005 0. 00 0 3 6 9 12 23 785 10 9 332 41 5 218 23 2 169 17 Analysis time (months) Number at risk A 66 B 1550 C 272 *adjusted for age, centre, HAART regimen, calendar year, baseline CD 4 and VL Geretti et al, Clin Infect Dis 2009
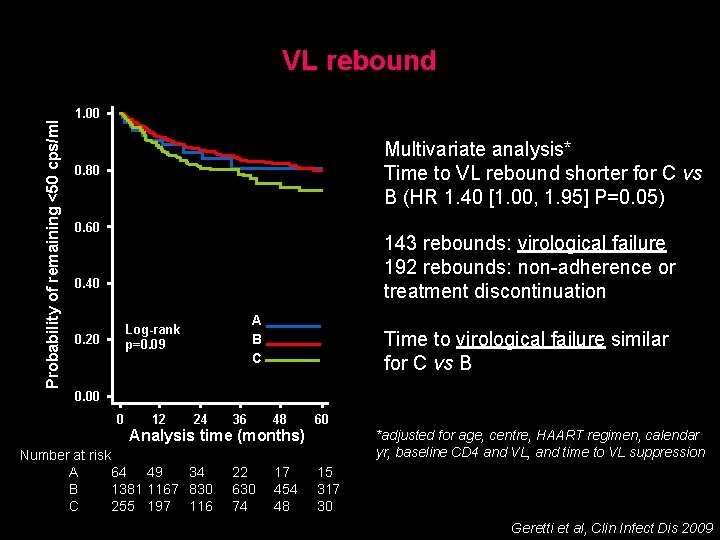
Probability of remaining <50 cps/ml VL rebound 1. 00 Multivariate analysis* Time to VL rebound shorter for C vs B (HR 1. 40 [1. 00, 1. 95] P=0. 05) 0. 80 0. 60 143 rebounds: virological failure 192 rebounds: non-adherence or treatment discontinuation 0. 40 A B C Log-rank p=0. 09 0. 20 Time to virological failure similar for C vs B 0. 00 0 12 24 36 48 Analysis time (months) Number at risk A 64 49 34 B 1381 1167 830 C 255 197 116 22 630 74 17 454 48 60 *adjusted for age, centre, HAART regimen, calendar yr, baseline CD 4 and VL, and time to VL suppression 15 317 30 Geretti et al, Clin Infect Dis 2009
CD 4 recovery over time CD 4 count (cells/mm 3) 500 400 300 A B C 200 100 0 6 12 18 24 30 36 28 668 93 20 552 63 Time since ART initiation (months) Number in analysis A 66 B 1550 C 272 50 1253 225 57 1174 201 42 970 167 38 796 121 Geretti et al, Clin Infect Dis 2009
Exploring the determinants of HAART failure § Impact of low-level viraemia § Impact of HIV-1 subtype § Impact of transmitted drug resistance
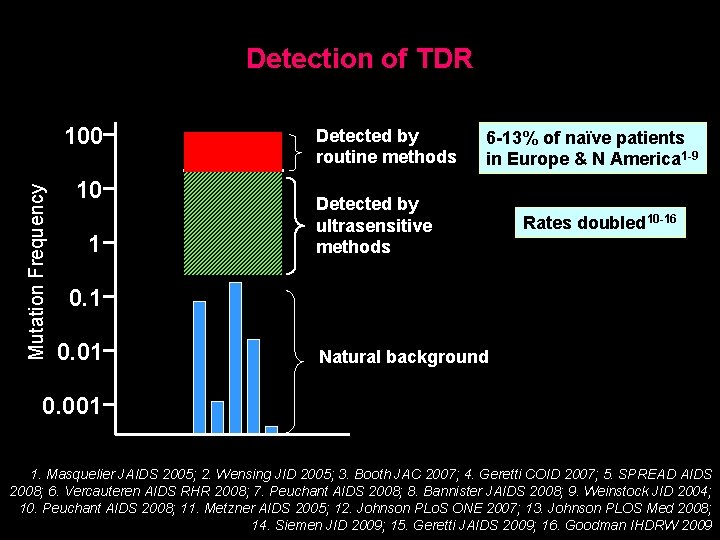
Detection of TDR Mutation Frequency 100 10 1 Detected by routine methods 6 -13% of naïve patients in Europe & N America 1 -9 Detected by ultrasensitive methods Rates doubled 10 -16 0. 1 0. 01 Natural background 0. 001 1. Masquelier JAIDS 2005; 2. Wensing JID 2005; 3. Booth JAC 2007; 4. Geretti COID 2007; 5. SPREAD AIDS 2008; 6. Vercauteren AIDS RHR 2008; 7. Peuchant AIDS 2008; 8. Bannister JAIDS 2008; 9. Weinstock JID 2004; 10. Peuchant AIDS 2008; 11. Metzner AIDS 2005; 12. Johnson PLo. S ONE 2007; 13. Johnson PLOS Med 2008; 14. Siemen JID 2009; 15. Geretti JAIDS 2009; 16. Goodman IHDRW 2009
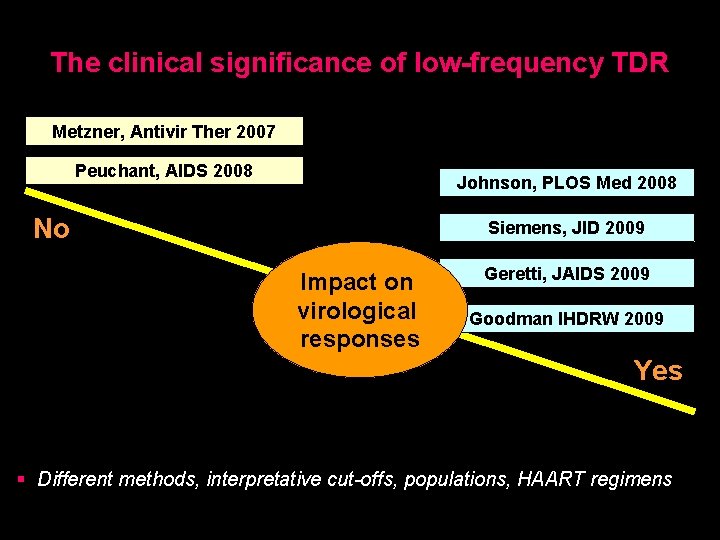
The clinical significance of low-frequency TDR Metzner, Antivir Ther 2007 Peuchant, AIDS 2008 Johnson, PLOS Med 2008 No Siemens, JID 2009 Impact on virological responses Geretti, JAIDS 2009 Goodman IHDRW 2009 Yes § Different methods, interpretative cut-offs, populations, HAART regimens
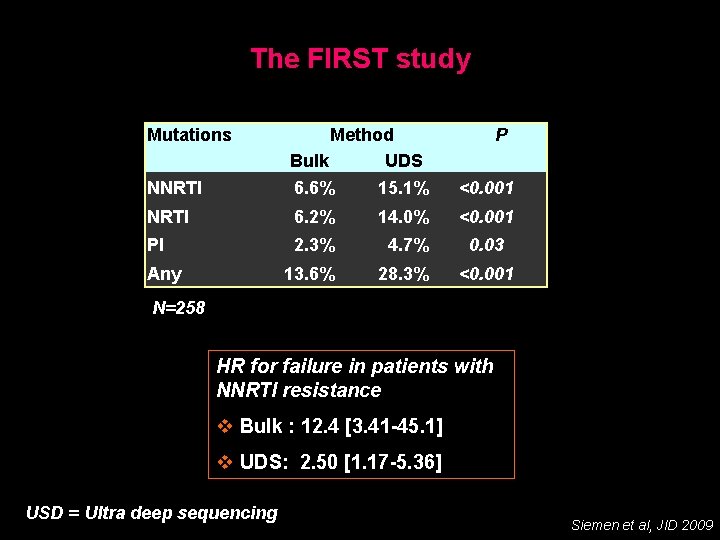
The FIRST study Mutations Method Bulk UDS NNRTI 6. 6% 15. 1% <0. 001 NRTI 6. 2% 14. 0% <0. 001 PI 2. 3% 4. 7% 0. 03 13. 6% 28. 3% <0. 001 Any P N=258 HR for failure in patients with NNRTI resistance v Bulk : 12. 4 [3. 41 -45. 1] v UDS: 2. 50 [1. 17 -5. 36] USD = Ultra deep sequencing Siemen et al, JID 2009
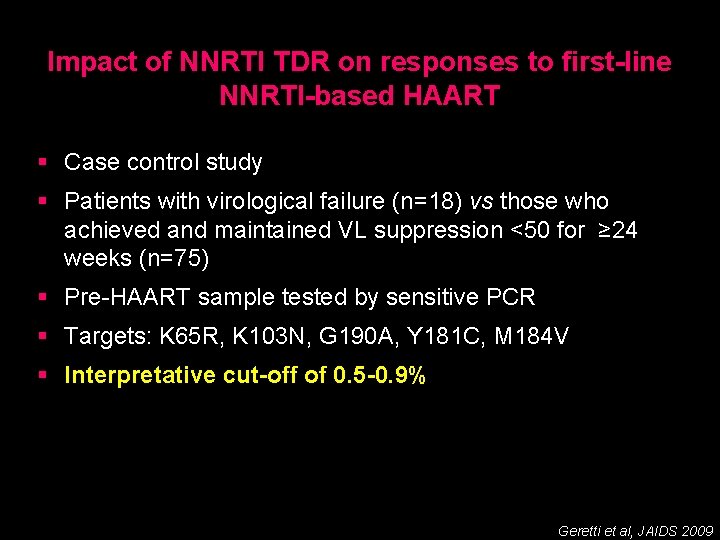
Impact of NNRTI TDR on responses to first-line NNRTI-based HAART § Case control study § Patients with virological failure (n=18) vs those who achieved and maintained VL suppression <50 for ≥ 24 weeks (n=75) § Pre-HAART sample tested by sensitive PCR § Targets: K 65 R, K 103 N, G 190 A, Y 181 C, M 184 V § Interpretative cut-off of 0. 5 -0. 9% Geretti et al, JAIDS 2009
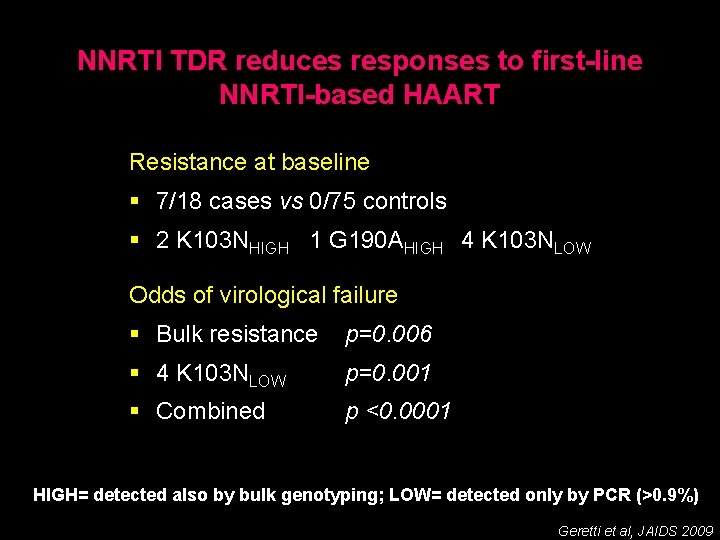
NNRTI TDR reduces responses to first-line NNRTI-based HAART Resistance at baseline § 7/18 cases vs 0/75 controls § 2 K 103 NHIGH 1 G 190 AHIGH 4 K 103 NLOW Odds of virological failure § Bulk resistance p=0. 006 § 4 K 103 NLOW p=0. 001 § Combined p <0. 0001 HIGH= detected also by bulk genotyping; LOW= detected only by PCR (>0. 9%) Geretti et al, JAIDS 2009
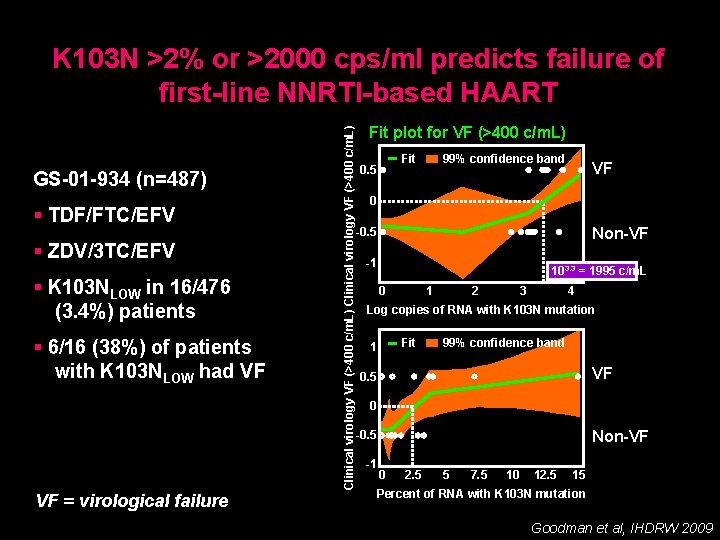
GS-01 -934 (n=487) § TDF/FTC/EFV § ZDV/3 TC/EFV § K 103 NLOW in 16/476 (3. 4%) patients § 6/16 (38%) of patients with K 103 NLOW had VF VF = virological failure Clinical virology VF (>400 c/m. L) K 103 N >2% or >2000 cps/ml predicts failure of first-line NNRTI-based HAART Fit plot for VF (>400 c/m. L) Fit 0. 5 99% confidence band VF 0 Non-VF -0. 5 -1 103. 3 = 1995 c/m. L 0 1 2 3 4 Log copies of RNA with K 103 N mutation Fit 1 99% confidence band VF 0. 5 0 Non-VF -0. 5 -1 0 2. 5 5 7. 5 10 12. 5 15 Percent of RNA with K 103 N mutation Goodman et al, IHDRW 2009
Conclusions-1 Ø Low risk of virological failure once suppression is achieved and maintained for 1 year Ø Consistent suppression <50 the optimal target Ø NNRTI-based HAART least likely to result in low-level viraemia and virological failure Ø Women at increased risk of virological failure § Problems with long-term adherence § Cultural and social-economic factors § Resistance testing at low VL yields clinically useful information
Conclusions-2 Ø Predominantly NNRTI-based HAART achieves excellent outcomes regardless of the infecting subtype Ø Subtype C patients show an increased risk of rebound possibly related to non-adherence
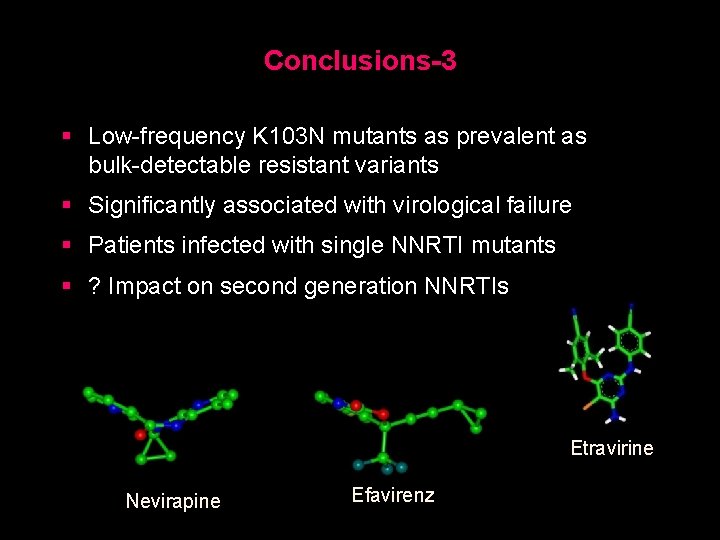
Conclusions-3 § Low-frequency K 103 N mutants as prevalent as bulk-detectable resistant variants § Significantly associated with virological failure § Patients infected with single NNRTI mutants § ? Impact on second generation NNRTIs Etravirine Nevirapine Efavirenz
a. geretti@medsch. ucl. ac. uk Thank you