
Virginia Law Enforcement Retention Brianna M Egan Lynchburg

Virginia Law Enforcement Retention Brianna M. Egan Lynchburg College Department of Criminology Center for Community Development and Social Justice April 2016
Statement of the Problem • For police executives, high turnover rates have threatened their ability to keep a sufficient number of well-trained, experienced officers on-duty. • Nationally, 1/3 of law enforcement officers leave within the first 3 years. • (Police Chief magazine, 2016) • Virginia average law enforcement turnover rate: • 2003 - 9. 56% • 2008 - 12. 53% • (Lambert, Smith, & Wareham, 2015) • Why is the retention of officers better for some law enforcement agencies?
Literature Review • Patterns typically demonstrate that a recruit is hired, trained, and then works within that department until they resign and begin employment within a different facility. • (Hohm & Griffeth, 2000) • Primary factors for retention: • Rate of pay • New equipment • Further opportunities • (Hohm & Griffeth, 2000)
Expectancy Theory of Motivation • Individuals: • Focused on self-interest • Leads to them adopting courses of action that maximize their probability of gaining desirable outcomes for themselves. • (Isaac, Zerbe, & Pitt, 2001) • Management: • Engage in external rewards that encourage employees to remain in their current place of work. • (Bowman, 2006)
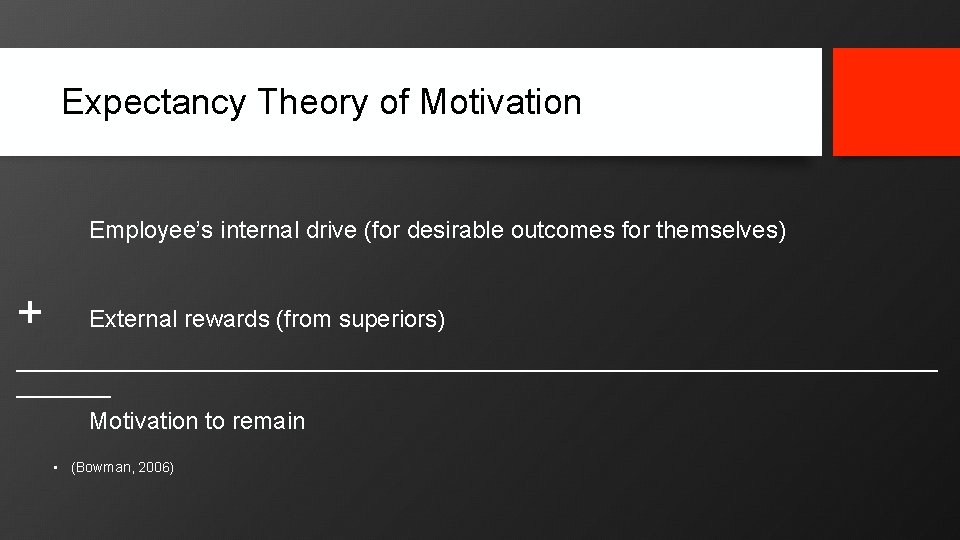
Expectancy Theory of Motivation Employee’s internal drive (for desirable outcomes for themselves) + External rewards (from superiors) ___________________________________ Motivation to remain • (Bowman, 2006)
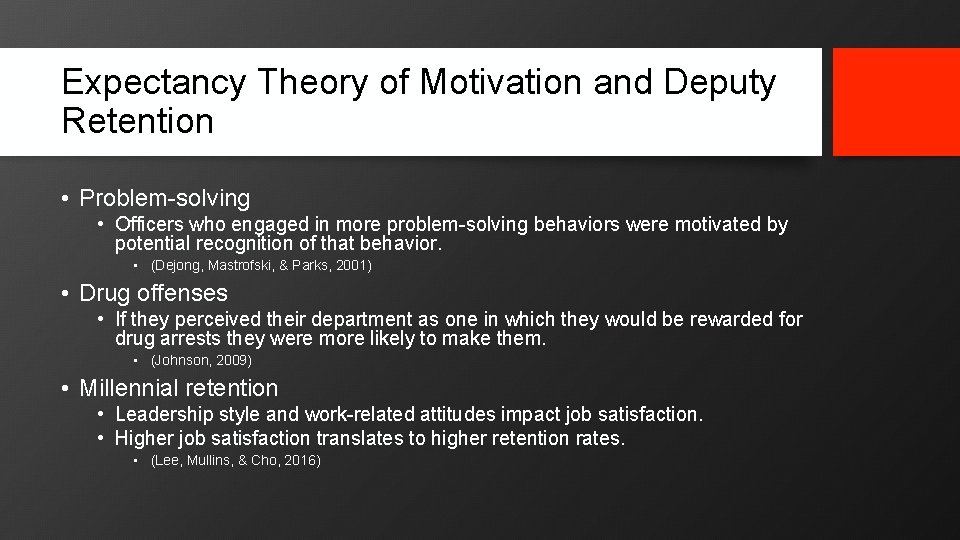
Expectancy Theory of Motivation and Deputy Retention • Problem-solving • Officers who engaged in more problem-solving behaviors were motivated by potential recognition of that behavior. • (Dejong, Mastrofski, & Parks, 2001) • Drug offenses • If they perceived their department as one in which they would be rewarded for drug arrests they were more likely to make them. • (Johnson, 2009) • Millennial retention • Leadership style and work-related attitudes impact job satisfaction. • Higher job satisfaction translates to higher retention rates. • (Lee, Mullins, & Cho, 2016)
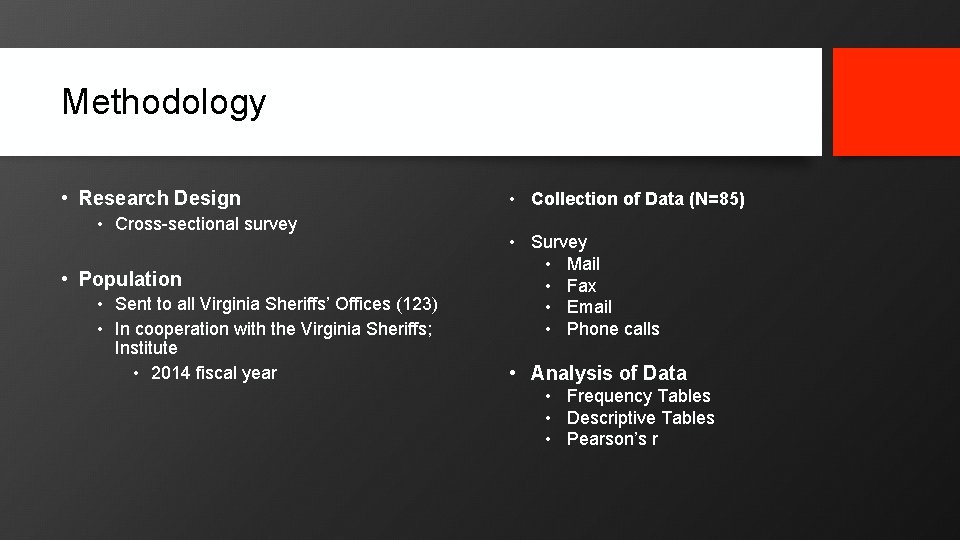
Methodology • Research Design • Cross-sectional survey • Population • Sent to all Virginia Sheriffs’ Offices (123) • In cooperation with the Virginia Sheriffs; Institute • 2014 fiscal year • Collection of Data (N=85) • Survey • Mail • Fax • Email • Phone calls • Analysis of Data • Frequency Tables • Descriptive Tables • Pearson’s r
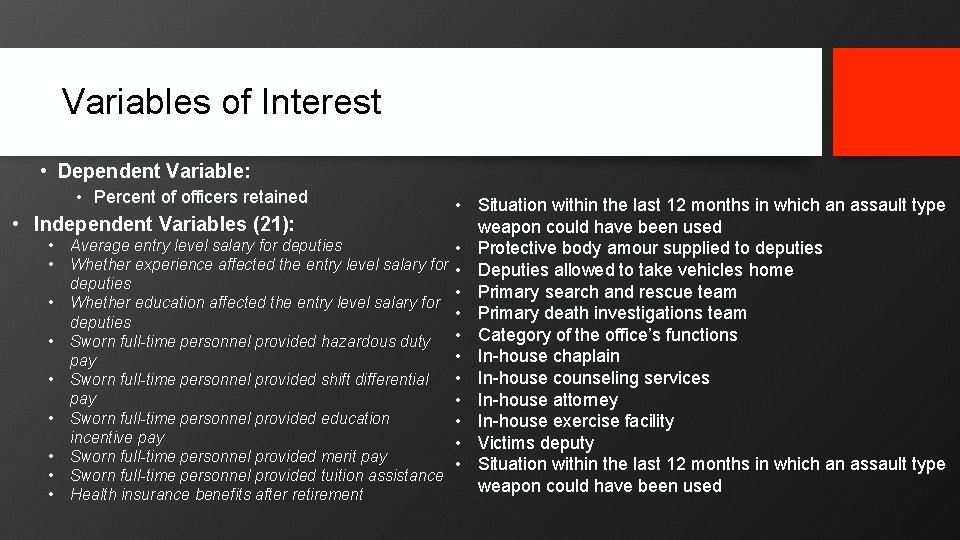
Variables of Interest • Dependent Variable: • Percent of officers retained • Situation within the last 12 months in which an assault type • Independent Variables (21): weapon could have been used • Average entry level salary for deputies • Protective body amour supplied to deputies • Whether experience affected the entry level salary for • Deputies allowed to take vehicles home deputies • Primary search and rescue team • Whether education affected the entry level salary for • Primary death investigations team deputies • Category of the office’s functions • Sworn full-time personnel provided hazardous duty • In-house chaplain pay • In-house counseling services • Sworn full-time personnel provided shift differential pay • In-house attorney • Sworn full-time personnel provided education • In-house exercise facility incentive pay • Victims deputy • Sworn full-time personnel provided merit pay • Situation within the last 12 months in which an assault type • Sworn full-time personnel provided tuition assistance weapon could have been used • Health insurance benefits after retirement
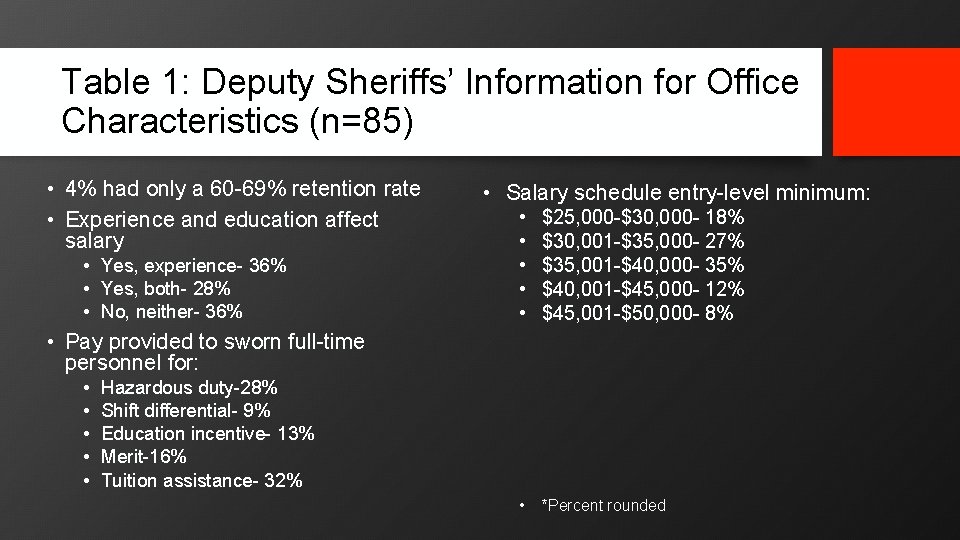
Table 1: Deputy Sheriffs’ Information for Office Characteristics (n=85) • 4% had only a 60 -69% retention rate • Experience and education affect salary • Yes, experience- 36% • Yes, both- 28% • No, neither- 36% • Salary schedule entry-level minimum: • • • $25, 000 -$30, 000 - 18% $30, 001 -$35, 000 - 27% $35, 001 -$40, 000 - 35% $40, 001 -$45, 000 - 12% $45, 001 -$50, 000 - 8% • *Percent rounded • Pay provided to sworn full-time personnel for: • • • Hazardous duty-28% Shift differential- 9% Education incentive- 13% Merit-16% Tuition assistance- 32%
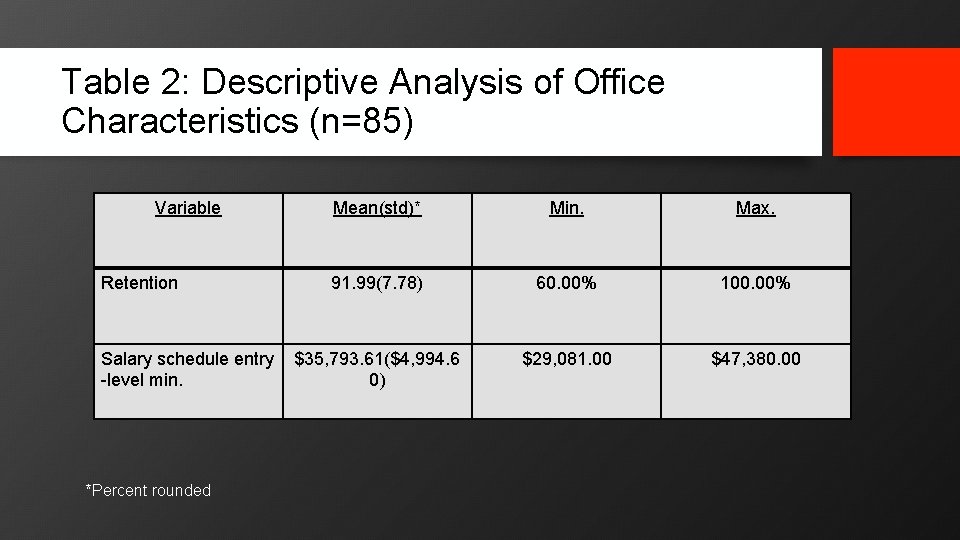
Table 2: Descriptive Analysis of Office Characteristics (n=85) Variable Retention Salary schedule entry -level min. *Percent rounded Mean(std)* Min. Max. 91. 99(7. 78) 60. 00% 100. 00% $35, 793. 61($4, 994. 6 0) $29, 081. 00 $47, 380. 00
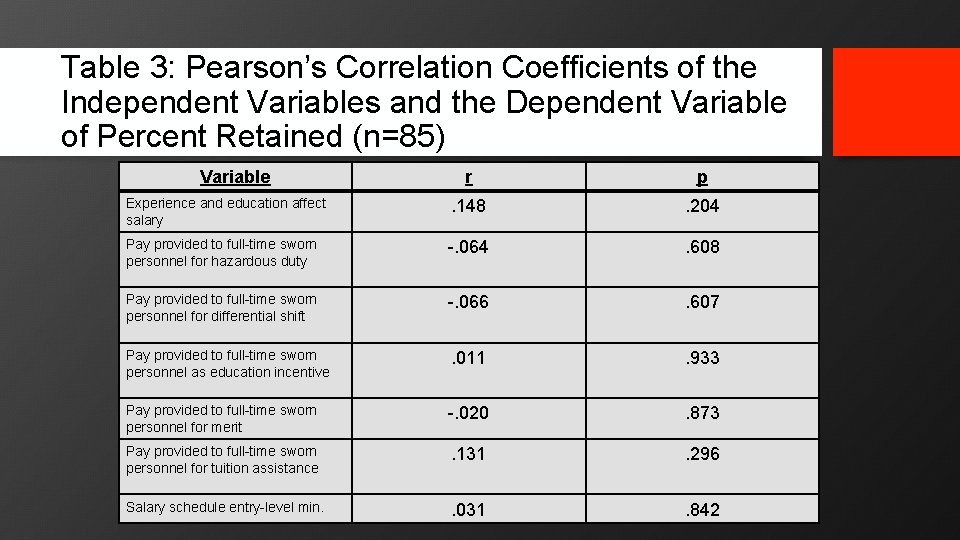
Table 3: Pearson’s Correlation Coefficients of the Independent Variables and the Dependent Variable of Percent Retained (n=85) Variable r p Experience and education affect salary . 148 . 204 Pay provided to full-time sworn personnel for hazardous duty -. 064 . 608 Pay provided to full-time sworn personnel for differential shift -. 066 . 607 Pay provided to full-time sworn personnel as education incentive . 011 . 933 Pay provided to full-time sworn personnel for merit -. 020 . 873 Pay provided to full-time sworn personnel for tuition assistance . 131 . 296 Salary schedule entry-level min. . 031 . 842
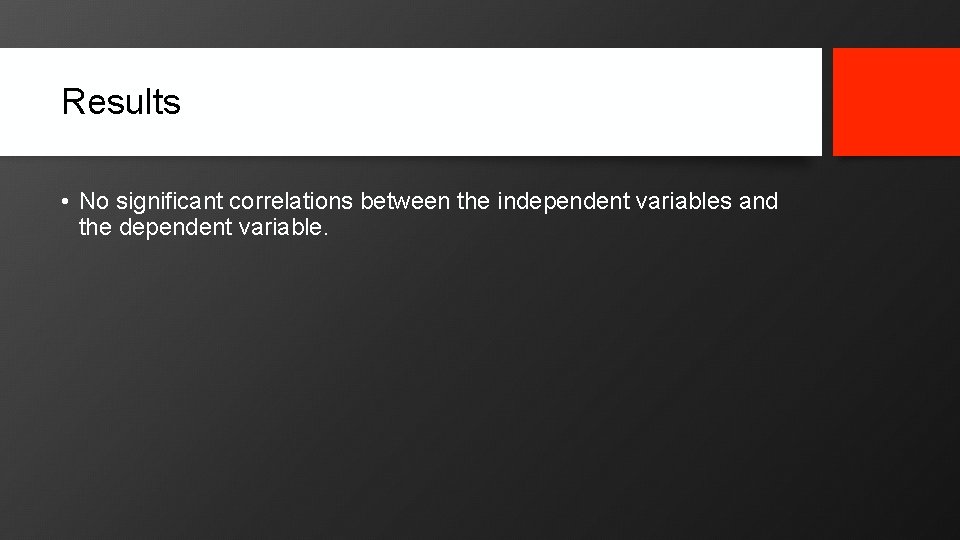
Results • No significant correlations between the independent variables and the dependent variable.
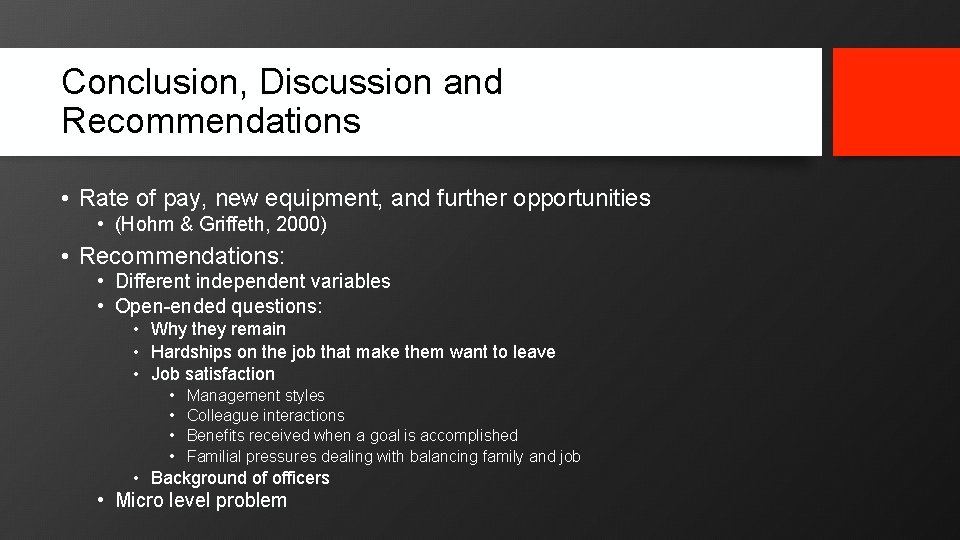
Conclusion, Discussion and Recommendations • Rate of pay, new equipment, and further opportunities • (Hohm & Griffeth, 2000) • Recommendations: • Different independent variables • Open-ended questions: • Why they remain • Hardships on the job that make them want to leave • Job satisfaction • • Management styles Colleague interactions Benefits received when a goal is accomplished Familial pressures dealing with balancing family and job • Background of officers • Micro level problem
Limitations • Only tested 21 variables of a possible 60+ • Closed-ended questions • Responses from elected officials

Questions? !
- Slides: 15