Vindkraft og fugl Erfaringer fra Smla Norge Hvor


")
 Fase")


 5 1 1 2 3 2 1")
 4 1 1 1 9 5 5")
 for havørner funnet drept i Smøla vindpark www. nina. no")


 in")


")


 of radio-collared ptarmigan die due")


 • Geomorfological classification (landscape")


 Gulls (Laridae) Skimmers (Rynchops)")


- Slides: 54
Vindkraft og fugl. Erfaringer fra Smøla, Norge — Hvor stort er problemet? — Kan noe gjøres for å redusere skader på fuglelivet? Torgeir Nygård Roel May
Arbeidet har foregått i to faser. Fase I: Bird. Wind – for å forstå konflikten • Pre- and post-construction studies of conflicts between birds and wind turbines in coastal Norway • 23 millioner NOK, perioden 2006 -2011 • Finansiert av Norges Forskningsråd, Statkraft, NVE, Energi Norge, RSPB Photo: • Conference of Wind energy and Wildlife T. Nygård impacts (CWW-serie annenhvert år, 200 -300 deltagere) www. nina. no
Vindkraft kan ha negative miljøkonsekvenser • En konsekvens er fugledød fra kollisjon mellom fugl og rotorblader og turbintårn • Hvor stor er denne effekten? • Hvordan kan vi redusere den? www. nina. no
Smøla vindkraftanlegg 250 km/h Diam. 82 m 68 2 -2. 3 MW turbiner (20022005) 18 km² areal 28 km veier 15 km kraftlinjer www. nina. no 70 m 110 m
Smøla vindkraftanlegg Eid av Statkraft Fase I: 2002 (20 x 2. 0 MW) Fase II: 2005 (48 x 2. 3 MW) Produksjonskapasitet 150 MW Årlig produksjon ~400 GWh
• Hva er konflikten? Sårbare arter – Atferd og livshistorie • Havørn (havsörn, white-tailed eagle). Stor rovfugl som ofte bruker luftrommet i rotorhøyde til jakt og territoriehevding. Mye seilflukt. Lav reproduksjon. 4 -5 år før den er kjønnsmoden, produksjon ca. 0, 5 unger/år • Lirype (dalripa, willow ptarmigan). Beveger seg mye på bakken, men rask, rettlinjet lav flukt når den blir skremt. Dårlig manøvreringsevne. Kjønnsmoden ved 1 år. Store kull, stort reproduksjonspotensiale. Havørn Lirype
Metoder for datainnsamling Observasjoner av atferd Søk etter døde fugler med trenede hunder GPS-merkede ørner Automatisk videoovervåking nær turbiner Overvåking av fluktaktivitet ved bruk av radar
Flygeatferd hos havørn: • Resultat: Ingen endring i flygeatferd inne i kontra utenfor vindparken på Smøla, hverken i type flukt eller flygehøyde
Søk etter kollisjonsofre: Havørnas status: IUCN Cites, Annex 1. Sårbarhet: Kollision med rotorblader
Søk etter kollisjonsofre: Lirype Lirypas status: På den norske Rødlista Sårbarhet: Kollision med turbintårn. www. nina. no
Rypefangst i Norge 1991 -2014 www. nina. no
Fra august 2006 til Mars 2017, 75 havørner ble funnet drept av turbiner, fire av dem satellittmerkede ungfugler. Siden da har tallet økt til 88 (mai 2018).
• Totalt 480 individer av fugl funnet 2006 -2017, fordelt på 40 arter Lirype (201), havørn (75) og enkeltbekkasin (32) dominerte blant de drepte fuglene 2006 -17. I tillegg to kongeørn og en jaktfalk. www. nina. no
Fordelingen av drepte havørner (N = 75) 5 1 1 2 3 2 1 1 2 4 2 1 2 Inner 1 Outer 1 1 2 1 3 1 2 3 3 1 23 drept i indre område, 49 i ytre Chi-Square test Indre/Ytre P = 0, 008 2 1 www. nina. no 1 1 3 2 1 1 2 2 2 1 1 2
Fordelingen av drepte liryper (N = 196) 4 1 1 1 9 5 5 5 6 3 1 7 1 5 4 1 11 3 1 4 3 3 2 1 1 4 2 4 1 1 5 2 1 4 2 1 2 6 11 3 5 2 www. nina. no 2 2 3 3 4 5 3 2 1 5 1 3 4 5 2 2 6 92 i indre 104 i ytre Chi-Square test Indre/Ytre P = 0, 09, N. S.
Avstand fra turbintårn (m) for havørner funnet drept i Smøla vindpark www. nina. no
Satellittmerking av unge havørner
Altitude of flying juvenile sea-eagles by hour and season, as determined by the GPS transmitters. 24 % of the flights were in the rotor-swept zone 24 % in rotor heigth
Risks by night roost sites close to the wind-farm Roost sites in the wind -farm area. Red = morning GPS tracks, Turbine 21, blue = 5 dead WTE evening GPS tracks www. nina. no
All GPS positions, 71 juvenile White-tailed eagles with backpack PTTs, 446, 000 positions
Cyclic movement behaviour of young WT eagles. In general they move out (north) in the summer, and come back for the winter. www. nina. no
Risks from neighbouring wind-farms The birds use wide areas. One bird from Smøla shown here, also visited the neighbouring Hitra wind-farm, and the proposed Wind-farm site on Frøya Hitra Smøla www. nina. no
Seasonal variation of White-tailed eagles killed in Smøla wind-farm. More than half of the birds were killed during spring; the high risk season Winter N = 4 (5%) www. nina. no Spring Summer Autumn N = 46 (60%) N = 13 (17%)
Age in calendar years of White-tailed eagles killed in Smøla wind-farm. More than half of the birds are adults (53 %), which has population implications Juveniles Sub-adults N = 14 N = 20 www. nina. no Adults N = 38
Effekter på populasjonsdynamikk hos havørn. BACI design: Before-After-Control-Impact. Map of the study area showing the white-tailed eagle nest sites in the study period (dots), as well as the turbines in the power plant (stars) and the 1 -, 3 and 5 km buffer zones around the wind-power plant. • Ca. 50 Sea-eagle territories in the whole Smøla area • Before construction: ~ 10 WTE territories in the wind-farm area, now only two active. • A baseline of preconstruction breeding data for the Sea-Eagle existed www. nina. no
Bruk av DNA-markører Adult turnover at nest sites: Use of DNA microsatellites from moulted feathers for individual recognition. Feathers of juveniles and adults are analysed to reveal adult turnover at nests, and to identify origin of killed birds Many of the adult birds that were killed were not possible to assign to a known territory. They probably were «floaters» www. nina. no
Population effects: Annual adult survival in relation to distance from nest to wind-farm www. nina. no
Reproductive performance of WTE territories in relation to distance from park boundaries www. nina. no
Population effects: Finite range of propulation change in relation to distance from wind-farm www. nina. no
Fase II: INTACT INnovative Tools to reduce Avian Collisions with wind Turbines (2013– 2016) How can we reduce the problem of bird collisions at wind farms?
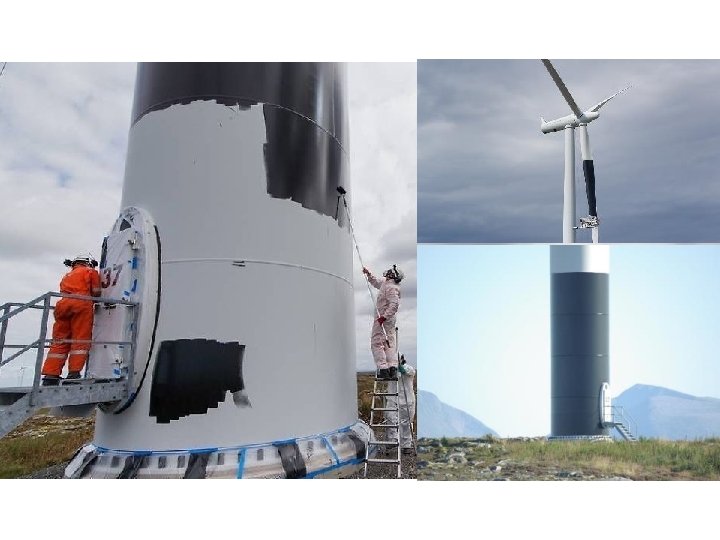
WP 1: Experimentally test visual mitigation measures to reduce bird collisions • Applying contrast paint on one of three rotor blades at four turbines (2013) • Applying contrast paint on four tower bases (10 m)(increased to 10 in 2015) • In-situ monitoring of bird activity, behavioural • Registering casualties www. nina. no
Positions of the turbines selected for experiments rotor blade turbine base video, DTBird added 2015
Ptarmigan: telemetry and collisions • Large proportion (ca. 30%) of radio-collared ptarmigan die due to collision with turbine tower bases • Mitigating measure: contrast painting on tower bases (10 m) www. nina. no
Note the change in direction in the number of bird tracks at painted turbines, relative to control turbines, before and after painting.
Effekt av maling av turbinblad? • Døde havørner • Før • Etter Malt Kontroll 6 0 1 0 • Materialet er for lite til å konkludere
GPS telemetry white-tailed eagles • New technology: GPS/GSM-satellite transmitters for white-tailed eagles Use GPS positioning and GSM base stations for transfer of the positions to NINA using World Wide Roaming Can store up to 250, 000 positions when outside range of a base station, and will transmit the data when it is within range of any base station Are able to get a position down Time elapsed between transmitted positions, in to every 60 seconds relation to time of day Enables much more detailed studies of eagle movement than before www. nina. no
Distance from the nest of GPS-tagged juvenile eagles by number of days after tagging. They start to move away from the nest between 50 and 60 days after.
Positions of GPS-tagged Juvenile WTEs > 60 days after tagging
Frequency of bird tracks as seen by Avian radar Painted blades Painted turbine base When the difference falls below the red line = less bird tracks at painted turbines
WP 2: Develop a model for post-construction operational adjustment of cut-in speeds • Aim: A probabilistic spatio- temporal operational mitigation model What conditions affect flight activity in space and time? Variation in flight risk Variation in turbine risk Forecast Flight risk x Turbine risk • Real-time tool using radar Relevant for migration hotspots, or areas with short high peaks of risk www. nina. no
Turbine cut-in speed & bird activity Whole year Spring, daytime Over the entire year (left-hand panel) bird activity, measured as the number of bird tracks recorded by the radar, drops below the average at wind speeds over 7. 4 m/s. For the spring months (March, April and May) during daytime (08: 00 – 20: 00) bird activity decreases towards the average at 3. 7 m/s, and stays there until wind speeds of 11. 3 m/s (right-hand panel). www. nina. no
An example… Measure Production loss • Increase cut-in speed to 8 m/s: 50% • Only during spring (3 of 12 months): 12. 5% • Only during daytime (12 of 24 hours): 6% • "Problem turbines" (34/68 turbines): • Two outermost rows: (14/68 turbines: <1% www. nina. no 3%
WP 3: Develop a stand-alone GIS micro-siting tool to designate ‘risky’ turbine locations Purpose: - Map and avoid sites of specific avian interest - Minimize bird-turbine collision risk through pre- construction siting - Bird-friendly turbine siting enhances socio- economic effectiveness - Reduce uncertainty in decision-making regarding design of wind-power plants - Predict, document and re-examine impacts www. nina. no
INTACT Wind-turbine Micro-siting Toolbox 1. Landscape Orientation Toolbox (migration ways) • Geomorfological classification (landscape metrics) • Topografical and hydrological orientation 2. Updraft Estimation Toolbox (soaring birds of prey) • Orographic updraft velocity based on DEM and proxy wind data • Thermal updraft velocity based on Land. Sat 8 thermal band 3. Avian Site Risk Toolbox • Weigthing of maps from the two first toolboxes • Calculate relative risk distribution for raptors
Integration: Avian site risk W SW Orographic updraft NW Topographic features Thermal updraft River features
Integration: Avian site risk Normalised risk map Map shows relative risk distribution for raptors in the Hitra wind-power plant
WP 4: Assess the feasibility of using a UV light-fence to deter birds from wind turbines www. nina. no
UV sensitive species • Species with UVS (355 -380 nm) Gulls (Laridae) Skimmers (Rynchops) Terns (Sternidae) [Ödeen et al. 2010, Biol. Lett. ] • Noddies (Anous) • White tern (Gygis) Passerines (Passeriformes) [Lind et al. 2013, Proc. R. Soc. B] • Species with VS (402 -426 nm) Petrels (Procellariidae) Pelicans (Pelecanidae) Gannets (Sulidae) Terns (Sternidae) [Håstad et al. 2005, Biol. Lett. ] • Terns (Sterna) Raptors and owls (Falconiformes, Strigiformes) • Eagles (Aquila) Gallinaceous birds (Galliformes) www. nina. no [Lind et al. 2013] [Doyle et al. 2014, PLOS One] [Ödeen & Håstad 2011, BMC Evol. Biol. ]
UV-test: Results • Effect of UV-lights on number of bird tracks at different altitudes Quasi-Poisson regression (glmer): N ~ D + A*TYPE * * www. nina. no * *
Conflict reduction from the planning process to decommissioning • Pre-construction wind farm design • Repowering • Scoping process • Consensus-based Siting (Con. Site)
Konklusjoner Gode forundersøkelser nødvendig for godt stedsvalg Hekkeområder for sårbare fugler må unngås Høy dødelighet hos arter med lav reproduksjonsrate og sen kjønnsmodning kan føre til lokal populasjonsnedgang Kontrastmaling på tårn og rotorblad kan øke synligheten og redusere kollisjonsfaren Nedstenging av problemturbiner i kritiske perioder kan spare mange fugleliv og kan koste lite. Kan kombineres med radar UV-lys kan virke på korte avstander, men ikke på lengre Ved hjelp av spesiell software i planleggingsprosessen kan konflikter ved plassering av vindkraftverk minimeres www. nina. no
Takk for oppmerksomheten!