Victor Babes UNIVERSITY OF MEDICINE AND PHARMACY TIMISOARA

“Victor Babes” UNIVERSITY OF MEDICINE AND PHARMACY TIMISOARA DEPARTMENT OF MEDICAL INFORMATICS 2005 / 2006

“Medical Scientific Research Methodology” “MCS” 2 nd Module Course 2

1. RISK AND 2. PROGNOSTIC FACTORS 3. ANALYSIS
 DEFINITION : – Hypothetical cause for disease occurrence")
1. 1. RISK FACTORS • a) DEFINITION : – Hypothetical cause for disease occurrence or facilitation – b) CLASSIFICATION : • Environmental factors • Social • Behaviorial • Biological

1. 2. METHODS – A- EXPERIMENTAL • RISK FACTOR CONTROL • DISADVANTAGE: ETHICAL REASONS – B- OBSERVATION-BASED
 TRANSVERSAL (CROSS – SECTIONAL) – Moment situation in a large sample")
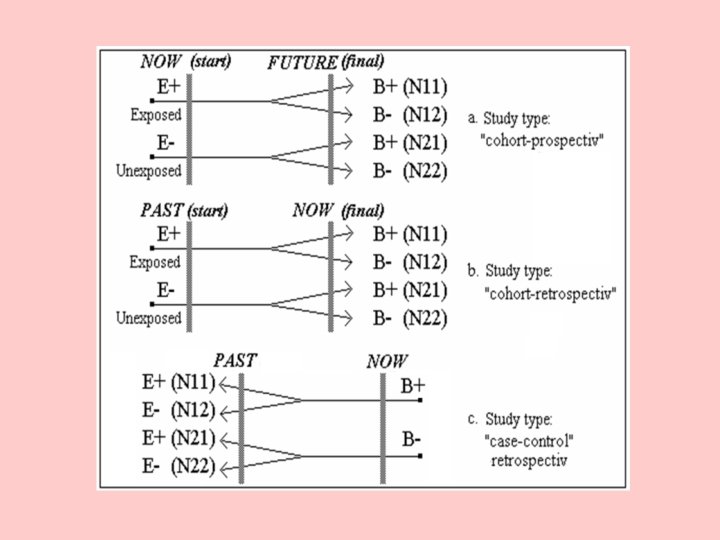
• a) TRANSVERSAL (CROSS – SECTIONAL) – Moment situation in a large sample • b) LONGITUDINAL (Evolution in time) – – – – COHORT Two groups: Exposed / Unexposed Prospective [Cohort retrospective] CASE - CONTROL Two groups: Disease / No-disease Retrospective Comparison: – EXP > COH. pr. > COH. ret. > CASE-C. > CR. S.
 Cross sectional, Cohort and Case-Control independent samples (unpaired)")
1. 3. CONTINGENCY TABLES a) Cross sectional, Cohort and Case-Control independent samples (unpaired)
 Paired (matched) groups – cohort N 11, N 12, N 21, N 22")
b) Paired (matched) groups – cohort N 11, N 12, N 21, N 22 = pairs (expl)
 Paired (matched) groups – case-control N 11, N 12, N 21, N 22")
c) Paired (matched) groups – case-control N 11, N 12, N 21, N 22 = pairs (expl)
: R (E+) =")
1. 4. FONDAMENTAL PARAMETERS IN EPIDEMIOLOGY • ABSOLUTE RISK (‘success’ rate): R (E+) = p(D+/E+) = N 11 / L 1 R (E-) = p(D+/E-) = N 21 / L 2 • RELATIVE RISK (RR): RR = R(E+) / R(E-) RR = N 11. L 2 / N 21. L 1
 AR = P(D+/E+) – P(D+/E-)")
ATTRIBUTABLE RISK : (EXCESS OF RISK DUE TO EXPOSURE) AR = P(D+/E+) – P(D+/E-) POPULATION ATTRIBUTABLE RISK : (EXCESS OF RISK IN POPULATION) PAR = AR x P(E+) ATTRIBUTABLE FRACTION: (AR %, ETIOLOGICAL FRACTION) AFE = AR/P(D+/E+) = (RR-1)/RR POPULATION ATTRIBUTABLE FRACTION: (PAR %, TOTAL ETIOLOGICAL FRACTION) AFT = PAR/P(D+)
: - for cohort: ODD (D+/E+) = P(D+/E+)/P(D-/E+)")
• ‘ODD’ INDEX (‘success / failure’): - for cohort: ODD (D+/E+) = P(D+/E+)/P(D-/E+) = N 11 / N 12 ODD (D+/E-) = P(D+/E-)/P(D-/E-) = N 21 / N 22 - for case-control: ODD (E+/D+) = P(E+/D+)/P(E-/D+) = N 11 / N 21 ODD (E+/D-) = P(E+/D-)/P(E-/D-) = N 21 / N 22
 – independent groups – for cohort OR = ODD(D+/E+)")
• ODDS RATIO (OR) – independent groups – for cohort OR = ODD(D+/E+) / ODD(D+/E-) – for case-control OR = ODD(E+/D+) / ODD(E+/D-) OR = N 11. N 22 / N 21. N 12
 – matched groups – for cohort OR = ODD(D+/E+)")
• ODDS RATIO (OR) – matched groups – for cohort OR = ODD(D+/E+) / ODD(D+/E-) – for case-control OR = ODD(E+/D+) / ODD(E+/D-) OR = N 12 / N 21 • Usually OR > RR • If OR > 1 (RR > 1) ==> RISK !

Confidence Intervals • Limits for OR: UP = upper limit, LL = lower… – for 95%: ln (UL & LL) = ln (OR) ± 1. 96 x • Accept RISK if the whole interval (LL, UL) >1

 Statistical")
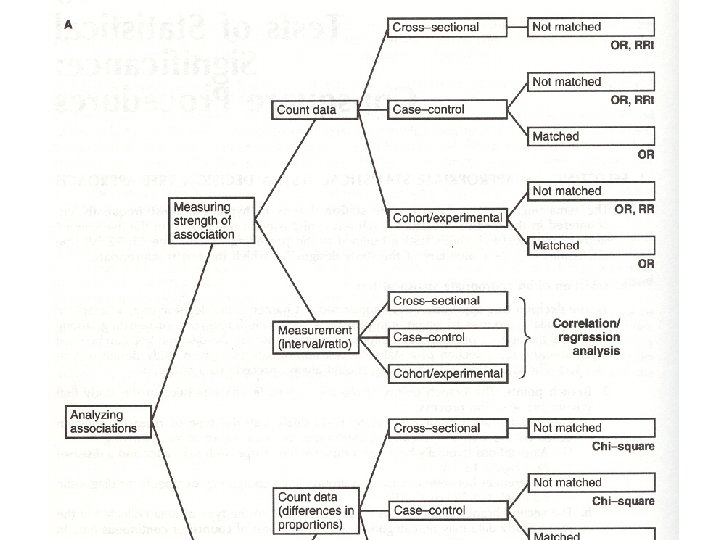
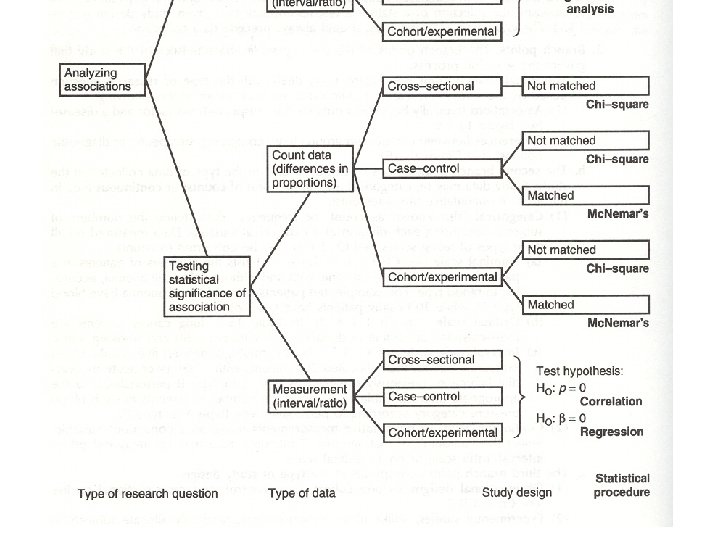
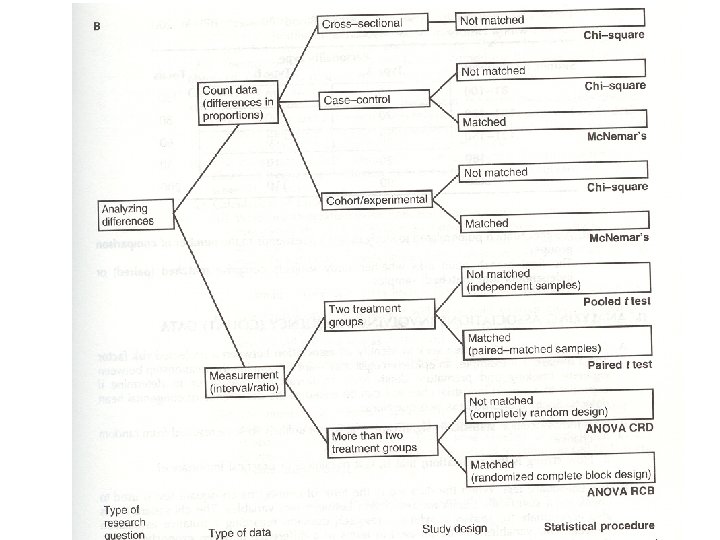
2. Biostatistics chapters • • Introduction: variables, samples Statistical parameters (of a sample) Statistical estimation (for a population) Statistical tests (comparison – differences) Correlation and regression (association) Epidemiological studies (risk, association) Special applications Survival analysis (time series) Sequencial analysis (bioinformatics) Health statistics
 population, individual – b)")
2. 1. STATISTICAL INFERENCE • A. GENERAL CONCEPTS – a) population, individual – b) definition: Biostatistics = science of estimating population characteristics and comparing populations – c) methods: • census - all individuals; the same time • screening - large number; selection criteria • sampling - subset of population
 STATISTICAL INFERENCE • EXTENDING PROPERTIES COMPUTED FOR A SAMPLE TO A POPULATION")
– d) STATISTICAL INFERENCE • EXTENDING PROPERTIES COMPUTED FOR A SAMPLE TO A POPULATION – e) REPRESENTATIVE SAMPLE • CRITERIA: – EQUIPROPBABILITY – INDEPENDENCE – f) SELECTION METHODS • SIMPLE SELECTION – RANDOM NUMBERS ASSOCIATED • MULTIPLE LAYER SELECTION • MIXED SELECTION – CLUSTERS
 DEFINITION: • a population characteristic which is studied")
• B. VARIABLES – a) DEFINITION: • a population characteristic which is studied and measured on all sampled individuals – b) STARTING A STUDY • variable selection • measurement accuracy • sample size – c) TYPES OF VARIABLES: • NUMERICAL • ORDINAL (rank) • NOMINAL (qualitative, count data)
 • •")
• C. STUDY DESIGN – Setting scope (hypothesis, objectives, study plan) • • variable selection measurement accuracy sample size choosing the processing method and accepted limits – Representative sample – Data collection – Preliminary data presentaion • tables • graphs (histograms, “pie”, lines, scatter, maps) – DATA PROCESSING - CONCLUSIONS – Writing the protocol and the paper (+ error estimation)


~ Pause ~
- Slides: 27