
Vibrio vulnificus Calculator VMCGulf Regulators Conference Call August
Vibrio vulnificus Calculator VMC/Gulf Regulators Conference Call August 1, 2008
ISSC adopted Vv illness reduction plan– 1999? • 60% illness reduction goal (per capita) • Core states: CA, TX, LA & FL • Baseline 1995 -1999: 21. 4 cases/yr • Education and increasing PHP capacity • 7 year plan with reductions based on ave # cases in 2007 & 2008
Current Status • 2007 cases=19 – 24. 8% reduction from baseline – Adjusted for population increase • 2008 partial cases=3 • Plan does not reach goal if 20 or more cases • • occur in 2007 & 2008 combined Goal will not be met Goal shortfall cannot be determined until after 2008
Consequences of not achieving goal • • Seasonal closures (100% effective) Diversion to PHP (100% effective) Label “for cooking only” OK for Vv? (100% effective) Other means? – Time/temperature controls – High salinity relaying • ISSC Spring Executive Board Mtg – Gulf States submit control plan by Aug. 15, 2008 (amended? ) – States implement plans in 2010
Time/Temperature Controls • GSASSC New Orleans June 2008 – Gulf regulators requested that FDA develop risk calculator similar to that proposed for VPCP • Vv Risk calculator – Based on 2005 FAO/WHO VVRA – Dose response based on reported cases in US
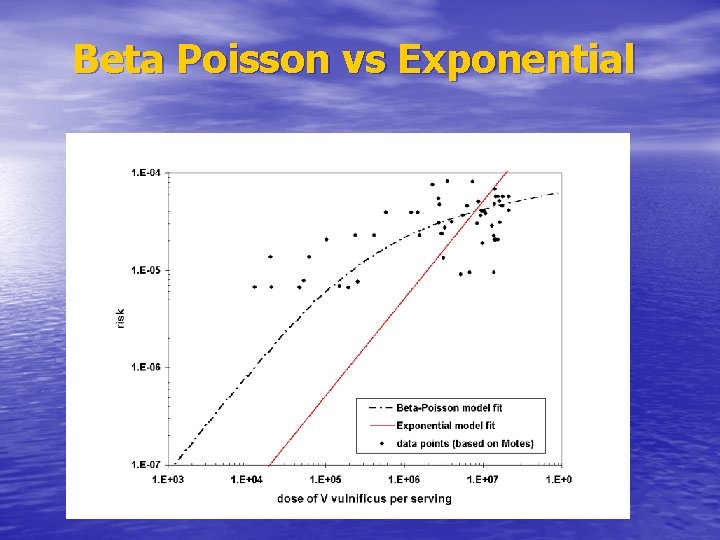
Beta Poisson vs Exponential
Vv Calculator Features • Derived from FAO/WHO VVRA – – Monte Carlo simulations Time consuming Expensive software Trained operators • Vv risk calculator – Based on regression fits to a set of Monte Carlo simulation output – Calculates Vv levels & risk instantly – Flexible to evaluate diverse scenarios and different end points for desired level of illness reduction
Average monthly maximum water temperature (AMMWT) • Determines Vv levels at harvest based on relationship between water temperature & Vv level from Vv risk assessment (VVRA) • State determines scale: area, basin or entire state (buoy, sampling) • Gulf-wide
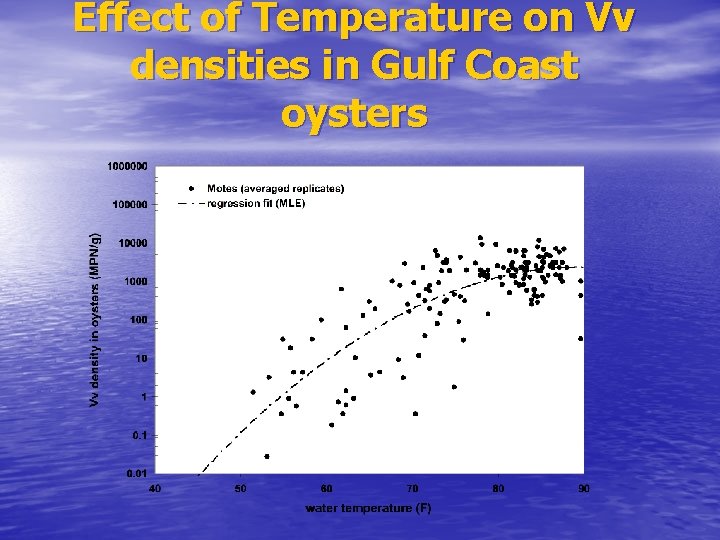
Effect of Temperature on Vv densities in Gulf Coast oysters
Average monthly air temperature • Surrogate for oyster temperature – Determines Vv growth rate • Ave. air temperature determination – Ave. monthly noon air temperature – Ave. monthly maximum temperature – Ave. monthly air temperature during harvest period (i. e. 6 -11 AM) – Ave. oyster temperature during harvest period
Baseline: max. time to refrigeration • Controls that were in place during the baseline period of 1995 -99 – Vary from state to state • Alternatively 10 h for summer month? – Represents control used for most Gulf oyster harvest
Baseline: Max cool down time • Time from when oysters are first placed into refrigeration until reach no growth temperature of 13 C or 55 F • 10 hour is assumption used in both FDA VPRA and FAO/WHO VVRA • Ave cool down between 1 to 10 hours
Demonstration of using Vv risk calculator • Baseline (1995 -99) controls • Effect of VPCP on Vv risk • Risk at harvest (best case scenario)
Calculator Inputs • Average monthly water temperature • Average monthly air temperature • Maximum time to first refrigeration • Maximum cool down time
Calculator Outputs • Vv levels at consumption • Vv risk per 100, 000 meals • Number of cases per month (Nation wide) • % change in number of cases from the baseline
Baseline Demonstration Open Excel Vv Calculator Tab

Effect of VPCP on Vv Risk <5 h if >81 F Tab
Vv Risk at Harvest Tab
Caveats • Dose response not linear & does not provide • • • outputs above 90 F and >15 h to first refrigeration Controls changed in 1997 during baseline period (1995 -99) Controls vary across Gulf states Implementation of VPCP in 2008 – Max. time to refrigeration – Changes in volume of harvest for raw consumption? • % raw consumption varies across Gulf states
Summary • Scenario analysis – Manage on monthly scale – Modify time to refrigeration and cool down times • Outputs – – Vv levels at consumption Vv risk per 100, 000 meals (at risk population) Expected number of cases Change from baseline
- Slides: 20