
Vibrational Relaxation of CH 2 Cl I in
Vibrational Relaxation of CH 2 Cl. I in Cold Argon Amber Jain Sibert Group 1
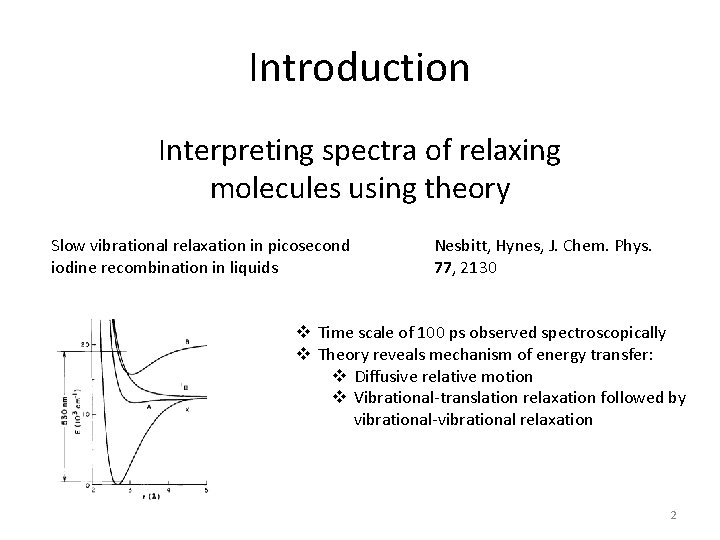
Introduction Interpreting spectra of relaxing molecules using theory Slow vibrational relaxation in picosecond iodine recombination in liquids Nesbitt, Hynes, J. Chem. Phys. 77, 2130 v Time scale of 100 ps observed spectroscopically v Theory reveals mechanism of energy transfer: v Diffusive relative motion v Vibrational-translation relaxation followed by vibrational-vibrational relaxation 2
Introduction Interpreting spectra of relaxing molecules using theory Slow vibrational relaxation in picosecond iodine recombination in liquids Nesbitt, Hynes, J. Chem. Phys. 77, 2130 A molecular dynamics simulation of NBr trapping in an argon matrix Fraenkel, Haas, Chem. Phys. Lett. 220, 77 A femtosecond study of the infrared-driven cistrans isomerization of nitrous acid Schanz, Botan, Hamm, JCP 122, 44509 The dynamical role of solvent on the ICN photodissociation reaction: connecting experimental observables directly with molecular dynamics simulations Rivera et al. Phys. Chem. Phys. 13, 8269 3
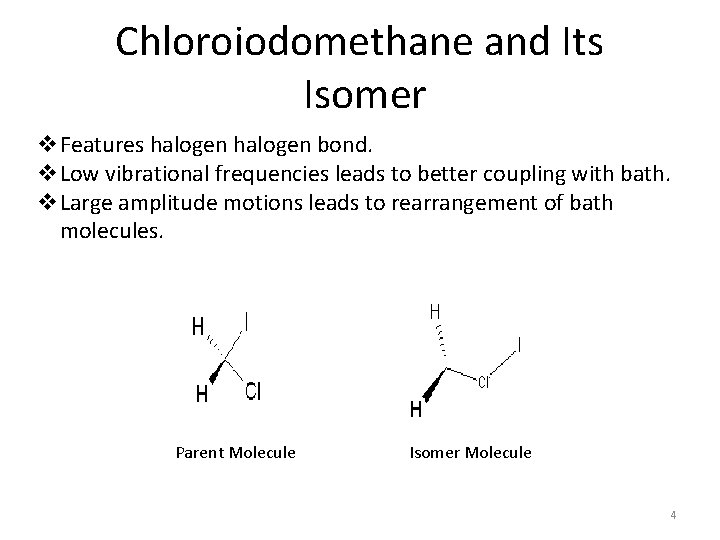
Chloroiodomethane and Its Isomer v. Features halogen bond. v. Low vibrational frequencies leads to better coupling with bath. v. Large amplitude motions leads to rearrangement of bath molecules. Parent Molecule Isomer Molecule 4
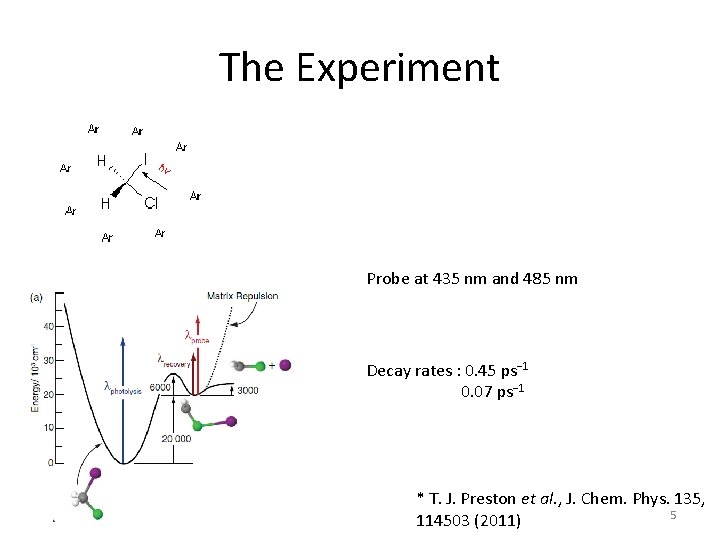
The Experiment 267 nm Probe at 435 nm and 485 nm Decay rates : 0. 45 ps− 1 0. 07 ps− 1 * T. J. Preston et al. , J. Chem. Phys. 135, 5 114503 (2011)
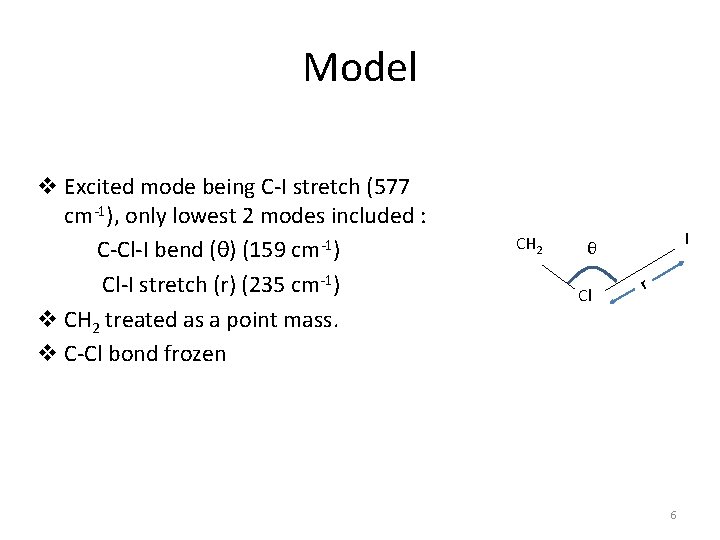
Model v Excited mode being C-I stretch (577 cm-1), only lowest 2 modes included : C-Cl-I bend (θ) (159 cm-1) Cl-I stretch (r) (235 cm-1) v CH 2 treated as a point mass. v C-Cl bond frozen CH 2 I θ Cl r 6
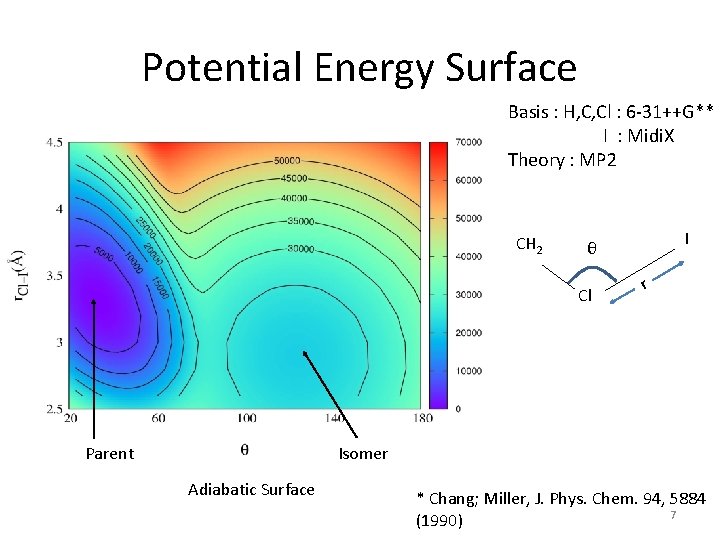
Potential Energy Surface Basis : H, C, Cl : 6 -31++G** I : Midi. X Theory : MP 2 CH 2 Cl Parent I θ r Isomer Adiabatic Surface * Chang; Miller, J. Phys. Chem. 94, 5884 7 (1990)
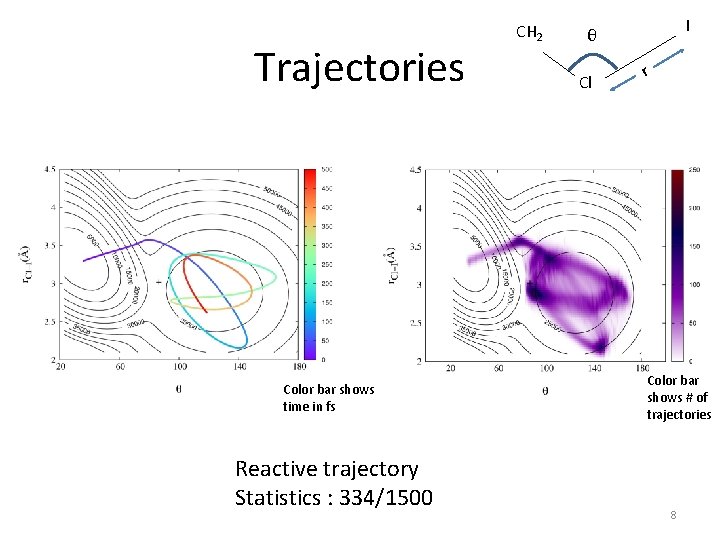
Trajectories Color bar shows time in fs Reactive trajectory Statistics : 334/1500 CH 2 I θ Cl r Color bar shows # of trajectories 8
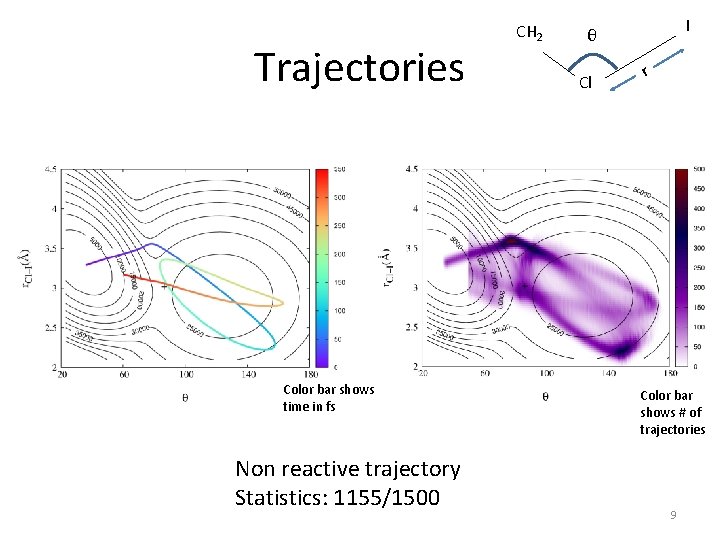
Trajectories Color bar shows time in fs Non reactive trajectory Statistics: 1155/1500 CH 2 I θ Cl r Color bar shows # of trajectories 9
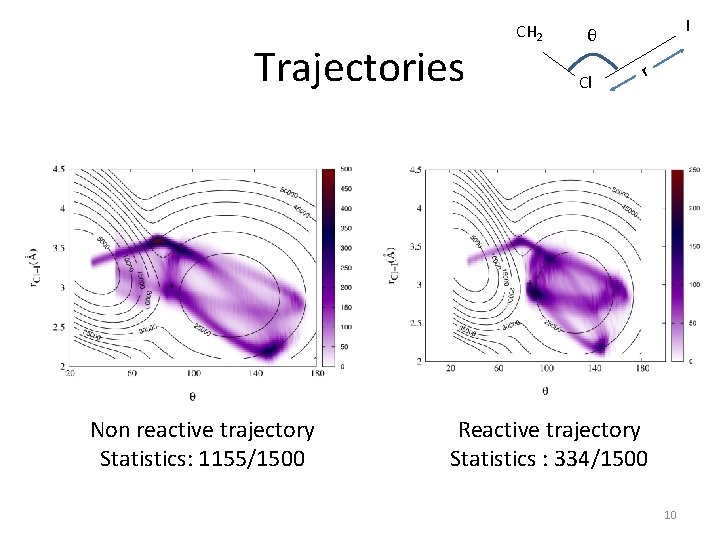
Trajectories Non reactive trajectory Statistics: 1155/1500 CH 2 I θ Cl r Reactive trajectory Statistics : 334/1500 10
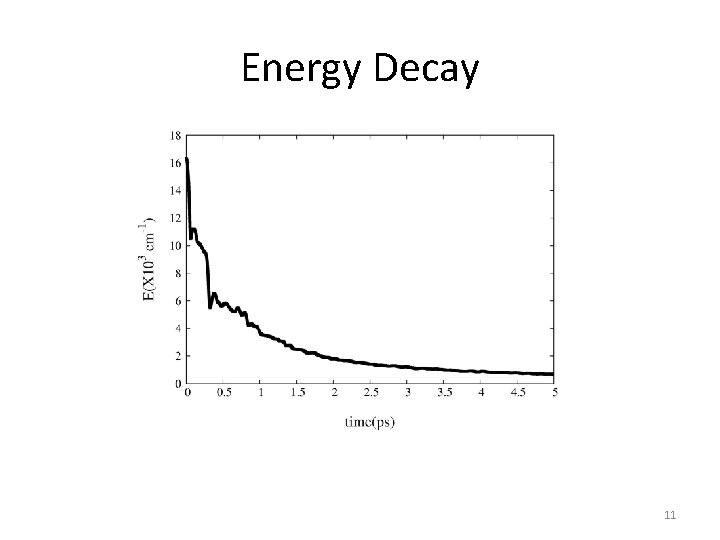
Energy Decay 11
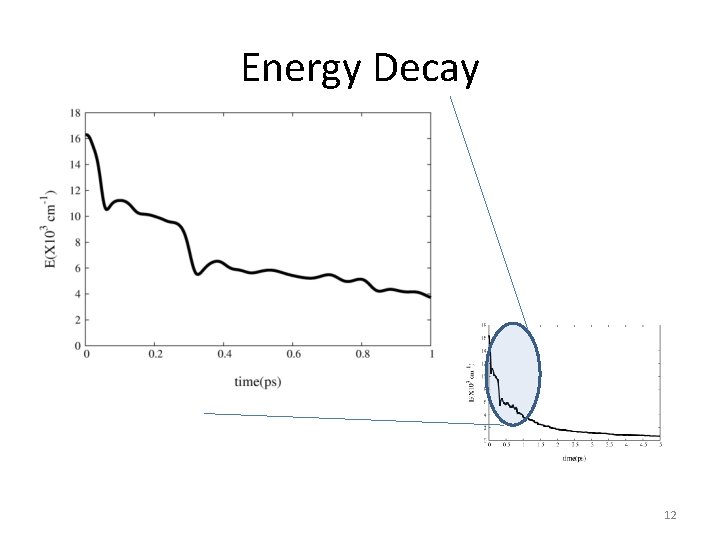
Energy Decay 12
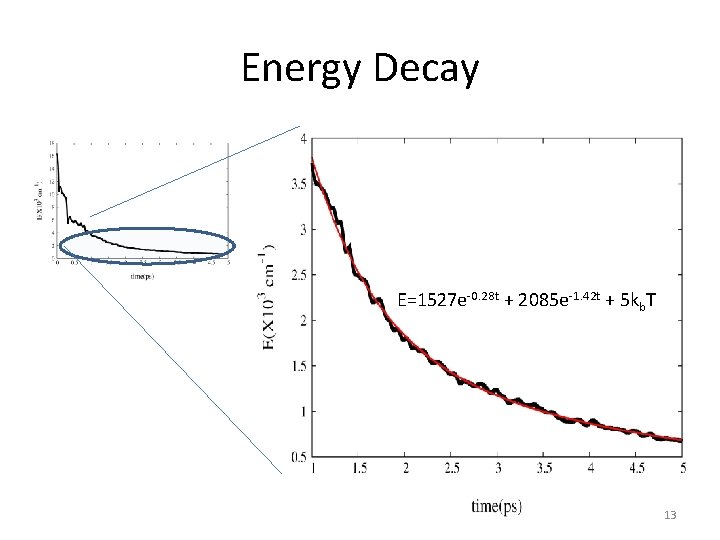
Energy Decay E=1527 e-0. 28 t + 2085 e-1. 42 t + 5 kb. T 13
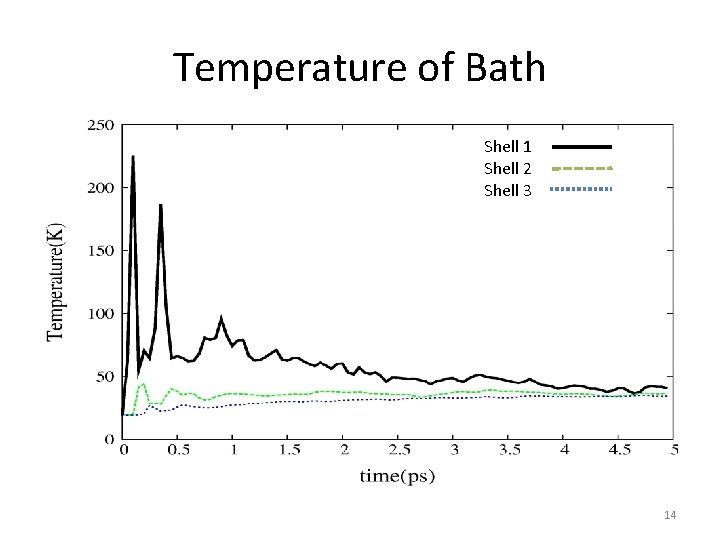
Temperature of Bath Shell 1 Shell 2 Shell 3 14
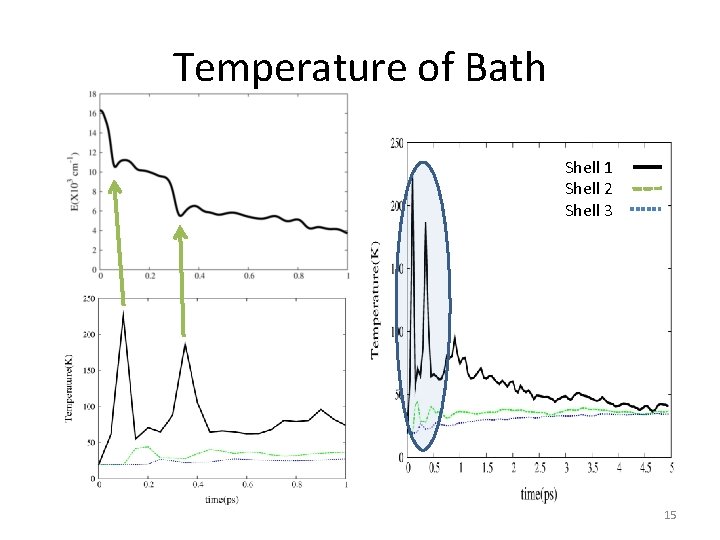
Temperature of Bath Shell 1 Shell 2 Shell 3 15
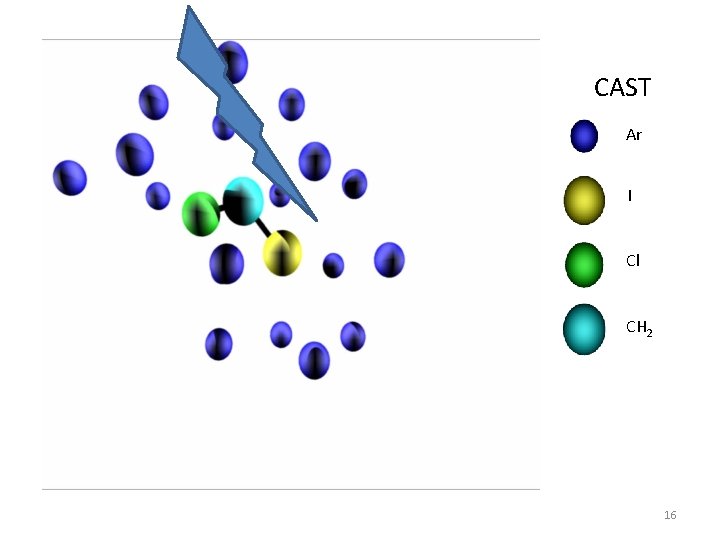
CAST Ar I Cl CH 2 16
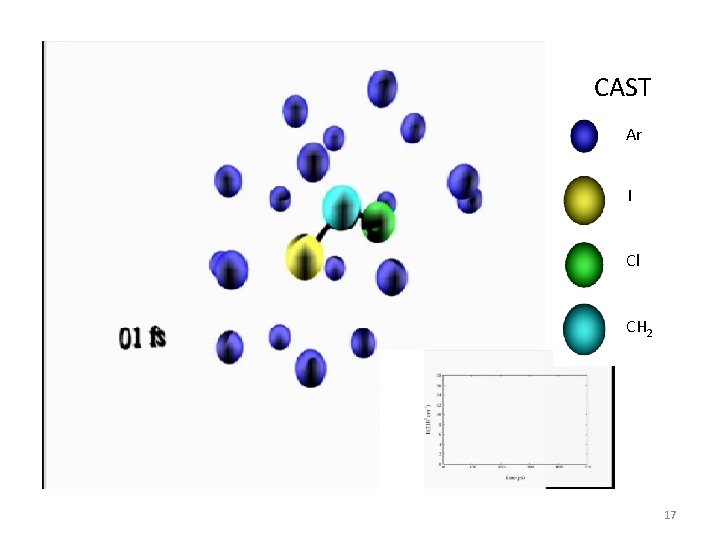
CAST Ar I Cl CH 2 17
Effect of Initial Conditions v Temperature of bath v Initial energy deposited in the molecule v Temperature quench 18
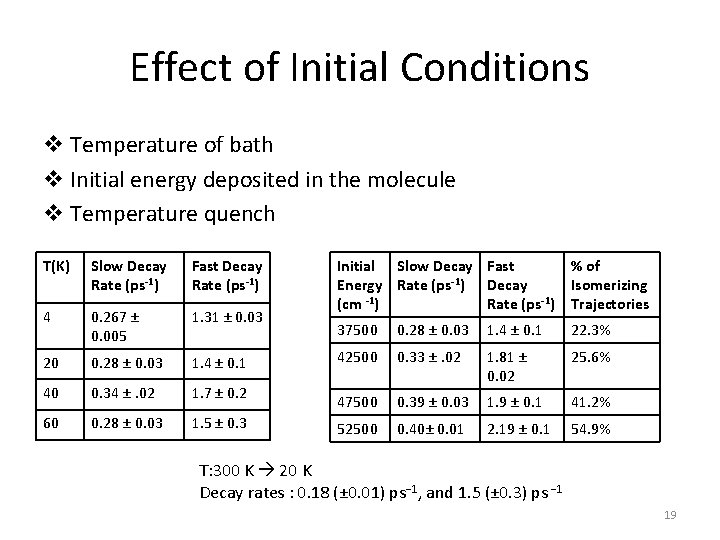
Effect of Initial Conditions v Temperature of bath v Initial energy deposited in the molecule v Temperature quench T(K) Slow Decay Rate (ps-1) Fast Decay Rate (ps-1) 4 0. 267 ± 0. 005 1. 31 ± 0. 03 20 0. 28 ± 0. 03 1. 4 ± 0. 1 40 0. 34 ±. 02 1. 7 ± 0. 2 60 0. 28 ± 0. 03 1. 5 ± 0. 3 Initial Slow Decay Fast Energy Rate (ps-1) Decay (cm -1) Rate (ps-1) % of Isomerizing Trajectories 37500 0. 28 ± 0. 03 1. 4 ± 0. 1 22. 3% 42500 0. 33 ±. 02 1. 81 ± 0. 02 25. 6% 47500 0. 39 ± 0. 03 1. 9 ± 0. 1 41. 2% 52500 0. 40± 0. 01 2. 19 ± 0. 1 54. 9% T: 300 K 20 K Decay rates : 0. 18 (± 0. 01) ps− 1, and 1. 5 (± 0. 3) ps − 1 19
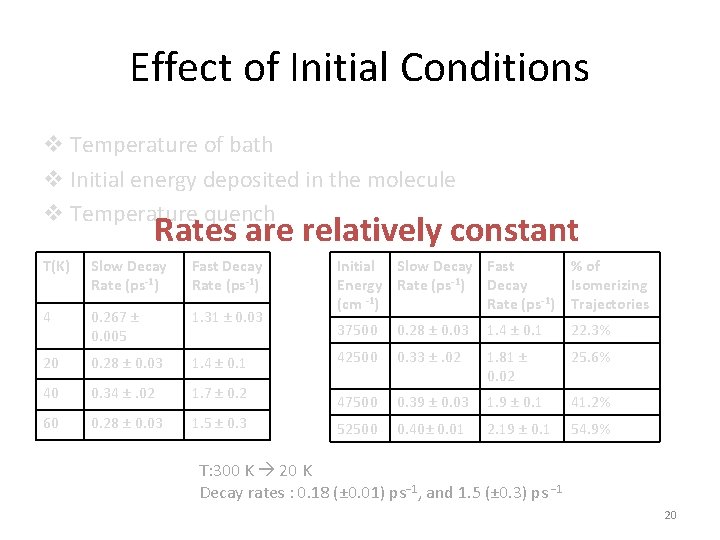
Effect of Initial Conditions v Temperature of bath v Initial energy deposited in the molecule v Temperature quench Rates are relatively constant T(K) Slow Decay Rate (ps-1) Fast Decay Rate (ps-1) 4 0. 267 ± 0. 005 1. 31 ± 0. 03 20 0. 28 ± 0. 03 1. 4 ± 0. 1 40 0. 34 ±. 02 1. 7 ± 0. 2 60 0. 28 ± 0. 03 1. 5 ± 0. 3 Initial Slow Decay Fast Energy Rate (ps-1) Decay (cm -1) Rate (ps-1) % of Isomerizing Trajectories 37500 0. 28 ± 0. 03 1. 4 ± 0. 1 22. 3% 42500 0. 33 ±. 02 1. 81 ± 0. 02 25. 6% 47500 0. 39 ± 0. 03 1. 9 ± 0. 1 41. 2% 52500 0. 40± 0. 01 2. 19 ± 0. 1 54. 9% T: 300 K 20 K Decay rates : 0. 18 (± 0. 01) ps− 1, and 1. 5 (± 0. 3) ps − 1 20
Comparision • Theoretical decay rate (20 K, 37500 cm-1) 0. 28 ps-1 & 1. 4 ps-1 • Experimental decay rate 0. 07 ps-1 & 0. 45 ps-1 21
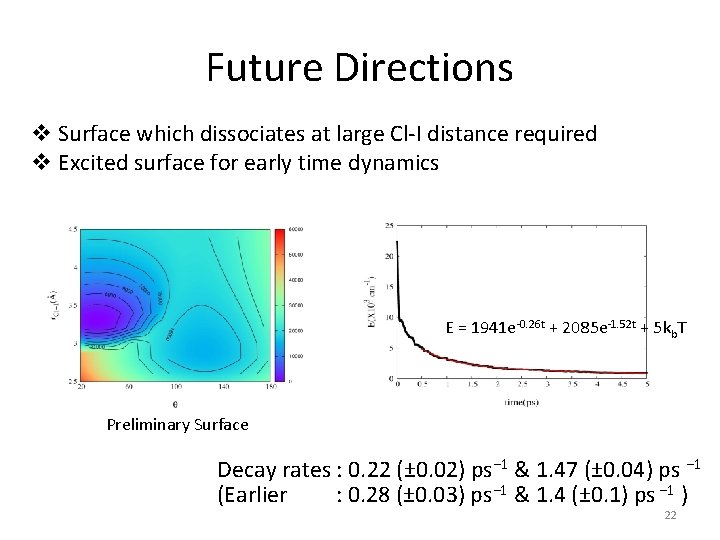
Future Directions v Surface which dissociates at large Cl-I distance required v Excited surface for early time dynamics E = 1941 e-0. 26 t + 2085 e-1. 52 t + 5 kb. T Preliminary Surface Decay rates : 0. 22 (± 0. 02) ps− 1 & 1. 47 (± 0. 04) ps − 1 (Earlier : 0. 28 (± 0. 03) ps− 1 & 1. 4 (± 0. 1) ps − 1 ) 22
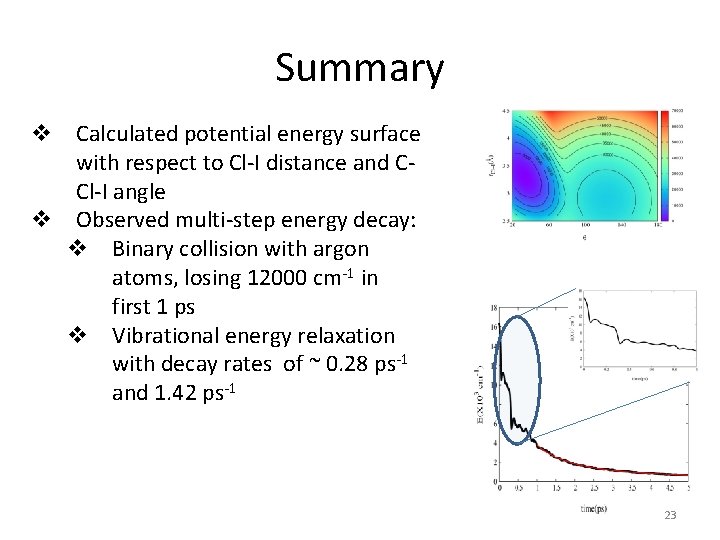
Summary v Calculated potential energy surface with respect to Cl-I distance and CCl-I angle v Observed multi-step energy decay: v Binary collision with argon atoms, losing 12000 cm-1 in first 1 ps v Vibrational energy relaxation with decay rates of ~ 0. 28 ps-1 and 1. 42 ps-1 23
Acknowledgments • • Ned Sibert Group Fleming Crim and T. J. Preston NSF for funding Thank You 24
- Slides: 24