Vertical Profiling Understanding the Behavior of ObjectOriented Applications
Vertical Profiling : Understanding the Behavior of Object-Oriented Applications Sookmyung Women’s Univ. Ps. Lab Sewon, Moon
1. Content Introduction l Fundamental concept l Implementation l Case Studies l
1. Introduction : object-oriented programming languages. l Benefit ¡ Increased runtime flexibility l ¡ improved security properties l ¡ Reflection, automatic memory management Null pointer and array bounds checks, security policies portable deployment representation introduces an additional layer of virtualization, between the application and the OS. l Defect l ¡ Introduces obstacles to understanding application performance.
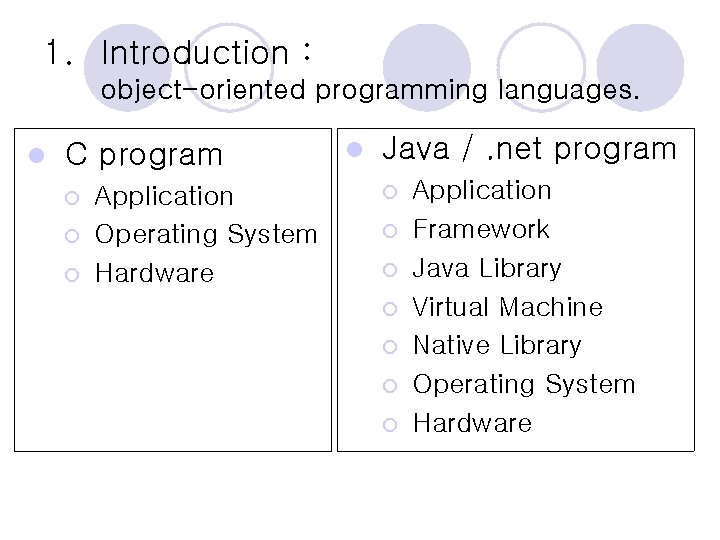
1. Introduction : object-oriented programming languages. l C program ¡ ¡ ¡ Application Operating System Hardware l Java /. net program ¡ ¡ ¡ ¡ Application Framework Java Library Virtual Machine Native Library Operating System Hardware
1. Introduction : Veritcal Profiling l Verital Profiling ¡ gather more complete profiles, containing information about system behavior on various levels ¡ to further the understanding of system behavior through correlation of profile information from different level
2. fundamental concept l Events ¡ ¡ l States ¡ l captures the values in all of memory Monitors ¡ ¡ ¡ l atomic occurrence in time that does not have any duration Usually causes the system to change to a different state. obseves the behavior of a system scalar variable with a value that changes over time hardware / sofeware performance monitors Counters ¡ ¡ special kind of performance monitor usually a count of events
2. fundamental concept l Sofeware Performance Monitors ¡ observe the behaviour in the layers above the hardware ¡ cover the following parts of the system l l Application Vitual Machine • Memory Manager • Runtime Compilers • Synchronization l Operating System
3. Implementation : Jikes RVM l open source research virtual machine that executes java bytecodes l Jikes ¡ is RVM implemented in the Java programming language ¡ uses Java threads to implement several subsystems, such as the garbage collector and the adaptive optimization system
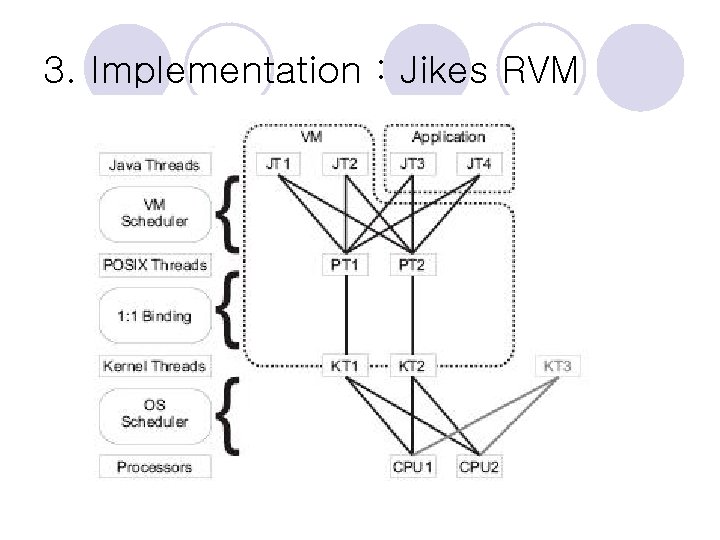
3. Implementation : Jikes RVM
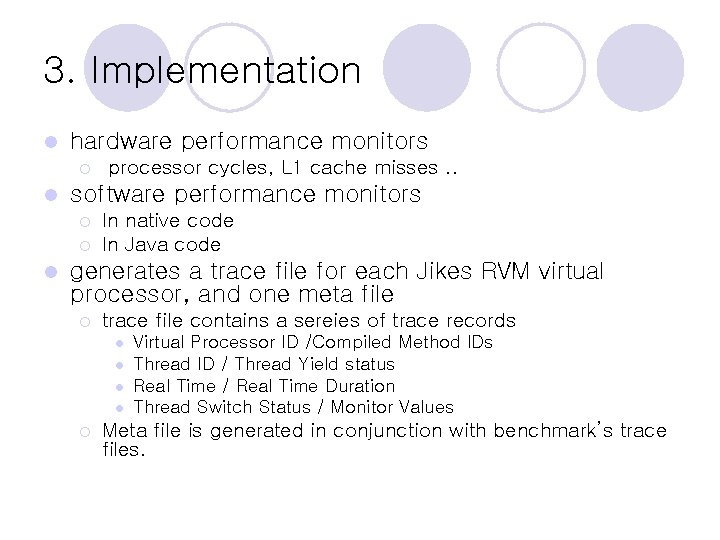
3. Implementation l hardware performance monitors ¡ l software performance monitors ¡ ¡ l processor cycles, L 1 cache misses. . In native code In Java code generates a trace file for each Jikes RVM virtual processor, and one meta file ¡ trace file contains a sereies of trace records l l ¡ Virtual Processor ID /Compiled Method IDs Thread ID / Thread Yield status Real Time / Real Time Duration Thread Switch Status / Monitor Values Meta file is generated in conjunction with benchmark’s trace files.
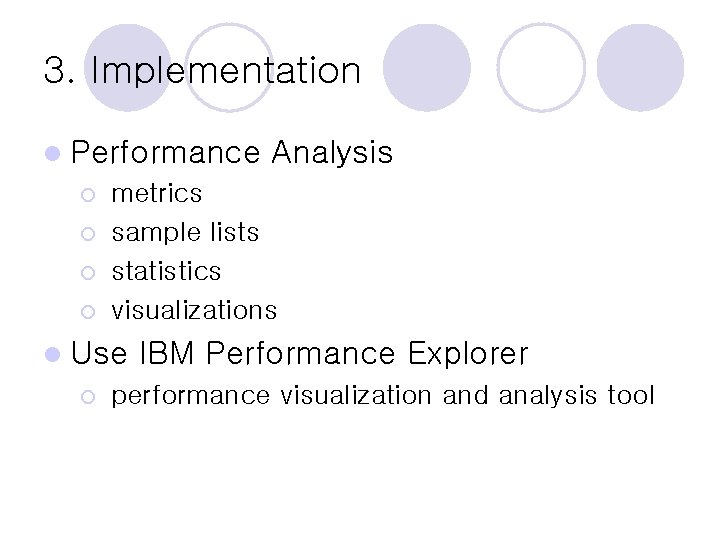
3. Implementation l Performance ¡ ¡ metrics sample lists statistics visualizations l Use ¡ Analysis IBM Performance Explorer performance visualization and analysis tool
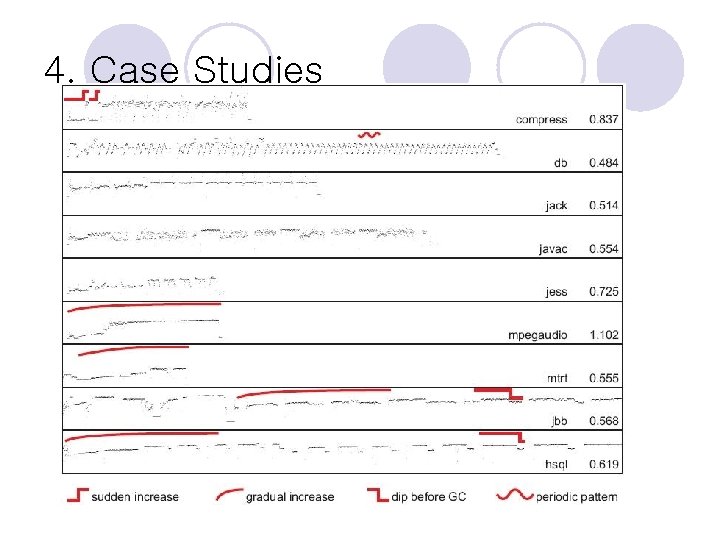
4. Case Studies
4. Case Studies l Benchmarks : SPECjbb 2000 l VM : Jikes RVM l Initialization ¡ 1 thread ¡ 120000 transactions ¡ 50 transactions per time slice
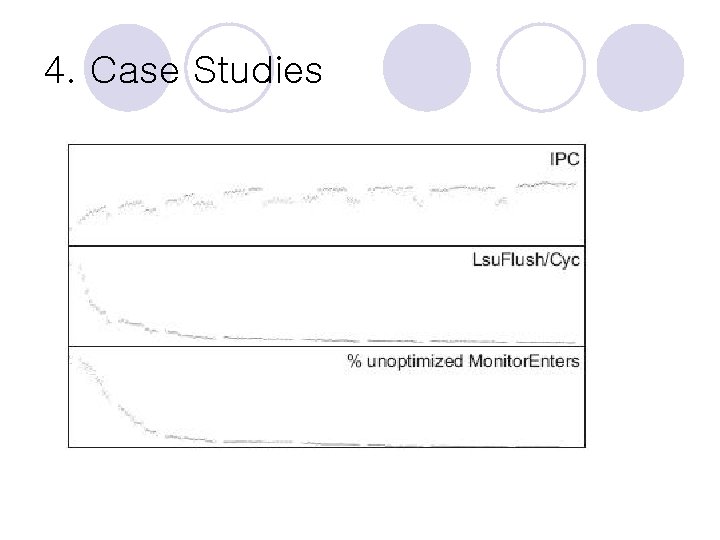
4. Case Studies The changes in application behavior during a transaction are not captured in the signal l Thus, they expect tha the gradual increase in IPC is not due to the transaction behavior, but due to some other lower-level behavior l In prior work they speculated that jbb’s gradual increase in IPC occurs because as jbb runs, more and more of its code gets optimized. l ¡ ¡ Optimized code had a higher IPC than unoptimized code the number of flushes in the load/store unit went down when the IPC increased.
4. Case Studies l Exploration ¡ Need to measure the amount of time spent in optimized code and unoptimized code for each thme slice ¡ Use Monitor. Enter bytecode instructions ¡ Two JVM performance monitor Unopt. Monitor. Enter l Opt. Monitor. Enter l
4. Case Studies
- Slides: 16