Vernier Analysis Tutorial Spin Fest 2016 Mike Beaumier

Vernier Analysis Tutorial Spin Fest 2016 Mike Beaumier, Ph. D University of California, Riverside

2 What is the Vernier Analysis? •

4 What is the Vernier Scan? BBC Rate One beam is swept transversely across another. Correlating the displacement to the BBC rate produces the transverse beam profile. Beam Displacement Blue Beam Yellow Beam

5 Parameters, Data Sources •

6 Calculating Luminosity •

7 Extracting the Transverse Beam Profile
 novertexcut” (BBC wide) Fires any time")
Run Scalers Trigger Scaler Description “BBCLL 1(>0 tubes) novertexcut” (BBC wide) Fires any time there is a coincidence of the BBC North and South within a prescribed time window “BBCLL 1(>0 tubes)” (BBC narrow) Same as novertex cut, but with an online vertex cut of approximately +/30 cm “ZDCLL 1 wide” (ZDC wide) Fires any time there is a coincidence of the ZDC north and South within a prescribed time window “CLOCK” Fires once every beam clock count (once per bunch crossing) The GL 1 -1 P scalers must be specially programmed into the GL 1 -1 P boards. These scalers record the number of live triggers for each scaler, and sum them. The sum is read out each recorded event, and the counter resets

9 The BBC Rate Events are ordered in time by summing every 1000 events. The BBC wide scaler is divided by the clock scaler for each bin to obtain the BBC rate

10 The BBC Rate Note the obvious stepped distribution of the BBC rate. Each step corresponds to the BBC rate associated with a fixed beam displacement.

Obtaining Beam Positions Use measurements at BPM 7 and BPM 8 to produce intersection point at IR plane of blue, yellow beams. y x Blue beam s z Yellow beam BPM Sector 7 Plane Then, once intersection points are known, calculate distance between beams, s, at the IR plane. PHENIX Interaction Region, Coordinate System BPM Sector 8 Plane

12 Monitoring Beam Position Monitor While BPMs do not necessarily give an accurate position for each beam individually, they can be used to calculate the separation between the beams

13 Beam Width Fit The beam displacements are correlated to the related rates, and the distributions are fit with a Gaussian. The width of the Gaussian gives a measurement of the beam width for the horizontal and vertical dimensions of the beam.

14 Beam Width Fit 0. 0251 mm A simultaneous Gaussian fit in x and y provides the ‘actual’ value for the beam width in the transverse directions. Y Displacement Simultaneous Beam Width 0. 0254 mm X Displacement

15 Beam Ion Population

Wall Current Monitor The wall current monitor offers subbeam clock current timing, and is sensitive to beam bunching, but is less accurate than the DCCT Direct-Current Transformer The DCCT is sensitive to the overall beam population, and can be used to correct the readout of the WCM

17 Calibrating the WCM with DCCT •

18 Calibrating the WCM with DCCT • The calibration may be done in ‘real time’ • Calibration constant calculated, applied when DCCT + WCM data available simultaneously • Distribution of calibration can be studied Blue Beam Calibration Yellow Beam Calibration

19 Beam Ion Population Per Bunch

20 WCM and Luminosity Loss •

21

• 144. 34 + d 144. 34 - d 10 cm BBC S BBC N

BBC Z-Vertex Solid Angle “As Seen From Vertex” • Solid angle of BBC plotted for all possible z-vertices for the BBC and ZDC • Relatively flat geometric acceptance of the ZDC over the range of the BBC allows us to use it to calculate the efficiency of the BBC Solid Angle “As Seen From Vertex” 23 ZDC Z-Vertex

24 BBC Wide&Narrow vs BBC Wide Events are binned in z-vertex for coincidences of the BBC wide AND BBC narrow triggers (left) vs BBC wide (right). Taking the bin-by-bin ratio of these distribution shows the trigger acceptance of the BBC narrow trigger.

25 BBC Trigger Acceptance Creating the trigger acceptance plot shows a clear turn on where there is maximum overlap between BBC wide and narrow triggered events. The absolute value of the derivative of the acceptance can be used to pinpoint the online vertex cut, in this case at -34. 4 cm and +35. 8 cm

26 Correcting for z-Vertex Dependence The BBC response has a z-dependence, more so than the ZDC. This is corrected for by creating a histogram in z-vertex for events firing the BBC wide and ZDC wide triggers, and events which fire the ZDC wide trigger. A bin-by-bin ratio is taken.

27 Correcting for z-Vertex Dependence A quadratic function is fit to the resulting profile, which gives the z-vertex correction for the BBC. The BBC wide distribution is integrated over the nominal z-vertex cut region, and divided by the total yield. The z-vertex correction is applied bin-by-bin. The result is the efficiency, which for Run 359711 is about 0. 43

28 The Hourglass Effect

What is the Hourglass Effect? •

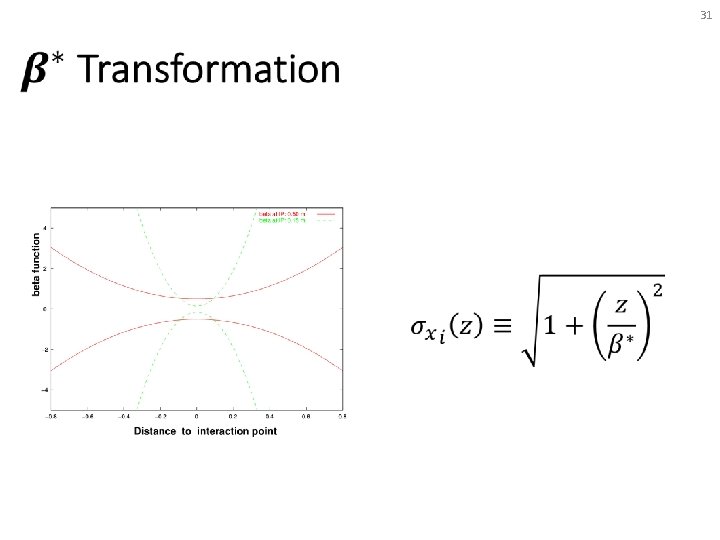
30 Crossing Angle Transformation

32 Real Beam Profiles The blue and yellow z-distributions are recovered directly from the data The distributions are fit with a triple. Gaussian.

33 Simulating ZDC z-vertex Profile

34 Convergence of Simulation

35 Simulation Results

36 Putting it All Together •

37 Thank you!
- Slides: 37