VERIS by ElectroDiagnostic Imaging Inc Redwood City California

VERIS ™ by Electro-Diagnostic Imaging, Inc. Redwood City, California, USA First in Multifocal Electrophysiology and its Future
 Testing • EOG, Full-Field ERG & Flash")
Comprehensive Visual Electrodiagnostic Testing Traditional (ISCEV Standard) Testing • EOG, Full-Field ERG & Flash VEP, Pattern ERG & VEP Multifocal Testing • • • mf. ERG, mf. VEP Automated Ring Ratio Analysis Optic Nervehead Component (Global Flash Paradigm) . . . and more • • M-Sequence Full-Field ERG, Pattern VEP, Pattern ERG Full Kernel Analysis. / Synthesis capability User-Defined Custom Recording and Analysis Protocols Customizable Reports

Apple OS X Platform • Exceptionally stable • VERIS data can be stored automatically to any local, network, or Internetaccessible storage device • Choice of open or password-protected file locking of data, analysis settings, and recording settings files • Easy creation of pdf copies of reports for electronic medical records or email communications without additional (3 rd party) software • Easy to learn and to use!
")
VERIS™ Platform Options Mac. Book Pro Available Stimulators: • Fresnel Ganzfeld 1 (FG 1) • FMS IV • EMS IV (not shown) • Flat panel displays (not shown) • Full-Size Ganzfeld (coming soon) 21. 5” IMac 27” IMac Also available with Mac Pro computer • Requires additional console display

Fresnel Ganzfeld 27 -inch i. Mac Computer FMS IV VERIS Platform Available Stimulators: • Fresnel Ganzfeld 1 (FG 1) • FMS IV • EMS IV (not shown) • Flat panel displays • Full-Size Ganzfeld (not shown) Isolation Transformer Amplifier

™ VERIS 6 Software Four Levels 1. TRADITIONAL / BASIC • Traditional ISCEV protocols only 2. CLINIC • • All Pre-programmed Tests Limited analysis and report customization capability 3. SCIENCE • CLINIC + extensive stimulation, recording, analysis, and report customization 4. PRO • SCIENCE + advanced kernel synthesis / modeling ability

Real-time Internet support from EDI • Available to all VERIS users by appointment • Real-time monitoring and control of your VERIS system from our California office for training and troubleshooting at your location. • Fully encrypted with security controls and session transcripts to ensure privacy of medical information • Supplied through Team. Viewer platform • Requires only fast Internet connection

The Conventional Flash ERG Response of the retina to a full-field flash derived by means of an electrode placed on or near the cornea of the eye. The basic stimulator used for the derivation of this response is è The Ganzfeld Stimulator

ISCEV Standard Ganzfeld Protocols

The Fresnel Ganzfeld 1 Two EDI Ganzfeld Stimulators Coming in 2015 EDI’s silver bullet Approximates ideal integrating sphere LEDs R, G, B and Amber Removable protective shield 16” diameter 10” opening

Shortcoming of the Conventional Flash ERG The retina is not homogeneous in its anatomy and physiology. • Many retinal pathologies first affect smaller areas of the visual field. • The distribution of dysfunction is often characteristic for the disease and helpful for diagnosis and disease management.

The Solution. . . Multifocal Electrophysiology Mapping the ERG responses across the retina (visual field) This technique is now called the Multifocal ERG or mf. ERG A similar approach can also be applied to cortical (VEP) testing where it is called the Multifocal VEP or mf. VEP

mf. ERG Hexagon array mf. VEP Monitor screen 120 scaled sectors stimulated with contrast reversing check patterns ~ 40° Corneal Electrode Amplifier Typical electrode placement Computer Minimum 2 channels: 1 midline 1 lateral Inion Trace array 120 focal VEPs Right eye red Left eye blue Response density Inter-ocular differences

Stimulator unit includes: • High resolution color display • Eye camera for patient alignment • IR fundus camera for fixation monitoring

Clinical recording of multifocal ERGs takes 2 to 7 minutes per eye. The time depends on • The recording system • The spatial resolution • The electrode technique

Clinical Testing with the Multifocal ERG Some illustrative examples

AMD Patient

CSR Patient: Response Density 0 5 10 15 20 25 30 35 40 45 50 n. V/deg^2
 are very important to distinguishing between pathologies. Some cause delays")
Peak implicit times (latencies) are very important to distinguishing between pathologies. Some cause delays and others do not. Unfortunately response delays are often neglected in clinical testing.

Depressed area shows delays CSR Patient 15° 10° 5° 5° Response density 0 24 5 10 15 20 25 30 35 40 45 26 0 5 50 n. V/deg^2 10 15 20 25 30 35 40 45 50 n. V/deg^2 15° 10° 5° 5° 28 30 32 34 ms 24 26 28 30 P 1 Implicit time 32 34 ms

Delays indicate disease where amplitudes seem normal Retinoschisis P 1 Implicit Times Response Amplitudes 20° 15° 10° Normal Range 15° Normal Range 10° 5° 5° Patient Normal Range Highly Abnormal 0 2 4 6 8 20° 10 12 14 n. V/deg^2 2 4 6 23 26 29 32 20° 15° 10° Normal Subject 5° 0 20 8 10 12 14 n. V/deg^2 35 38 41 44 ms 5° 20 23 26 29 32

Nonlinearities of the responses such as flash-flash interactions are also useful for distinguishing between pathological changes The dominant nonlinear component is related to interactions between consecutive flash responses. It is called the first slice of the second order kernel.
 Field")
Second Order, First Slice (Another response component extracted from the same data set) Field View Sub Normal Range 50 n. V 0 80 ms

Hydroxychloroquine Retinopathy • A small percentage of patients who take this drug for autoimmune disease develop a bullseye retinopathy. • This retinopathy is, at best, only partially reversible when the patient is taken off the drug. • For disease prevention, the mf. ERG is now often used for patient screening.

Hydroxychloroquine Retinopathy Para-central depression Relative sparing of center Normal Reference

Hydroxychloroquine Retinopathy

Hydroxychloroquine Retinopathy P 1 implicit times are within normal range!

Hydroxychloroquine Retinopathy Plots are automatically generated Index of Central Sparing red area outside 30 divided by total red area Ring averages

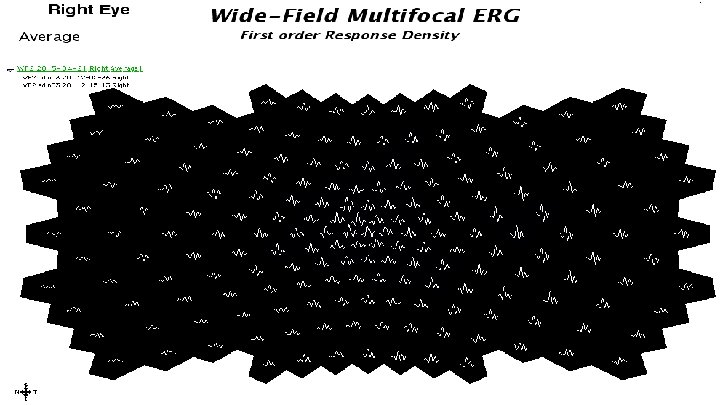
The Wide-Field Multifocal ERG Doubling the Stimulation Field Size

The Wide-Field Multifocal ERG Doubling the Stimulation Field Size

The Wide. Field Multifocal ERG

The Multifocal VEP

Normal mf. VEP 200 n. V 0 200 ms Traces from the two eyes match well! Red traces : right eye Blue traces : left eye

Optic Neuritis on right eye acute phase Record Dated: 03 -26 -2007 Right eye amplitudes severely depressed in central area. Red traces : right eye Blue traces : left eye

Optic Neuritis Recovery 1 Record Dated: 05 -19 -2007 Red traces : right eye Blue traces : left eye Right eye amplitudes recovered but delayed in central area.

Optic Neuritis Recovery 2 Record Dated: 07 -232007 Red traces : right eye Blue traces : left eye Recovery of delays suggests re-myelination of fibers.
 The discovery of the optic nerve head component (ONHC)")
The Optic Nervehead Component (ONHC) The discovery of the optic nerve head component (ONHC) raised our hopes that it may become possible to map ganglion cell related response across the visual field using the a special mf. ERG protocol.

At the transition where fibers become myelinated action potentials create a contribution to the ERG > Optic Nerve Head Components (ONHC). Retinal contributions to the corneal signal

The ONHC is delayed relative to the retinal signal in proportion to the fiber length from the stimulated patch to the nerve head
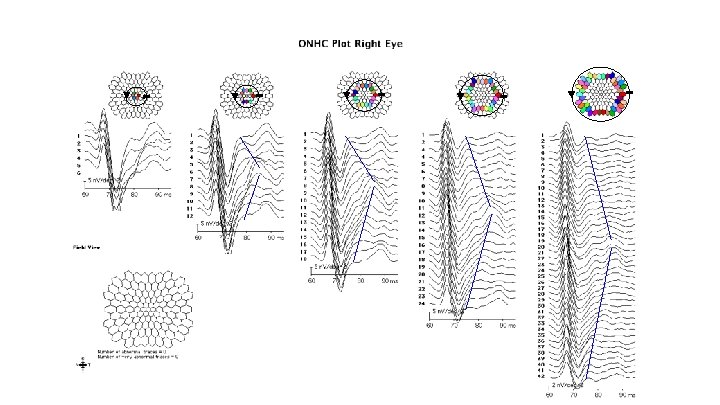

The ONHC is better recognized when we align the traces to the ONHC.

An Example of a Case of Unilateral Glaucoma

Visual field plot of unilateral glaucoma patient

Inter-ocular comparison with the mf. VEP Right eye Left eye

New Automated ONHC Analysis Automatic ONHC Extraction Both eyes plotted as left eyes for easy comparison
- Slides: 46