Venn Diagrams Probability Higher GCSE Questions AQA These

Venn Diagrams – Probability – Higher – GCSE Questions – AQA These questions are the same format as previous GCSE exams. COPY means they use the exact same numbers as the original GCSE question. Otherwise, they are clone questions using different numbers. The worksheets are provided in 2 sizes.

Printing To print handouts from slides Select the slide from the left. Then click: File > Print > ‘Print Current Slide’ To print multiple slides Click on a section title to highlight all those slides, or press ‘Ctrl’ at the same time as selecting slides to highlight more than one. Then click: File > Print > ‘Print Selection’ To print double-sided handouts Highlight both slides before using ‘Print Selection’. Choose ‘Print on Both Sides’ and ‘Flip on Short Edge’.
 ξ =")
AQA Higher: June 2017 Paper 2, Q 18 1 1 1 (a) ξ = teachers in the school M = male teachers G = teachers who wear glasses ξ M Complete the Venn diagram. 1 (b) ξ G A teacher who wears glasses is chosen at random. Work out the probability that the teacher is male. Answer G M Complete the Venn diagram. [3 marks] [1 mark] 1 (b) A teacher who wears glasses is chosen at random. Work out the probability that the teacher is male. Answer [3 marks] [1 mark]
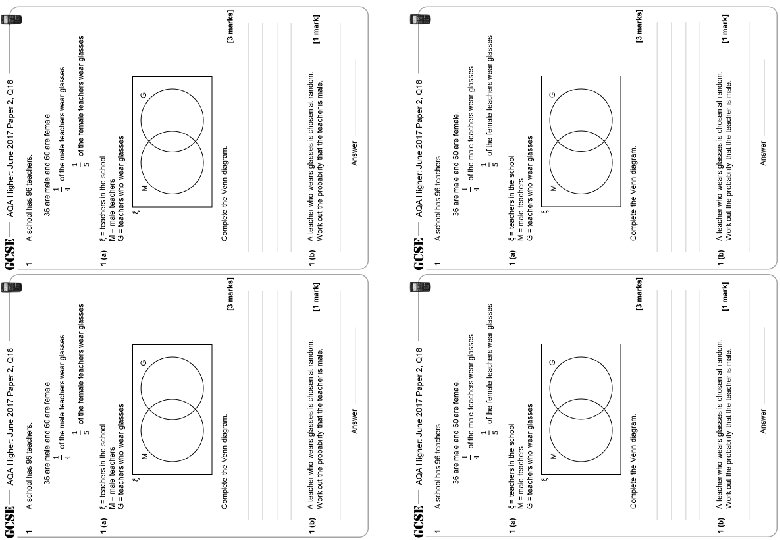

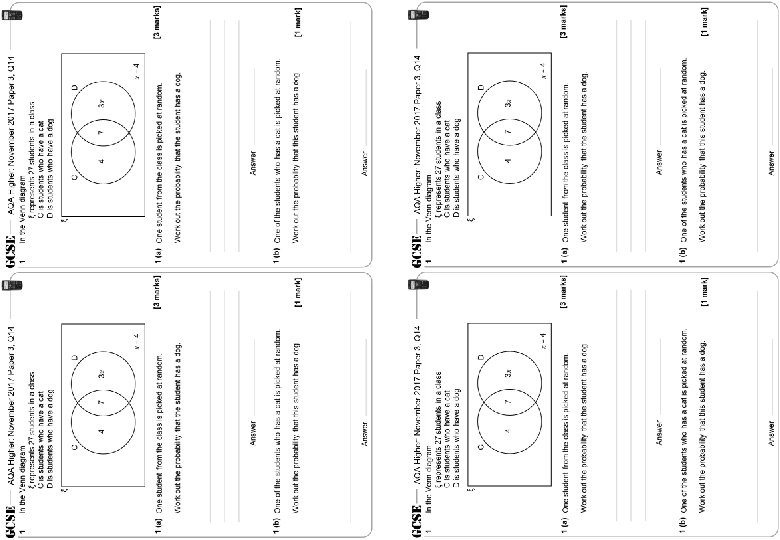
AQA Higher: November 2017 Paper 3, Q 14 1 AQA Higher: November 2017 Paper 3, Q 14 In the Venn diagram ξ represents 27 students in a class C is students who have a cat D is students who have a dog 1 ξ In the Venn diagram ξ represents 27 students in a class C is students who have a cat D is students who have a dog ξ C D 4 7 1 (a) One student from the class is picked at random. [3 marks] Work out the probability that the student has a dog. 1 (a) One student from the class is picked at random. Work out the probability that the student has a dog. Answer 1 (b) One of the students who has a cat is picked at random. Work out the probability that this student has a dog. Answer [3 marks] [1 mark] Work out the probability that this student has a dog. Answer [1 mark]

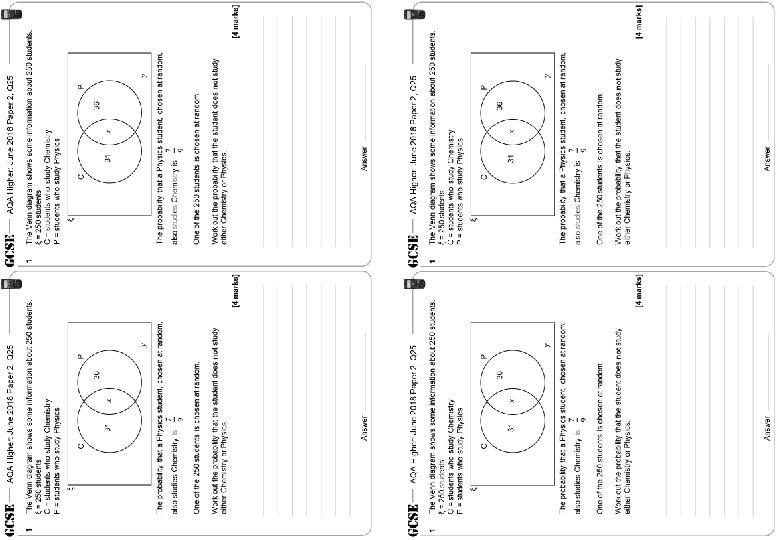
AQA Higher: June 2018 Paper 2, Q 25 1 AQA Higher: June 2018 Paper 2, Q 25 The Venn diagram shows some information about 250 students. ξ = 250 students C = students who study Chemistry P = students who study Physics 1 The Venn diagram shows some information about 250 students. ξ = 250 students C = students who study Chemistry P = students who study Physics ξ ξ C P 36 31 [4 marks] Answer
 ξ = teachers")
AQA Higher: June 2017 Paper 2, Q 18 1 1 (a) ξ = teachers in the school M = male teachers G = teachers who wear glasses ξ G M Complete the Venn diagram. 1 (b) A teacher who wears glasses is chosen at random. Work out the probability that the teacher is male. Answer [3 marks] [1 mark]

AQA Higher: November 2017 Paper 3, Q 14 1 In the Venn diagram ξ represents 27 students in a class C is students who have a cat D is students who have a dog ξ C D 4 7 1 (a) One student from the class is picked at random. [3 marks] Work out the probability that the student has a dog. Answer 1 (b) One of the students who has a cat is picked at random. Work out the probability that this student has a dog. Answer [1 mark]

AQA Higher: June 2018 Paper 2, Q 25 1 The Venn diagram shows some information about 250 students. ξ = 250 students C = students who study Chemistry P = students who study Physics ξ C P 36 31 [4 marks] Answer
 ξ = teachers")
AQA Higher: June 2017 Paper 2, Q 18 1 1 (a) ξ = teachers in the school M = male teachers G = teachers who wear glasses ξ G M 27 9 12 48 Complete the Venn diagram. [3 marks] 1 (b) A teacher who wears glasses is chosen at random. Work out the probability that the teacher is male. Answer [1 mark]

AQA Higher: November 2017 Paper 3, Q 14 1 In the Venn diagram ξ represents 27 students in a class C is students who have a cat D is students who have a dog ξ C D 4 7 15 1 1 (a) One student from the class is picked at random. [3 marks] Work out the probability that the student has a dog. Answer 1 (b) One of the students who has a cat is picked at random. Work out the probability that this student has a dog. 4 + 7 = 11 in total Answer [1 mark]

AQA Higher: June 2018 Paper 2, Q 25 1 The Venn diagram shows some information about 250 students. ξ = 250 students C = students who study Chemistry P = students who study Physics ξ C P 31 36 [4 marks] Total = 9 × 18 = 162 Answer

Questions? Comments? Suggestions? …or have you found a mistake!? Any feedback would be appreciated . Please feel free to email: tom@goteachmaths. co. uk
- Slides: 15