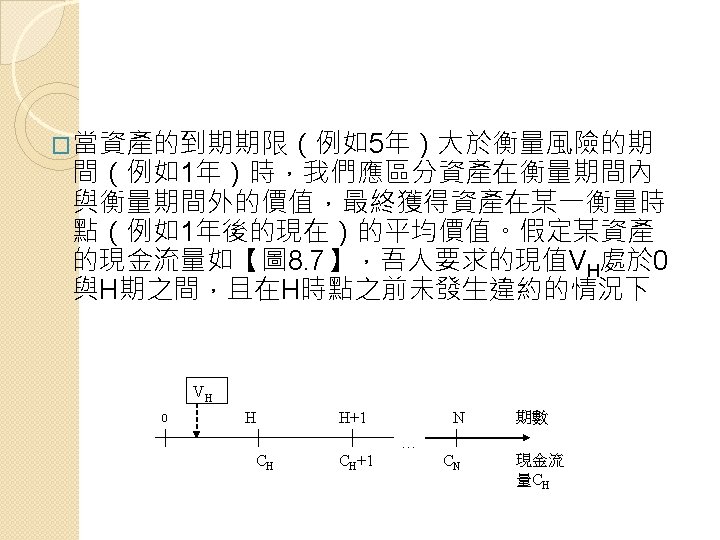
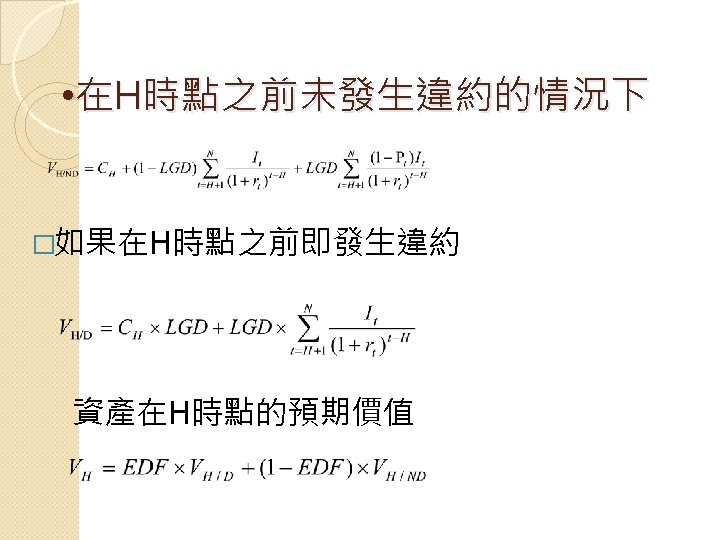
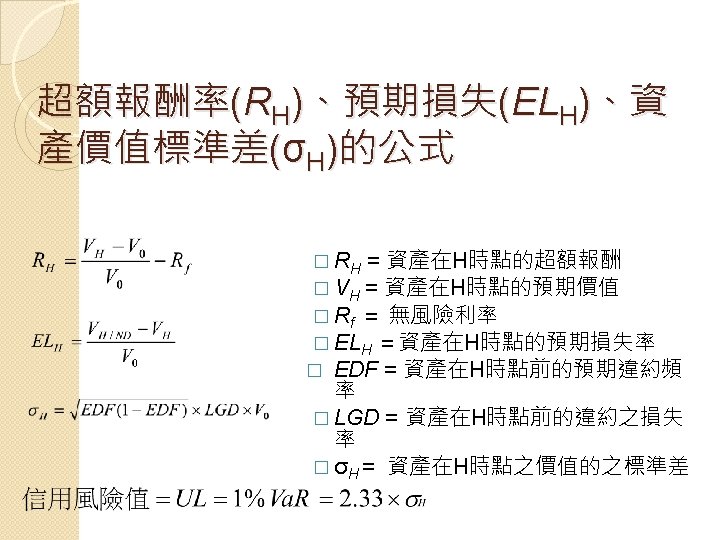
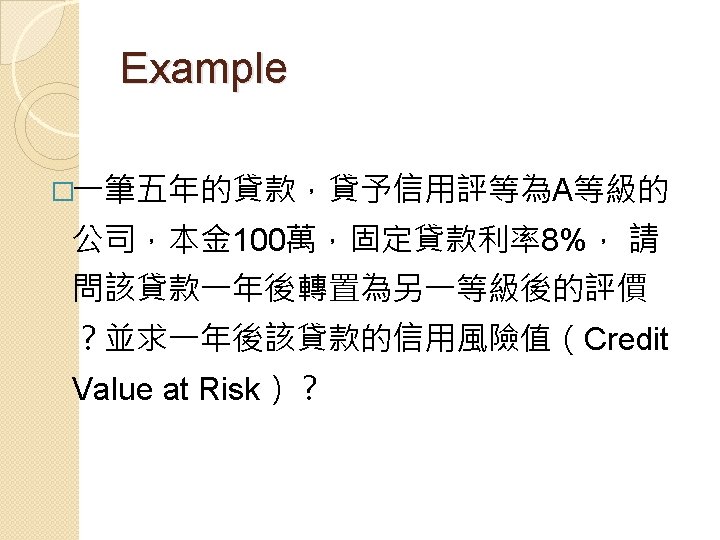
Vendors Model of Credit Risk Credit Monitor Model

 • 信用矩陣模型(Credit Metrics Model) •")
(or Option Models) ◦ Employ option pricing methods to evaluate the")


 Matrix Rating at start of year AAA AA A BBB BB B CCC")
 Rating 1 yr 2 yr")


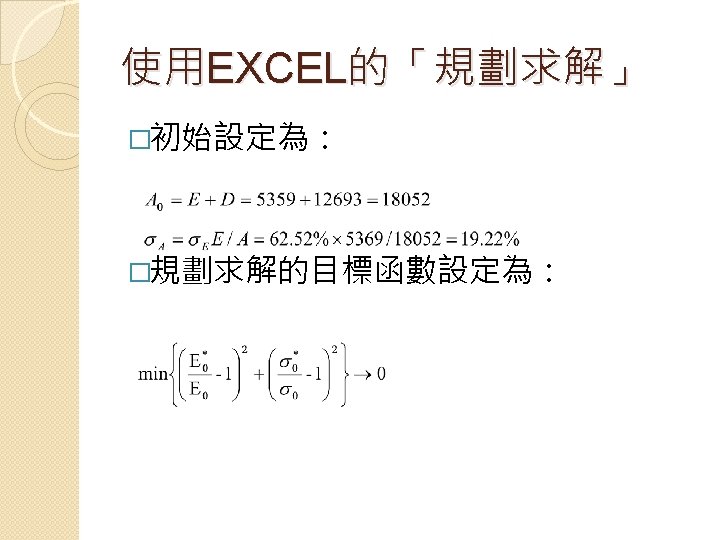
- Slides: 37
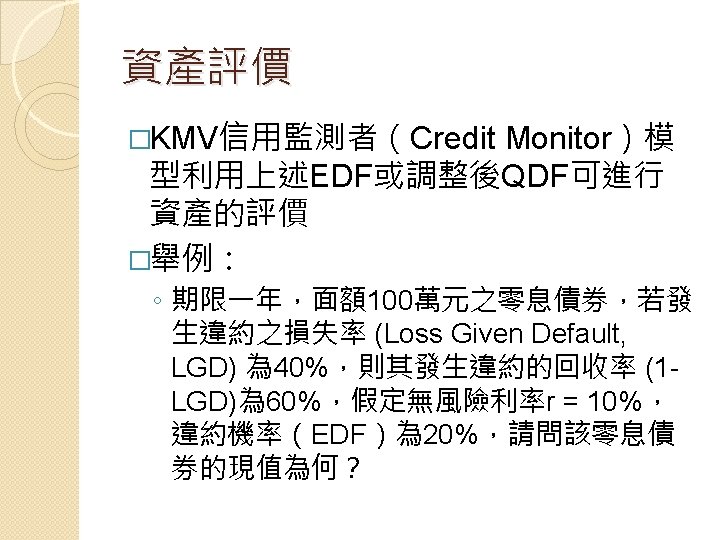
Vendors’ Model of Credit Risk • 信用監測者模型(Credit Monitor Model) • 信用矩陣模型(Credit Metrics Model) • 信用風險加成模型 (Credit. Risk+) • 信用投資組合遠景模型(Credit Portfolio View, CPV)
信用結構模型與KMV (Structure Credit Models)(or Option Models) ◦ Employ option pricing methods to evaluate the option to default. ◦ Used by many of the largest banks to monitor credit risk. ◦ KMV Corporation markets this model quite widely.
Option Models E 0 D A
Assumption of Merton �Constant riskless rate r �Stochastic interest rates �Asset-value process contain jumps
Applying Option Valuation Model � Merton showed value of a risky loan � Written as a yield spread where y(T) = Required yield on risky debt r = Risk-free rate on debt of equivalent maturity.
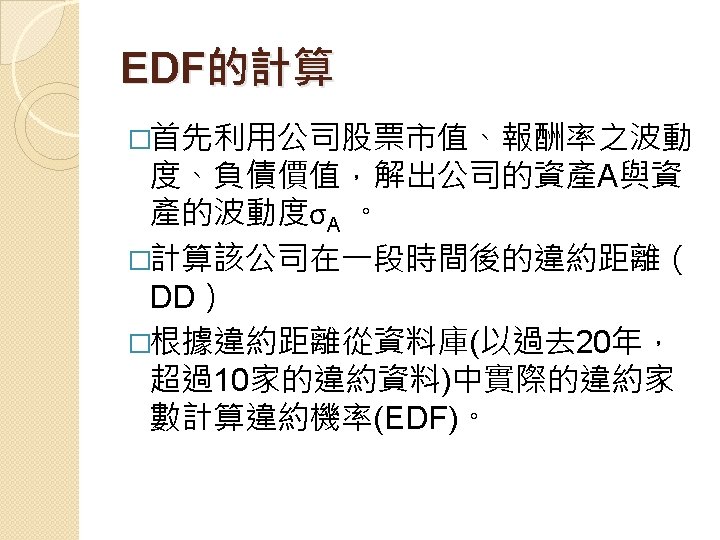
EDF
*Credit. Metrics next year is a bad year, how much will I lose on my loans and loan portfolio? ” Va. R(or Ca. R) = P × 1. 65 × s �Neither P(position), nor s observed. Calculated using: �“If ◦ ◦ (i)Data on borrower’s credit rating; (ii) Rating transition matrix; (iii) Recovery rates on defaulted loans; (iv) Yield spreads.
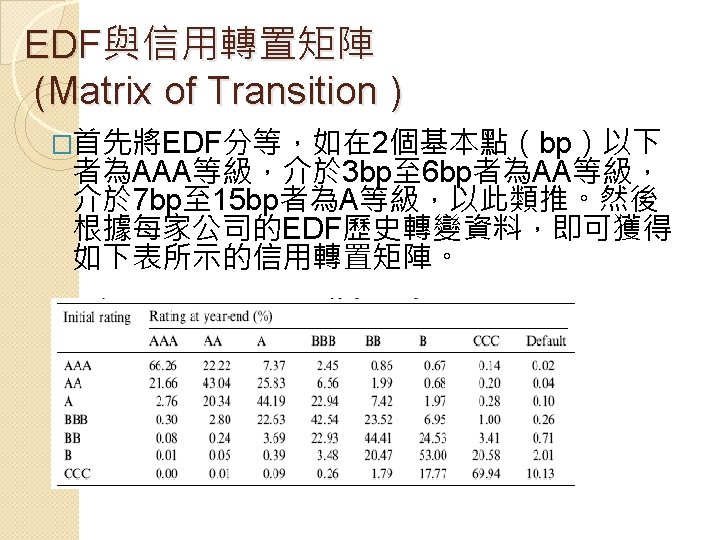
Migration(Transition) Matrix Rating at start of year AAA AA A BBB BB B CCC Default 9366 66 7 3 3 0 16 0 583 9172 225 25 7 10 0 0 40 694 9176 483 44 33 31 0 BBB 8 49 519 8926 667 46 93 0 BB 3 6 49 444 8331 576 200 0 B 0 9 20 81 747 8418 1074 0 CCC 0 2 1 16 105 387 6395 0 Default 0 1 4 22 98 530 2194 AA Rating A at end of year 10000
Corporate bond spreads above the riskfree rate (basis points) Rating 1 yr 2 yr 3 yr 4 yr 7 yr 10 yr 30 yr AAA 38 43 48 62 72 81 92 AA 48 58 63 77 92 101 112 A 73 83 103 117 137 156 165 BBB 118 133 148 162 182 201 220 BB 275 300 325 350 375 450 575 B 500 550 600 675 725 775 950 CCC 700 750 900 1000 1100 1250 1500
一年以後一個五年期A等級貸款轉置為A 等級貸款的現值 1 yr 2 yr 3 yr 4 yr 7 yr 10 yr 30 yr 無風險利率G 0. 06703 0. 06714 0. 06754 0. 06789 0. 06801 0. 06776 0. 06679 風險貼水A 0. 0073 0. 0083 0. 0103 0. 0117 0. 0137 0. 0156 0. 0165 折現率G+A 0. 07433 0. 07544 0. 07784 0. 07959 108. 26
信用風險值 PV B CCC 110. 072 2 109. 566 9 108. 256 3 106. 770 1 100. 960 3 92. 0854 84. 5577 default 53. 4499 AAA AA A BBB BB 預期損失= 0. 1819 機率� 期望� 變異數 損失 預期 損失 0. 0009 0. 0991 0. 0036 -1. 8159 -0. 0016 0. 0227 2. 4872 0. 0506 -1. 3106 -0. 0298 0. 9105 98. 5674 0. 0301 0 0. 0000 0. 0552 5. 8937 0. 0939 1. 4862 0. 0820 0. 0074 0. 7471 0. 3745 7. 296 0. 0540 0. 0026 0. 0001 0. 2394 0. 0085 0. 6647 0. 0553 16. 1709 0. 0420 23. 6986 0. 0024 0. 0006 0. 0321 1. 7903 54. 8064 0. 0329 108. 0744 標準差 3. 063 1. 7501 0. 1819
Summary of Strengths and Weaknesses of each model External Ratings Accounting Structural Credit. Metrics Credit. Portfolio. View Detailed Customer Specific Financial Analysis Based on external Detailed analysis Only debt and asset ratings which of financials values includes detailed financial analysis Most accounting Based on market Industry factors Industry models do not fluctuations which incorporated at differentiation differentiate will vary with time of rating between industries industry risk Fluctuates with Highly responsive No fluctuations market (no to market with market time delays) fluctuations Ratings readily Relatively easy to Complex Easy to model available to duplicate models techniques researchers on a spreadsheet Medium – Does fluctuate with market but can High at time of over- or understate Accuracy rating Lower as depending on time passes market volatility. Calibration can improve accuracy Based on external ratings which includes detailed financial analysis Based on ratings Have a specific which incorporate Industry transition industry factors at adjustment time of rating Can update industry No fluctuations adjustment factors with market from time to time Complex techniques High at time of rating Lower as time passes