VelocityTime Graphs Distance Higher GCSE Questions AQA These


- Slides: 11
Velocity-Time Graphs – Distance – Higher – GCSE Questions – AQA These questions are the same format as previous GCSE exams. COPY means they use the exact same numbers as the original GCSE question. Otherwise, they are clone questions using different numbers. The worksheets are provided in 2 sizes.
Printing To print handouts from slides Select the slide from the left. Then click: File > Print > ‘Print Current Slide’ To print multiple slides Click on a section title to highlight all those slides, or press ‘Ctrl’ at the same time as selecting slides to highlight more than one. Then click: File > Print > ‘Print Selection’ To print double-sided handouts Highlight both slides before using ‘Print Selection’. Choose ‘Print on Both Sides’ and ‘Flip on Short Edge’.
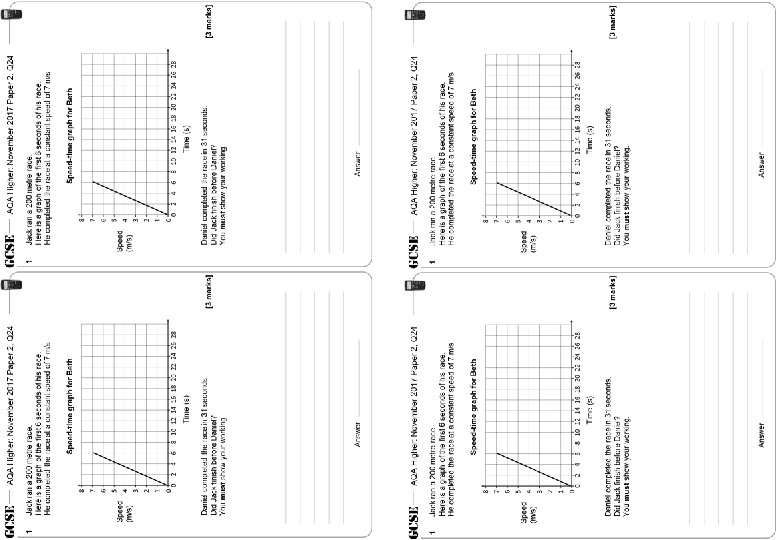
AQA Higher: November 2017 Paper 2, Q 24 1 AQA Higher: November 2017 Paper 2, Q 24 Jack ran a 200 metre race. Here is a graph of the first 6 seconds of his race. He completed the race at a constant speed of 7 m/s 1 Jack ran a 200 metre race. Here is a graph of the first 6 seconds of his race. He completed the race at a constant speed of 7 m/s Speed-time graph for Beth Speed (m/s) Time (s) Daniel completed the race in 31 seconds. Did Jack finish before Daniel? You must show your working. Answer Time (s) [3 marks] Daniel completed the race in 31 seconds. Did Jack finish before Daniel? You must show your working. Answer [3 marks]
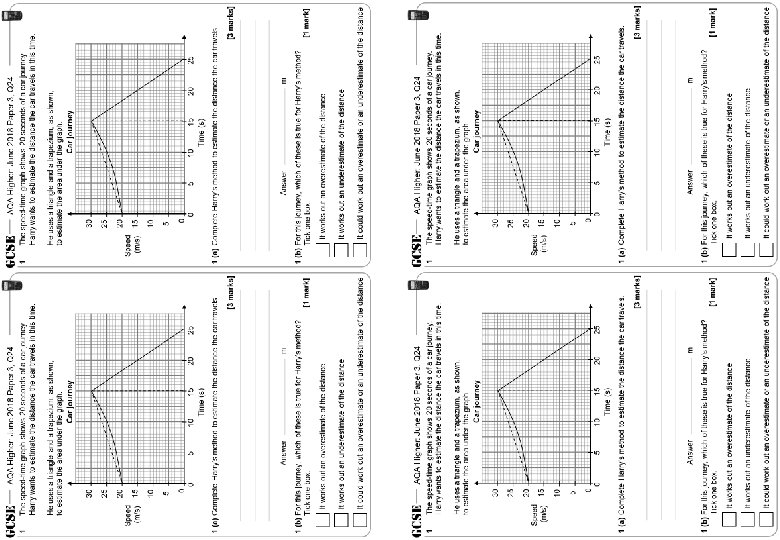
AQA Higher: June 2018 Paper 3, Q 24 1 AQA Higher: June 2018 Paper 3, Q 24 The speed-time graph shows 20 seconds of a car journey. Harry wants to estimate the distance the car travels in this time. He uses a triangle and a trapezium, as shown, to estimate the area under the graph. Car journey 1 The speed-time graph shows 20 seconds of a car journey. Harry wants to estimate the distance the car travels in this time. He uses a triangle and a trapezium, as shown, to estimate the area under the graph. Car journey 30 30 25 25 20 Speed (m/s) 15 10 10 5 5 0 0 0 5 10 15 Time (s) 20 25 0 1 (a) Complete Harry’s method to estimate the distance the car travels. 5 10 15 Time (s) 20 25 1 (a) Complete Harry’s method to estimate the distance the car travels. [3 marks] Answer m 1 (b) For this journey, which of these is true for Harry’s method? Tick one box. [3 marks] Answer [1 mark] m 1 (b) For this journey, which of these is true for Harry’s method? Tick one box. [1 mark] It works out an overestimate of the distance It works out an underestimate of the distance It could work out an overestimate or an underestimate of the distance
AQA Higher: November 2017 Paper 2, Q 24 1 Jack ran a 200 metre race. Here is a graph of the first 6 seconds of his race. He completed the race at a constant speed of 7 m/s Speed-time graph for Beth Speed (m/s) Time (s) Daniel completed the race in 31 seconds. Did Jack finish before Daniel? You must show your working. Answer [3 marks]
AQA Higher: June 2018 Paper 3, Q 24 1 The speed-time graph shows 20 seconds of a car journey. Harry wants to estimate the distance the car travels in this time. He uses a triangle and a trapezium, as shown, to estimate the area under the graph. Car journey 30 25 20 Speed (m/s) 15 10 5 0 0 5 10 15 Time (s) 20 25 1 (a) Complete Harry’s method to estimate the distance the car travels. [3 marks] Answer m 1 (b) For this journey, which of these is true for Harry’s method? Tick one box. [1 mark] It works out an overestimate of the distance It works out an underestimate of the distance It could work out an overestimate or an underestimate of the distance
AQA Higher: November 2017 Paper 2, Q 24 1 Jack ran a 200 metre race. Here is a graph of the first 6 seconds of his race. He completed the race at a constant speed of 7 m/s Speed-time graph for Beth Speed (m/s) 21 metres Time (s) Daniel completed the race in 31 seconds. Did Jack finish before Daniel? You must show your working. Remaining Distance = 200 – 21 = 179 m Total Time = 25. 57… + 6 = 31. 57… seconds Answer No [3 marks]
AQA Higher: June 2018 Paper 3, Q 24 The speed-time graph shows 20 seconds of a car journey. Harry wants to estimate the distance the car travels in this time. 1 He uses a triangle and a trapezium, as shown, to estimate the area under the graph. Car journey 30 25 20 Speed (m/s) 15 10 5 0 0 5 10 15 Time (s) 20 25 1 (a) Complete Harry’s method to estimate the distance the car travels. [3 marks] 375 + 150 = Answer 525 m 1 (b) For this journey, which of these is true for Harry’s method? Tick one box. [1 mark] It works out an overestimate of the distance It works out an underestimate of the distance It could work out an overestimate or an underestimate of the distance
Questions? Comments? Suggestions? …or have you found a mistake!? Any feedback would be appreciated . Please feel free to email: tom@goteachmaths. co. uk