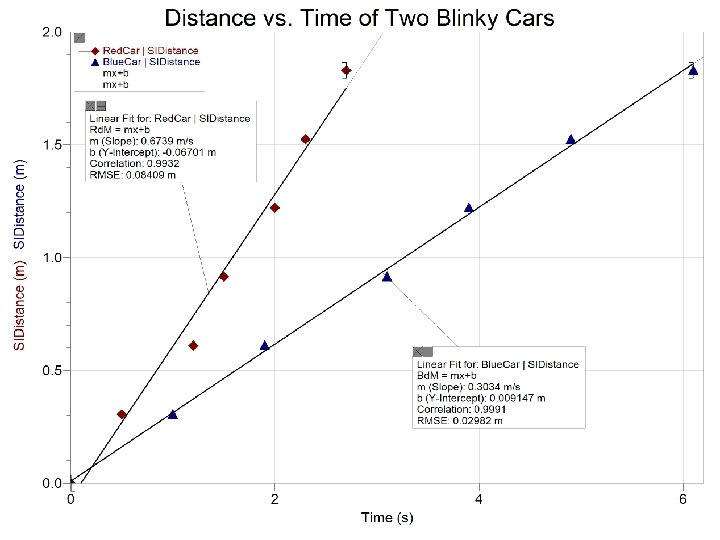
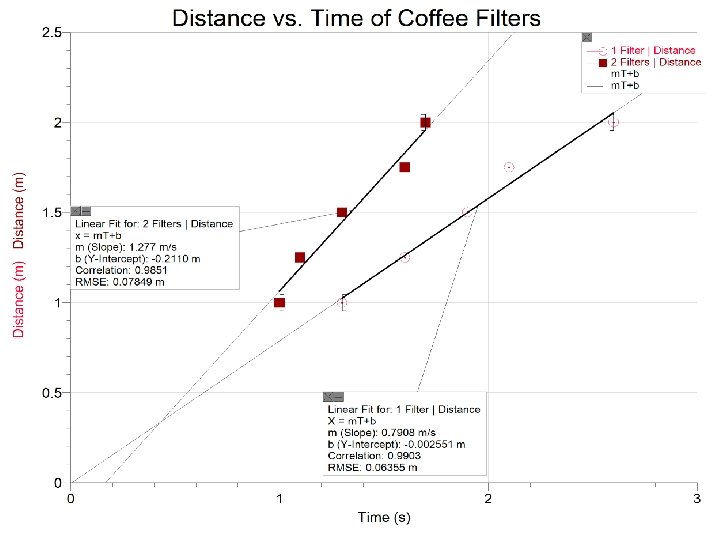
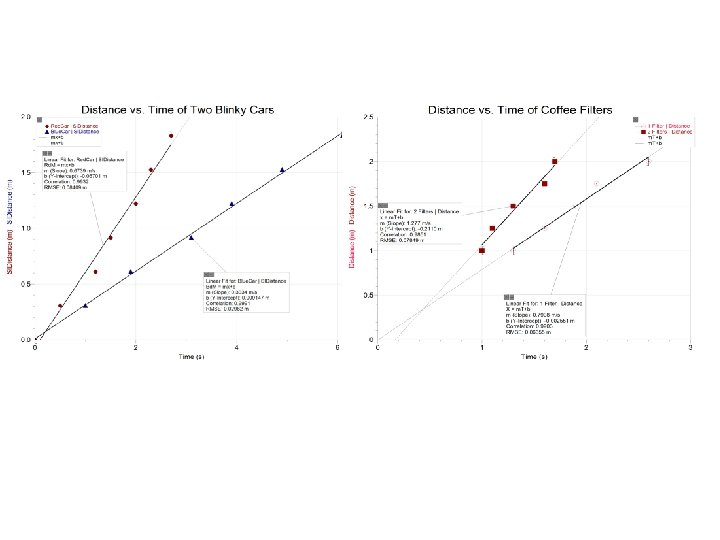
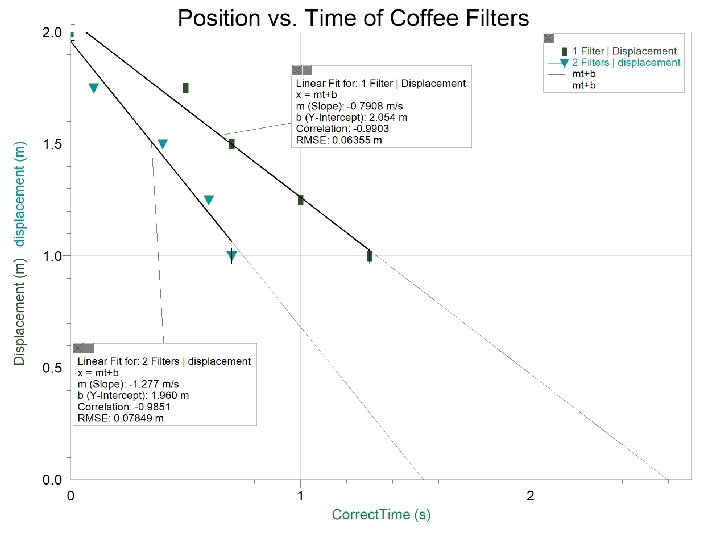
Velocity vs Time Graphs The graph shows the


 14 12 10 8 6 4 0")
 10 0 0 0. 05 0. 15 0.")
 20 15 10 5 0 0 0.")


")


- Slides: 36
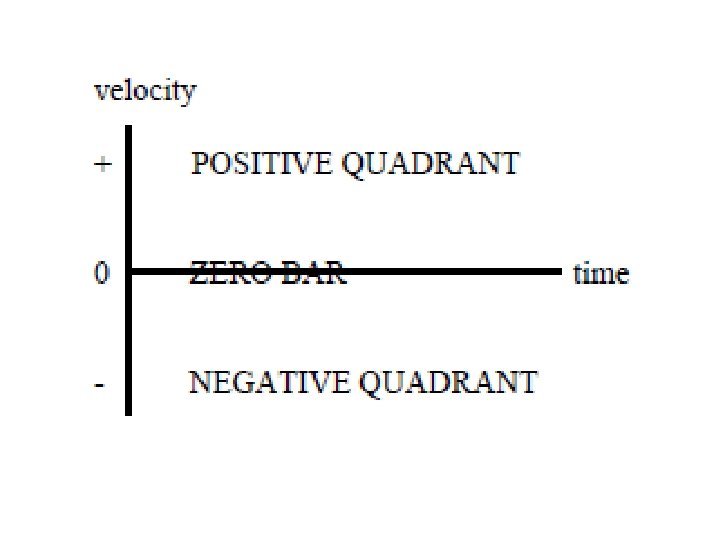
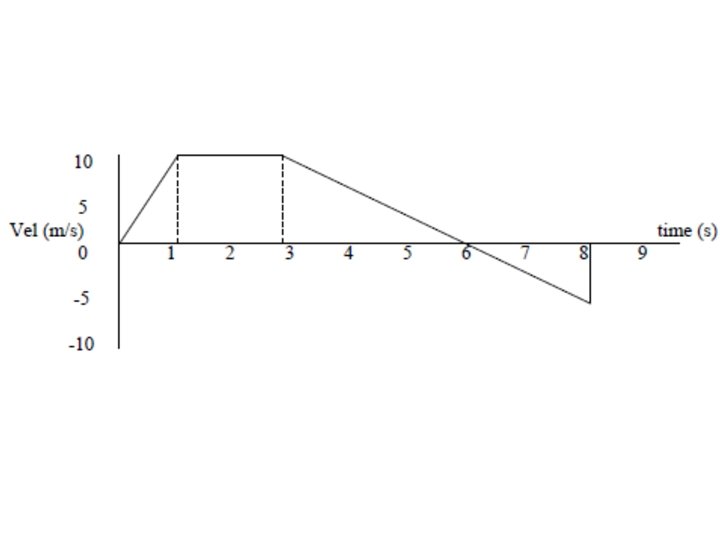
Velocity vs. Time Graphs • The graph shows the velocity of an object at different times • The positive quadrant indicates that the object is moving in the forward direction • The negative quadrant indicates the object is moving in the backward direction • The zero bar indicates the object is not moving • The further the graph gets from the zero bar, the faster the object is moving • The closer the graph gets to the zero bar the slower the object is moving
Challenge: Graph the average velocity as it changes throughout the entire motion of the object
Bike F Bike G • Create a position vs. time graph and a velocity vs. time graph for the bee’s motion. Include at least six “trips” from one bicycle to the other. Choose the origin to be Bike F’s position at t = 0. • Construct a distance vs. time graph and a displacement vs. time graph for the bee’s motion. • Challenge: Create a series that calculates the distance the bee travels for n trips. The nth term of the series should be the distance of the nth trip.
Bee's Position 20 18 16 Position (km) 14 12 10 8 6 4 0 0. 1 0. 2 0. 3 0. 4 0. 5 Time (hr( 0. 6 0. 7 0. 8 0. 9 1
Bee's Velocity 30 20 Velocity (km/hr) 10 0 0 0. 05 0. 15 0. 25 0. 35 0. 45 0. 5 -10 -20 -30 Time (hr) 0. 55 0. 65 0. 75 0. 85 0. 95 1
Bee's Distance 35 30 25 Distance (km) 20 15 10 5 0 0 0. 1 0. 2 0. 3 0. 4 0. 5 Time (hr) 0. 6 0. 7 0. 8 0. 9 1
Bee's Displacement 0 0 0. 1 0. 2 0. 3 0. 4 0. 5 -2 -4 Displacement (km) -6 -8 -10 -12 -14 -16 Time (hr) 0. 6 0. 7 0. 8 0. 9 1
Time Progress in that second Total Displacemen t 1 2 2 4 3 2 6 4 3 9 5 3 12 6 3 15 7 3 18 8 1 19 9 1 20 10 1 21 11 -3 18 12 -3 15 13 -3 12 14 -3 9 15 -3 6 16 -3 3 17 -3 0
• Acceleration is the rate of change of the velocity • Acceleration is the slope of a velocity vs. time
Acceleration: 3 Ways Velocity Changes • Positive Acceleration – Velocity increases with time • Negative Acceleration – Velocity decreases with time • Radial Acceleration – Direction changes over time, turning
Bee's Velocity 30 Acceleration: 3 Ways Velocity Changes 20 • Positive acceleration Velocity (km/hr) 10 – Velocity increases with time • Negative acceleration 0 0 0. 05 0. 15 0. 25 0. 35 0. 45 0. 55 – Velocity decreases with time 0. 65 • Radial acceleration -10 – Direction of the velocity changes -20 -30 Time (hr) 0. 75 0. 85 0. 95 1
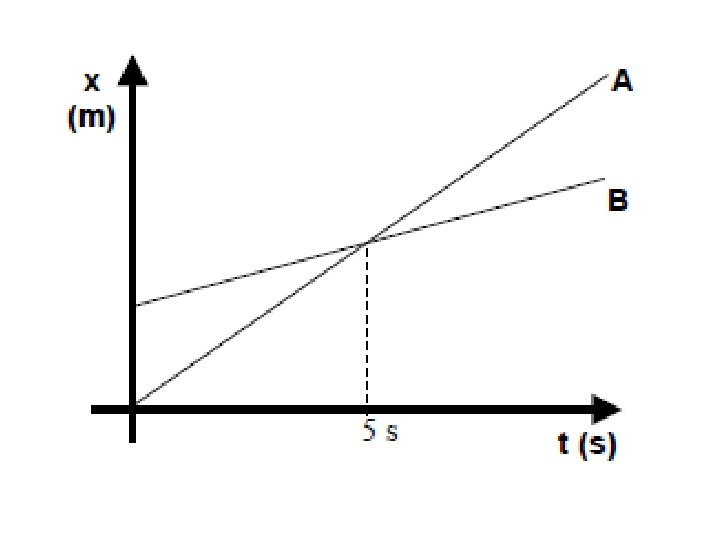
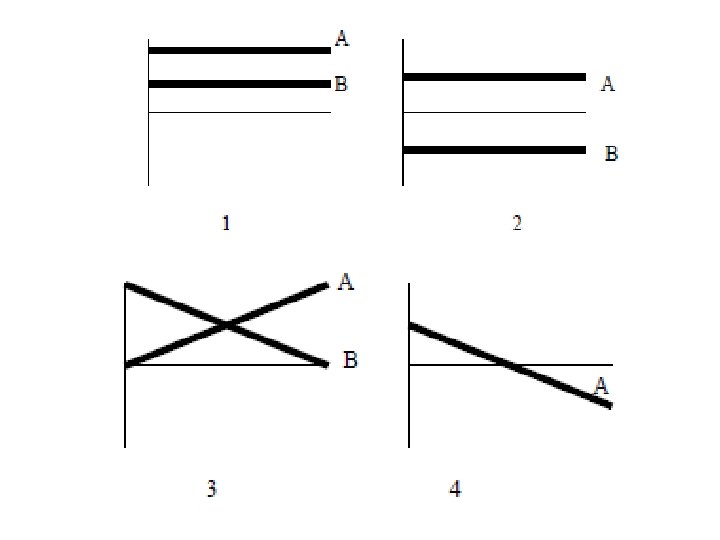
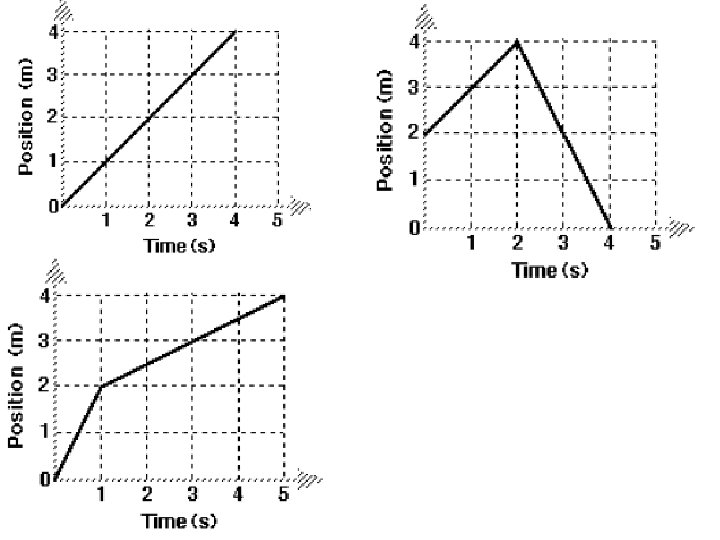
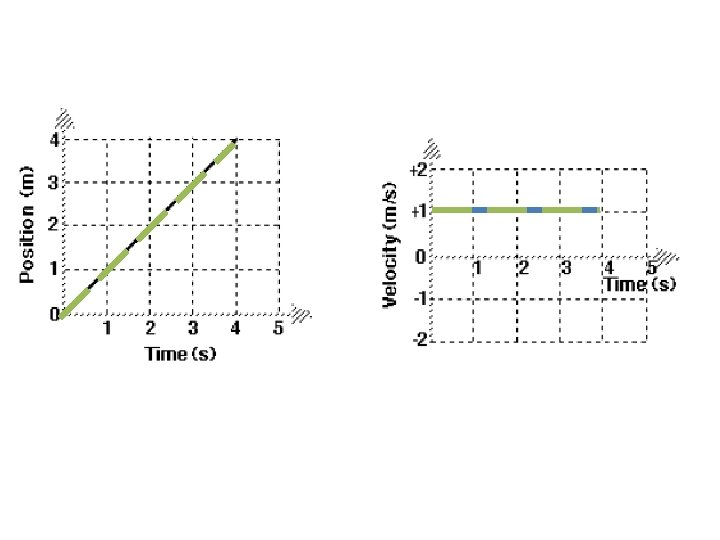
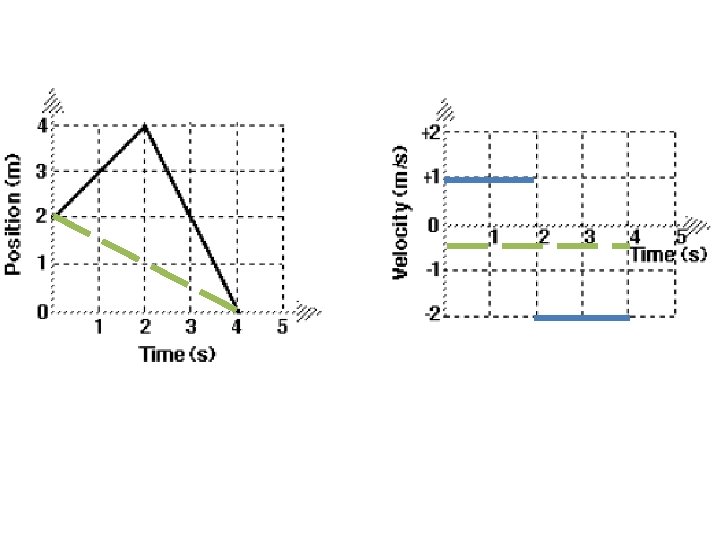
Tools for Describing Motion • Qualitative descriptions/stories • Position vs. time graph – Slope = velocity, y-intercept = initial position – Reference point is the “ 0” position – Direction determined by proximity to reference point • Position equation (constant velocity):
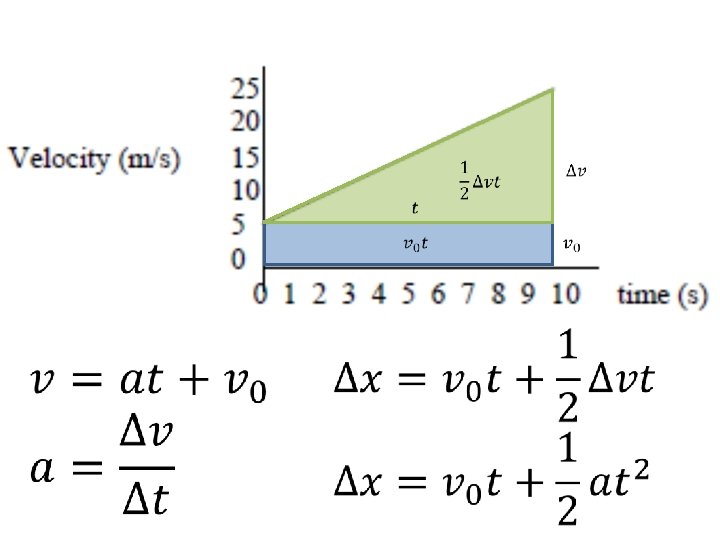
Tools for Describing Motion • Velocity vs. time graph – Slope = acceleration, y-intercept = initial velocity – Speed determined by proximity to “ 0” bar – Direction determined by quadrant of the graph – Area gives displacement • Velocity equation (constant acceleration): • Displacement equation (constant acceleration)
Another Tool: Motion Maps • Motion maps are bridges between the motion stories and graphs • Imagine taking pictures of a moving object, one every second, and putting them together • • How can we see the position of the car? Where do we see the time? How can we see the car’s velocity? How can we determine the direction of motion?
• Position information is shown by location the dots or arrows along the axis or grid • Time information is conveyed by the dots or arrows – The time between each is one unit of time • Velocity information is shown in the separation of the dots and length of the arrows • Direction information is shown by the direction of the arrows in relation to the axis
• If the car were traveling at a greater velocity, what would the time-lapse photo and motion map look like?
• What would the photos and motion map look like if the car was traveling in the opposite direction?
• How would you interpret the above motion map? – What happens to the velocity? – What happens to the direction? – What is happening right end of the motion map? – How could we figure out distance, displacement, and average velocity?
• What is the interpretation of this motion map of two cyclists? • Use the interpretation to construct a position vs. time graph for the cyclists. Consider: • Initial position • Velocity • Direction • Timing of events
• Go to the class website. Select “Downloads” under the Physics menu tab. Download and read Introduction to Motion Maps • After you have finished reading, go to the website below and practice working with motion maps. http: //www. intelligentdesigneronline. com /drhoades/advanced/reading/motion. Maps. html