Velocity vs Time Graphs slope velocity d t


 velocity")
 velocity")


- Slides: 23
Velocity vs Time Graphs slope = velocity d t slope = acceleration v area = distance t (Page 61 in Workbook)
If the graph is a horizontal line, there is no change in velocity, therefore there is no acceleration (the slope is 0). If the acceleration is positive then the slope is positive (the line moves upward to the right). If the acceleration is negative, then the slope is negative (the line moves downward to the right). ).
Calculating acceleration from a velocity-time graph The slope of a velocity-time graph is the acceleration.
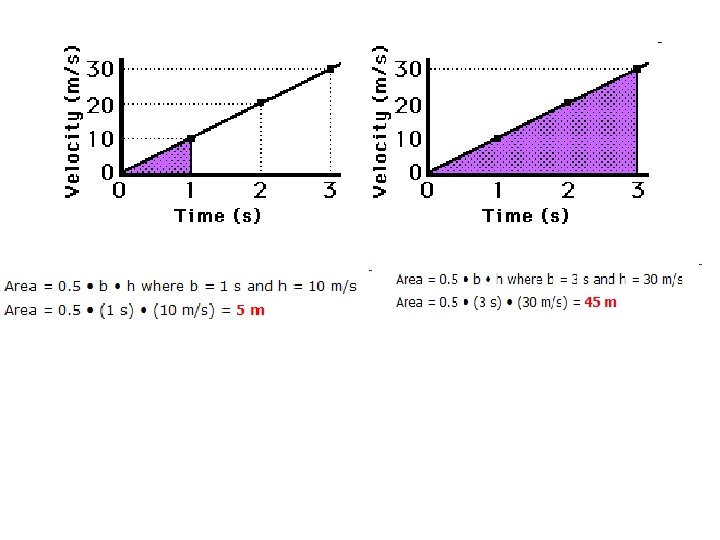
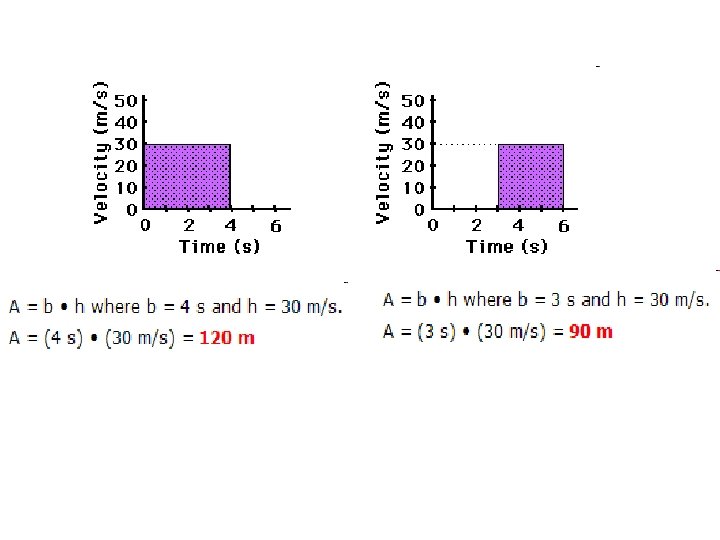
Calculating the distance on velocity-time graph. The area under the velocity-time graph gives the displacement of the object for the specified time interval. The velocity-time graph for constant acceleration is a straight line.
An object is moving in the positive direction if the line is located in the positive region of the graph (whether it is sloping up or sloping down). An object is moving in the negative direction if the line is located in the negative region of the graph (whether it is sloping up or sloping down). If a line crosses over the x-axis from the positive region to the negative region of the graph (or vice versa), then the object has changed directions.
The Average Velocity for each section of a velocity time graph is found by Adding the initial and final velocities with each section and dividing the sum by 2. Avg vel = (Vi + Vf) / 2
Velocity Time Graphs • How can you tell if the object is accelerating or decelerating? – Accelerating (speeding up) – when the magnitude of the velocity is increasing – Decelerating (slowing down) – when the magnitude of the velocity is decreasing
The object moves in the + direction at a constant speed - zero acceleration (interval A). The object then continues in the + direction while slowing down with a negative acceleration (interval B). Finally, the object moves at a constant speed in the + direction, slower than before (interval C).
The object moves in the + direction while slowing down; this involves a negative acceleration (interval A). It then remains at rest (interval B). The object then moves in the - direction while speeding up; this also involves a negative acceleration (interval C).
The object moves in the + direction with a constant velocity and zero acceleration (interval A). The object then slows down while moving in the + direction (i. e. , it has a negative acceleration) until it finally reaches a 0 velocity (stops) (interval B). Then the object moves in the - direction while speeding up; this corresponds to a - acceleration (interval C).
Constant positive (rightward) velocity
Constant negative (leftward) velocity
Rightward velocity with rightward acceleration.
Rightward Velocity and negative acceleration
Leftward velocity, leftward acceleration
Leftward velocity rightward acceleration
Graphs of Motion—Uniform Velocity • The area under a velocity vs time graph is the displacement of the object. – Find the distance traveled by each object.
Graph Practice
Which pair of graphs shows the same motion? Answer 1
http: //users. halpc. org/~clement/Simulations/Physlets/TST/Position. Time%20 Graphs. html
http: //www. phy. cuhk. edu. hk/contextual/mech anics/kin/motion_graph/x-t 02_e. html