Velocity Vectors and Distance Time Graphs Velocity is


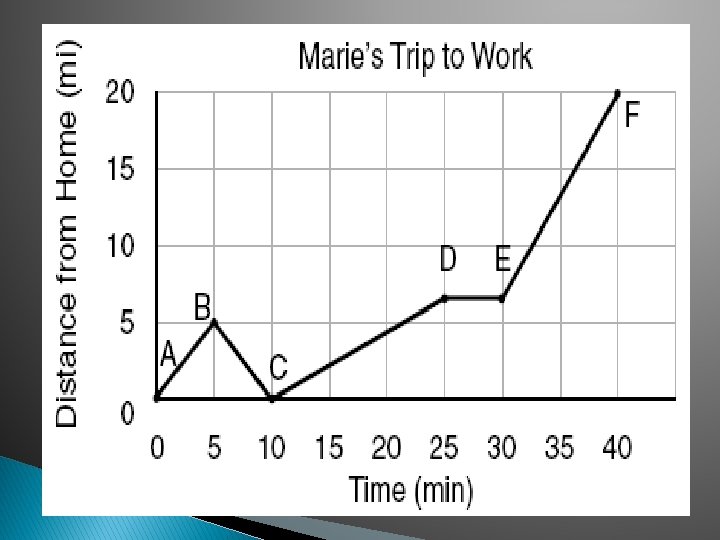
 to work (F) at various")


- Slides: 14
Velocity, Vectors and Distance Time Graphs
Velocity is speed in a given direction If you change either the speed or direction, the velocity has changed
Vector-a quantity that shows both size and direction Velocity- is an example of a vector because it has size (speed) and direction
Calculating Average Velocity Avg. Speed is total distance total time Avg. Velocity is the total distance from where you started, so with a round trip to anywhere, the average velocity is zero, because you ended where you started
A distance- time graph shows how both distance and speed change with time.
Time is on the horizontal axis, or X-axis and distance is on the vertical axis, or Y-axis. As an object moves, the distance it travel increases with time. This can be seen as a climbing, or rising, line on the graph.
A flat, or horizontal, line shows an interval of time where the speed is zero. No distance is being covered in a given period of time.
Steeper lines show intervals where the speed is greater than intervals with less steep lines.
The steepness, or slope of a line can be calculated by dividing the change in distance by the change in time for that time interval.
The accompanying graph shows Marie’s distance from home (A) to work (F) at various times during her drive.
Calculate the speed for each segment of Maria’s trip.
Marie left her briefcase at home and had to return to get it. State which point represents when she turned back around to go home and explain how you arrived at that conclusion.
Marie also had to wait at the railroad tracks for a train to pass. How long did she wait?