
VDOE Mathematics Update Virginia Council of Mathematics Specialists













- Slides: 88
VDOE Mathematics Update Virginia Council of Mathematics Specialists Fall 2016 Conference – Culpeper, VA VDOE Mathematics Team: Christa Southall, Mathematics Specialist Tina Mazzacane, Mathematics and Science Specialist Debbie Delozier, Mathematics Specialist 1
VDOE Mathematics Update Agenda • 2015 -2016 Statewide Mathematics Assessment Results • Computer Adaptive Testing • Test. Nav 8 Implementation • Revision and Adoption Process - 2016 Mathematics Standards of Learning and 2016 Mathematics Curriculum Framework • Revised Introductory Statements Refl ectio n Pa ge 2
2015 -2016 Statewide Mathematics Assessment Results 3
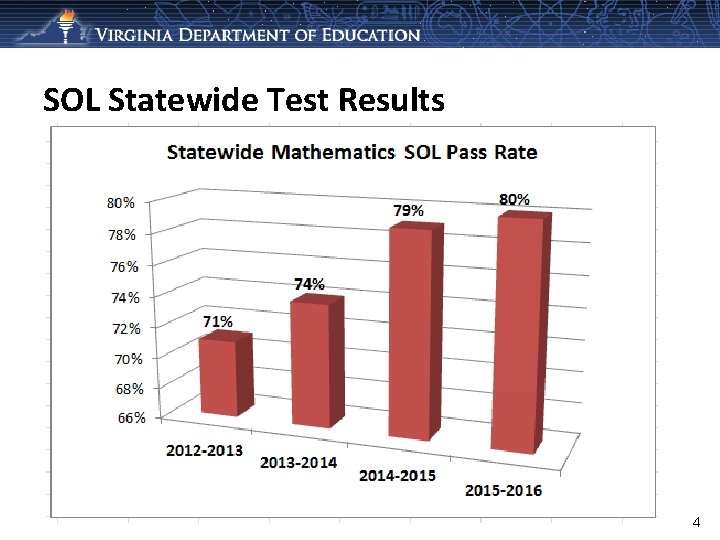
SOL Statewide Test Results 4
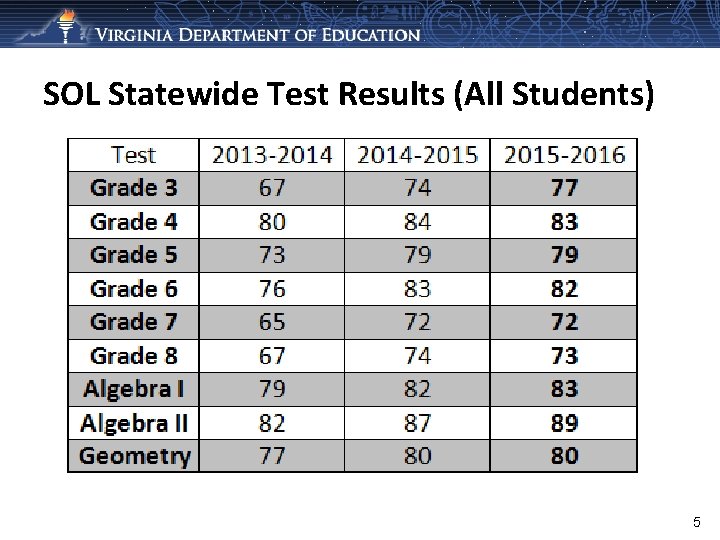
SOL Statewide Test Results (All Students) 5
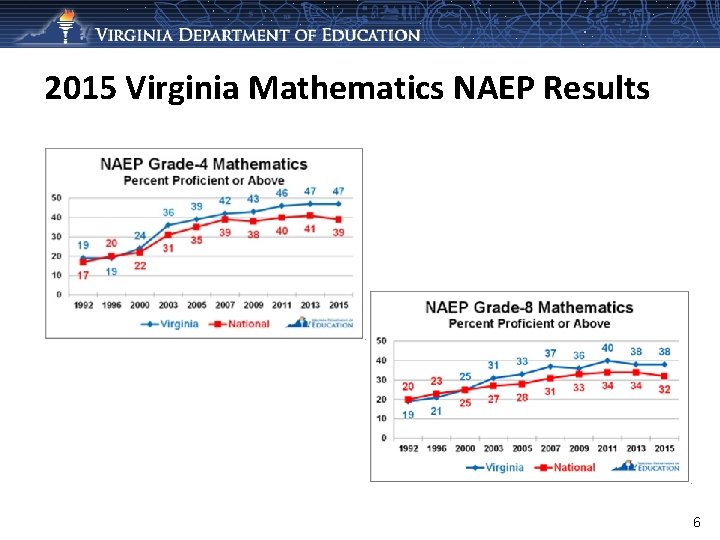
2015 Virginia Mathematics NAEP Results 6
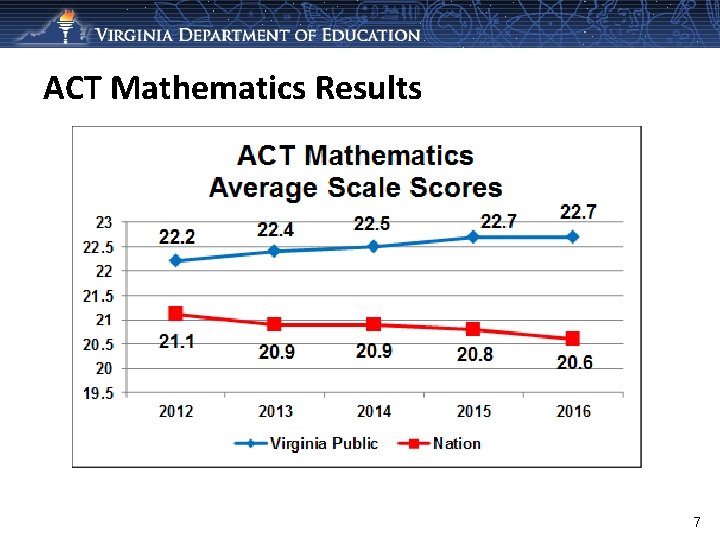
ACT Mathematics Results 7
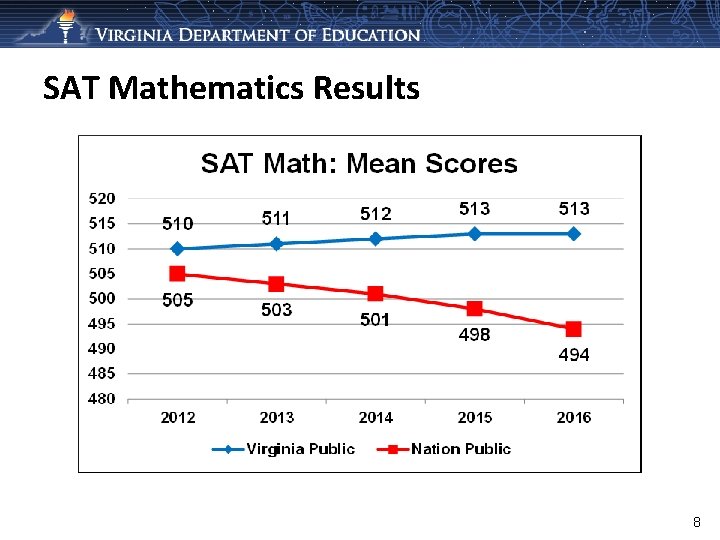
SAT Mathematics Results 8
Computer Adaptive Testing (CAT) and Test. Nav 8 Updates 9
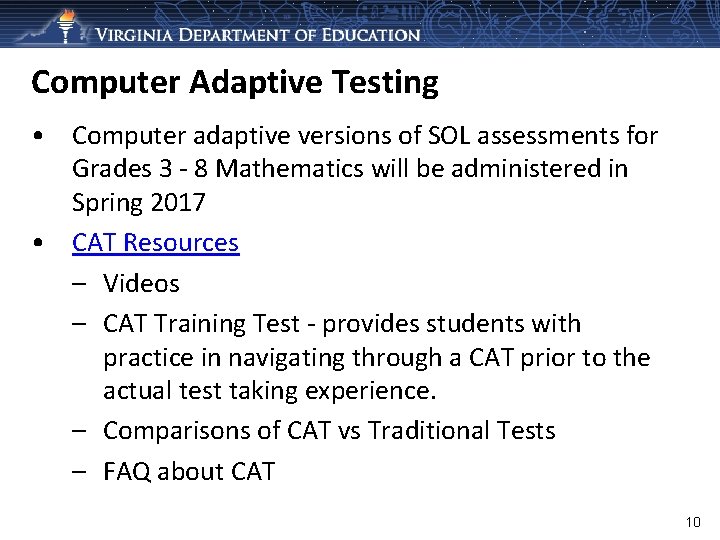
Computer Adaptive Testing • Computer adaptive versions of SOL assessments for Grades 3 - 8 Mathematics will be administered in Spring 2017 • CAT Resources – Videos – CAT Training Test - provides students with practice in navigating through a CAT prior to the actual test taking experience. – Comparisons of CAT vs Traditional Tests – FAQ about CAT 10
Transition from Test. Nav 7 to Test. Nav 8 • Superintendent’s Memo #048 -16 • Introduction to Test. Nav 8: Multiple. Choice/Technology-Enhanced Item Tests – PDF guide provides an overview to TN 8 and practice items 11
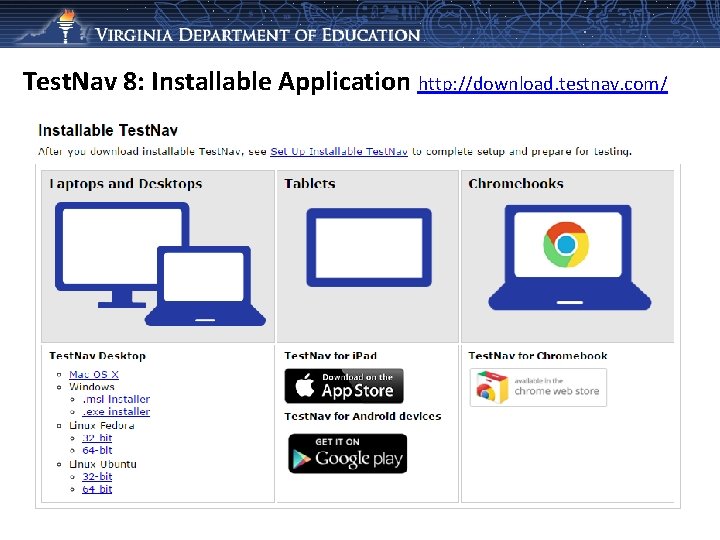
Test. Nav 8: Installable Application http: //download. testnav. com/ 12
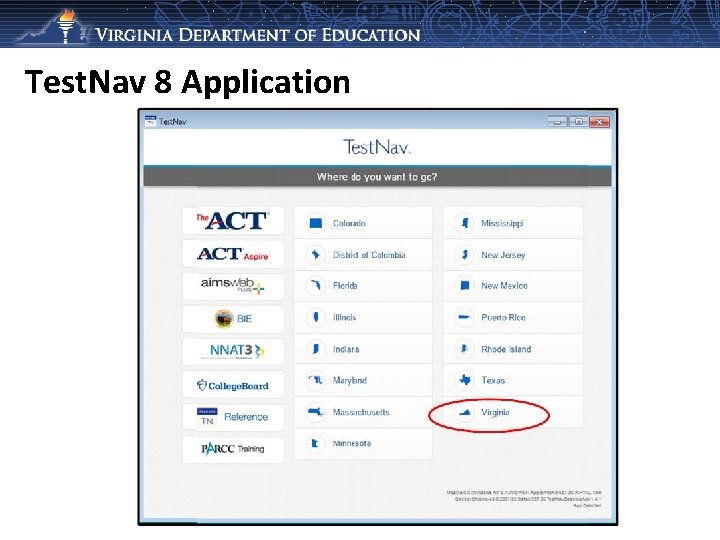
Test. Nav 8 Application 13
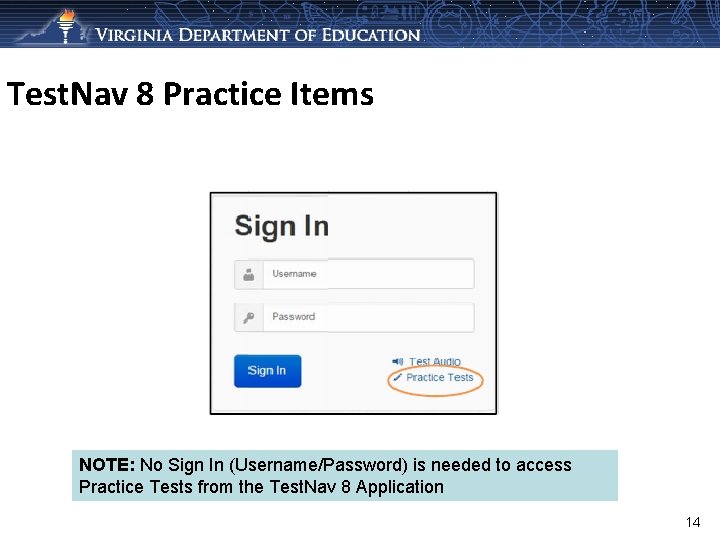
Test. Nav 8 Practice Items NOTE: No Sign In (Username/Password) is needed to access Practice Tests from the Test. Nav 8 Application 14
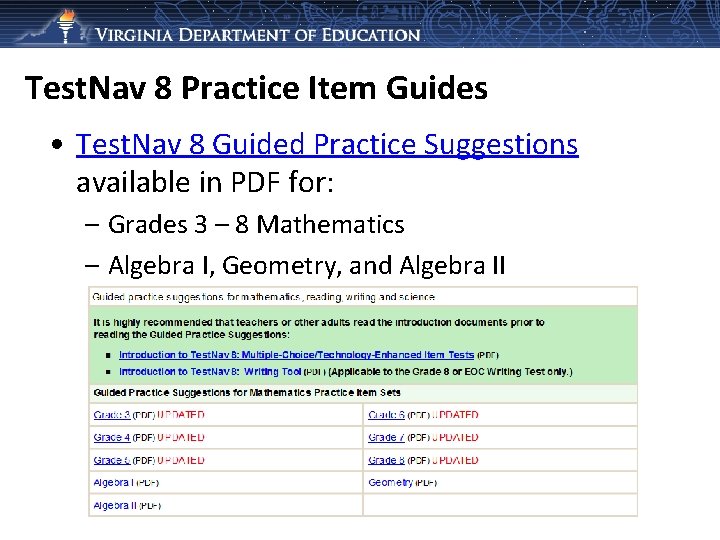
Test. Nav 8 Practice Item Guides • Test. Nav 8 Guided Practice Suggestions available in PDF for: – Grades 3 – 8 Mathematics – Algebra I, Geometry, and Algebra II 15
Test. Nav 8 Features • Utilizes Responsive Design concepts – Items are no longer presented as static images. – Item presentation will vary based on the type and size of device used for testing. • Supports the use of additional accessibility features – Offers some new accessibility features for online Standards of Learning tests immediately. – Provides a foundation for additional features in the future. – Does not eliminate the need for existing special forms such as braille and large print test forms. 16
Test. Nav 8 Mathematics Tools Practice • Mathematics Tools Practice will be updated to Test. Nav 8 for: – Grades 3 -8 Tools Practice – End-of-Course Tools Practice 17
Important: Practice Items & Guides • Teachers need to read Introduction to Test. Nav 8: Multiple-Choice/Technology-Enhanced Item Tests • Students need to have experience with Mathematics Practice Item Sets, with teacher/adult using Test. Nav 8 Guided Practice Suggestions for the appropriate grade/course 18
Algebra Readiness Diagnostic Test (ARDT) • Diagnostic assessment administered to students that are identified as “at risk” of failing the Algebra I SOL • Those who are identified for remediation/intervention will also take a post-test following remediation/ intervention • Delayed administration dates for 2016 -2017 – Testing window opening – anticipated late November – Delay due to the necessary conversion from Test. Nav 7. 5 to Test. Nav 8 19
2016 Standards Adoption and Implementation 20
Mathematics SOL Revision Process • March 2015 – BOE initiated Review Process • March 27 -April 27, 2015 – Public comment period and committee applications received • June 2015 – Review committee met • November 2015 – Review by IHE, business community, and mathematics organizations • March 17, 2016 – First review by BOE (followed by public comment period and public hearings) • September 22, 2016 – BOE Approved 2016 Standards of Learning and 2016 Curriculum Framework (for additional information see Superintendent’s Memo 244 -16) 21
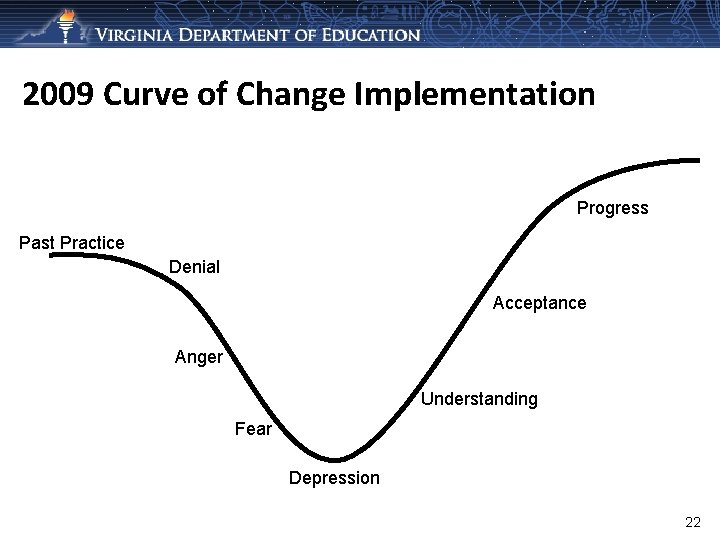
2009 Curve of Change Implementation Progress Past Practice Denial Acceptance Anger Understanding Fear Depression 22
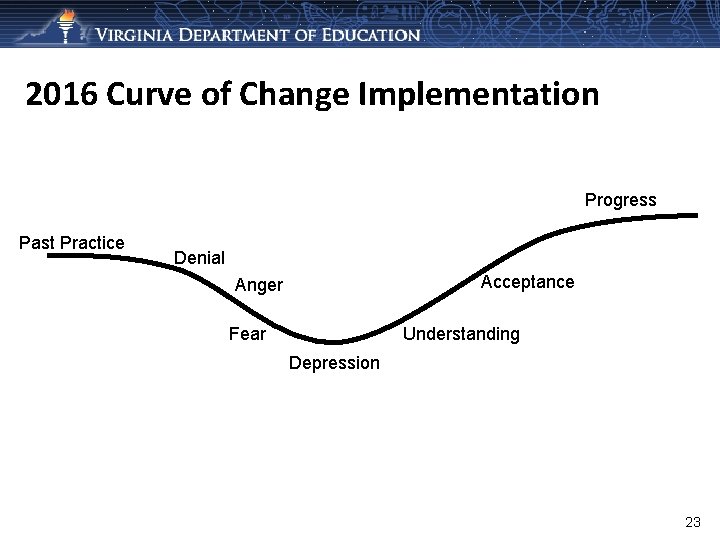
2016 Curve of Change Implementation Progress Past Practice Denial Acceptance Anger Fear Understanding Depression 23
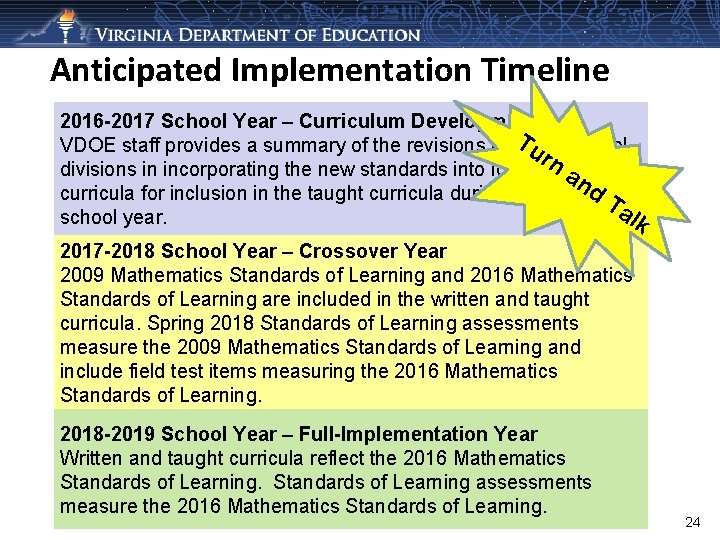
Anticipated Implementation Timeline 2016 -2017 School Year – Curriculum Development Tu VDOE staff provides a summary of the revisions to assist school rn divisions in incorporating the new standards into local written an d curricula for inclusion in the taught curricula during the 2017 -2018 Ta school year. lk 2017 -2018 School Year – Crossover Year 2009 Mathematics Standards of Learning and 2016 Mathematics Standards of Learning are included in the written and taught curricula. Spring 2018 Standards of Learning assessments measure the 2009 Mathematics Standards of Learning and include field test items measuring the 2016 Mathematics Standards of Learning. 2018 -2019 School Year – Full-Implementation Year Written and taught curricula reflect the 2016 Mathematics Standards of Learning assessments measure the 2016 Mathematics Standards of Learning. 24
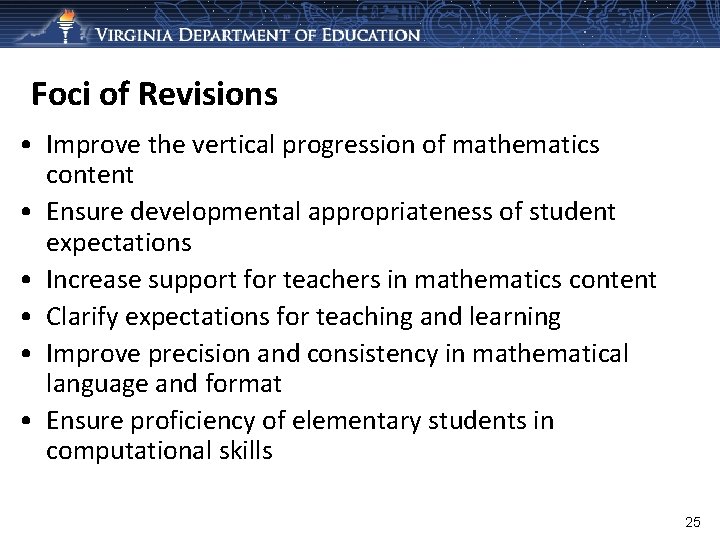
Foci of Revisions • Improve the vertical progression of mathematics content • Ensure developmental appropriateness of student expectations • Increase support for teachers in mathematics content • Clarify expectations for teaching and learning • Improve precision and consistency in mathematical language and format • Ensure proficiency of elementary students in computational skills 25
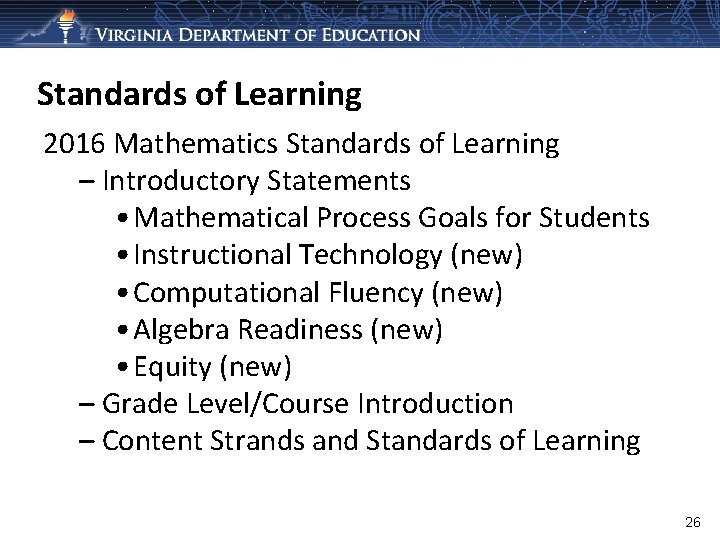
Standards of Learning 2016 Mathematics Standards of Learning – Introductory Statements • Mathematical Process Goals for Students • Instructional Technology (new) • Computational Fluency (new) • Algebra Readiness (new) • Equity (new) – Grade Level/Course Introduction – Content Strands and Standards of Learning 26
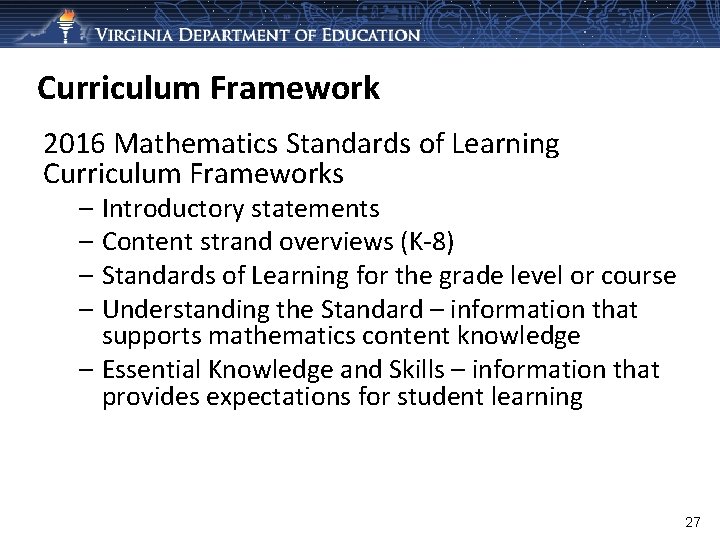
Curriculum Framework 2016 Mathematics Standards of Learning Curriculum Frameworks – Introductory statements – Content strand overviews (K-8) – Standards of Learning for the grade level or course – Understanding the Standard – information that supports mathematics content knowledge – Essential Knowledge and Skills – information that provides expectations for student learning 27
Mathematics Process Goals for Students “The content of the mathematics standards is intended to support the five process goals for students” - 2009 and 2016 Mathematics Standards of Learning Communication Connections Problem Solving Representations Mathematical Understanding Reasoning 28
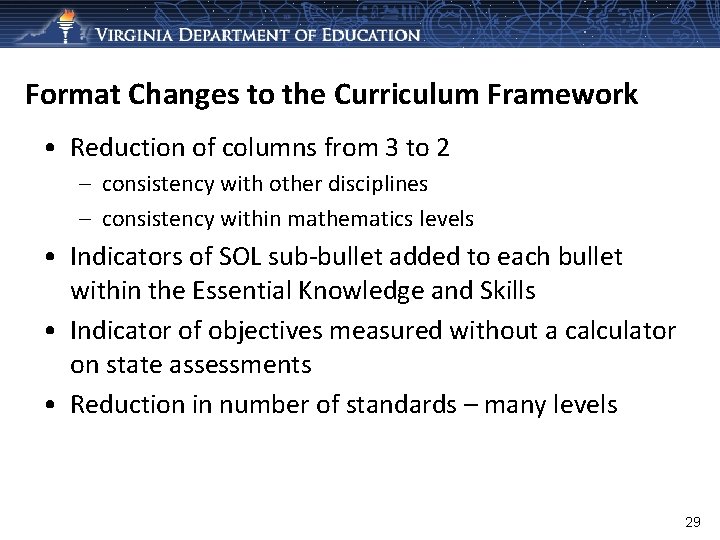
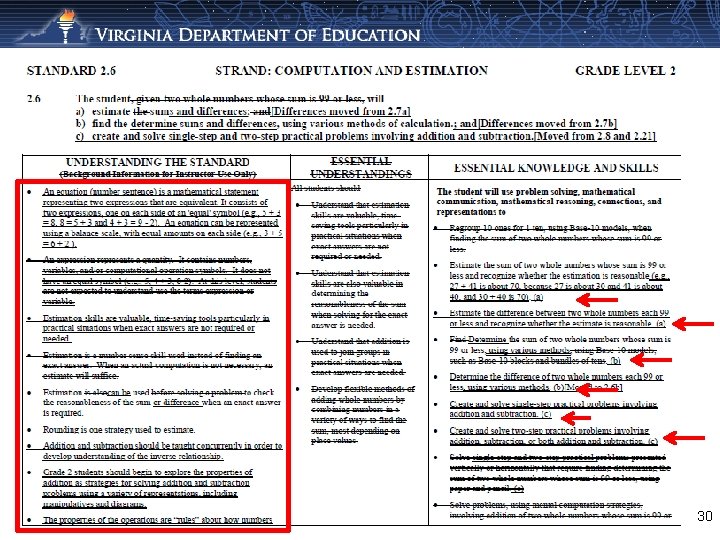
Format Changes to the Curriculum Framework • Reduction of columns from 3 to 2 – consistency with other disciplines – consistency within mathematics levels • Indicators of SOL sub-bullet added to each bullet within the Essential Knowledge and Skills • Indicator of objectives measured without a calculator on state assessments • Reduction in number of standards – many levels 29
30
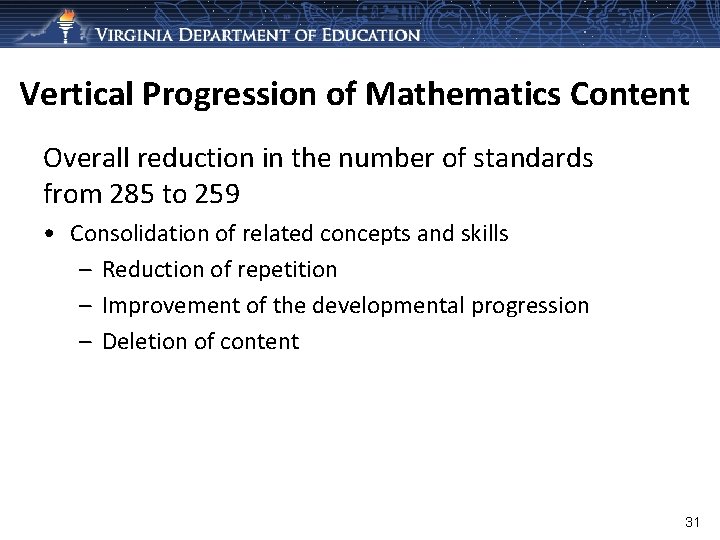
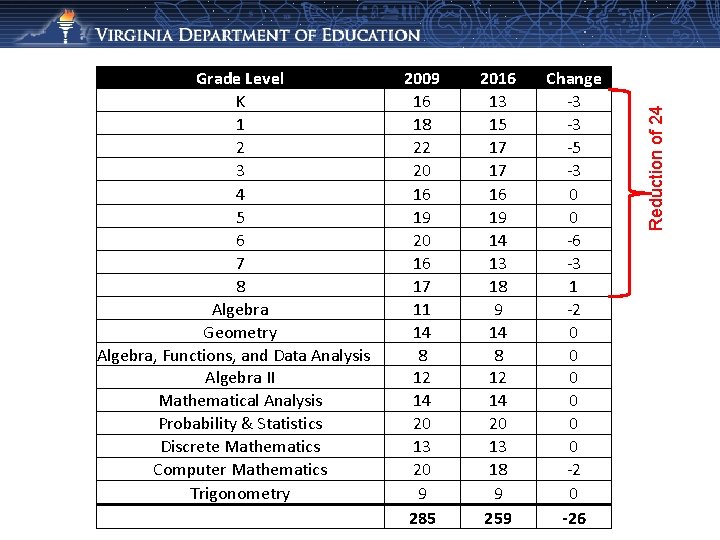
Vertical Progression of Mathematics Content Overall reduction in the number of standards from 285 to 259 • Consolidation of related concepts and skills – Reduction of repetition – Improvement of the developmental progression – Deletion of content 31
2009 16 18 22 20 16 19 20 16 17 11 14 8 12 14 20 13 20 9 285 2016 13 15 17 17 16 19 14 13 18 9 14 8 12 14 20 13 18 9 259 Change -3 -3 -5 -3 0 0 -6 -3 1 -2 0 0 0 -26 Reduction of 24 Grade Level K 1 2 3 4 5 6 7 8 Algebra Geometry Algebra, Functions, and Data Analysis Algebra II Mathematical Analysis Probability & Statistics Discrete Mathematics Computer Mathematics Trigonometry
Support for Teachers • Significant additions to the Understanding the Standard column including – – Definitions Explanations Examples Instructional connections • Improvements in precision, clarity, and consistency in language K-12 33
Table Talk – Introductory Statements • Read excerpt from Introductory statements • Think about implications for your work • Round robin share out to discuss impacts on instruction with whole table 34
Instructional Technology “The use of appropriate technology and the interpretation of the results from applying technology tools must be an integral part of teaching, learning, and assessment. However, facility in the use of technology shall not be regarded as a substitute for a student’s understanding of quantitative and algebraic concepts and relationships or for proficiency in basic computations. ” 35
Computational Fluency “Mathematics instruction must develop students’ conceptual understanding, computational fluency, and problem-solving skills. The development of related conceptual understanding and computational skills should be balanced and intertwined, each supporting the other and reinforcing learning. Computational fluency refers to having flexible, efficient and accurate methods for computing. Students exhibit computational fluency when they demonstrategic thinking and flexibility in the computational methods they choose, understand can explain, and produce accurate answers efficiently. ” 36
Algebra Readiness ““Algebra readiness” describes the mastery of, and the ability to apply, the Mathematics Standards of Learning, including the Mathematical Process Goals for Students, for kindergarten through grade 8. The study of algebraic thinking begins in kindergarten and is progressively formalized prior to the study of the algebraic content found in the Algebra I Standards of Learning. ” 37
Algebra Readiness • Introduction to the 2009 Grade 7 Mathematics SOL – “Students who successfully complete the seventh. D E V grade standards should be prepared to study O M E R Algebra I in grade eight. ” • Replaced with an introductory paragraph – ““Algebra readiness” describes the mastery of, and the ability to apply, the Mathematics Standards of Learning, including the Mathematical Process Goals for Students, for kindergarten 38 through grade 8. ”
Equity “Mathematics programs should have an expectation of equity by providing all students access to quality mathematics instruction and offerings that are responsive to and respectful of students’ prior experiences, talents, interests, and cultural perspectives. Successful mathematics programs challenge students to maximize their academic potential and provide consistent monitoring, support, and encouragement to ensure success for all. ” 39
Overview of 2016 Crosswalk (Summary of Revisions) Documents 40
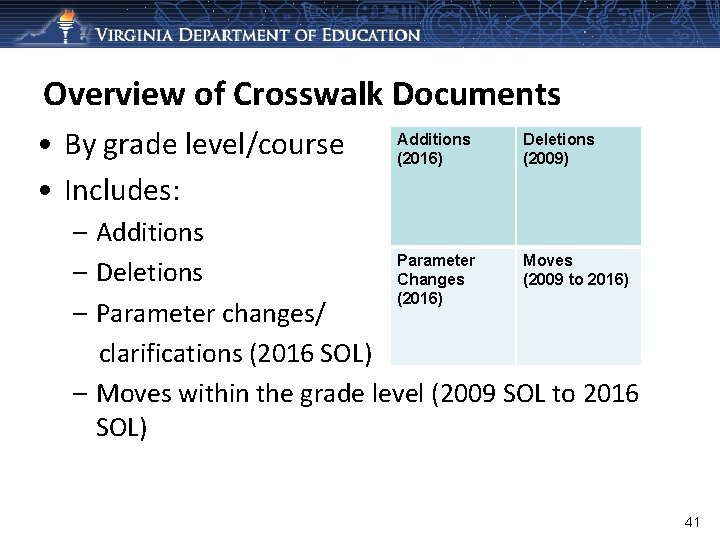
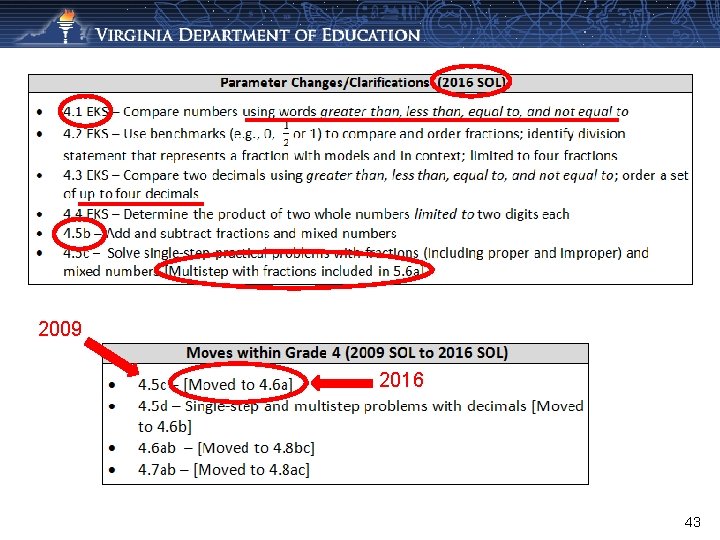
Overview of Crosswalk Documents • By grade level/course • Includes: Additions (2016) Deletions (2009) – Additions Parameter Moves – Deletions Changes (2009 to 2016) (2016) – Parameter changes/ clarifications (2016 SOL) – Moves within the grade level (2009 SOL to 2016 SOL) 41
Grade Level Summary of Revisions 42
2009 2016 43
44
Grades K-2 2016 Standards of Learning and Curriculum Framework Revisions 45
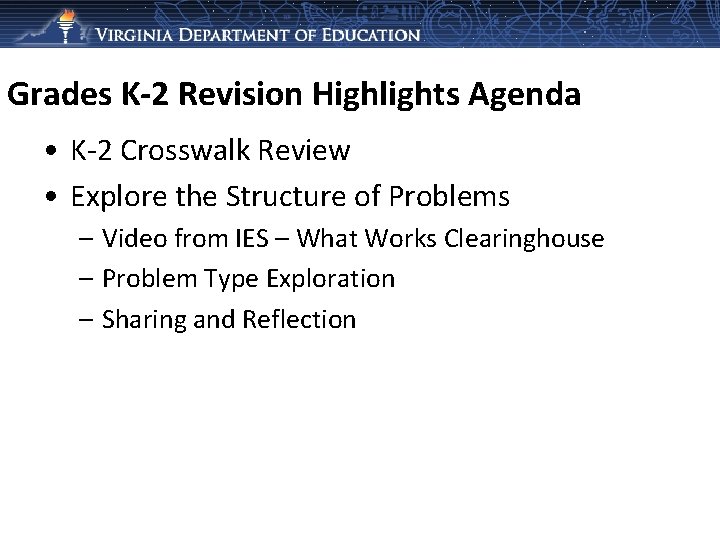
Grades K-2 Revision Highlights Agenda • K-2 Crosswalk Review • Explore the Structure of Problems – Video from IES – What Works Clearinghouse – Problem Type Exploration – Sharing and Reflection
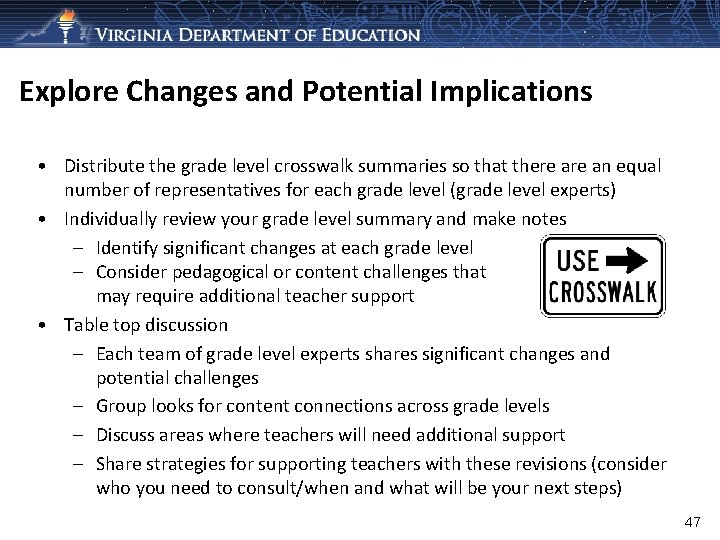
Explore Changes and Potential Implications • Distribute the grade level crosswalk summaries so that there an equal number of representatives for each grade level (grade level experts) • Individually review your grade level summary and make notes – Identify significant changes at each grade level – Consider pedagogical or content challenges that may require additional teacher support • Table top discussion – Each team of grade level experts shares significant changes and potential challenges – Group looks for content connections across grade levels – Discuss areas where teachers will need additional support – Share strategies for supporting teachers with these revisions (consider who you need to consult/when and what will be your next steps) 47
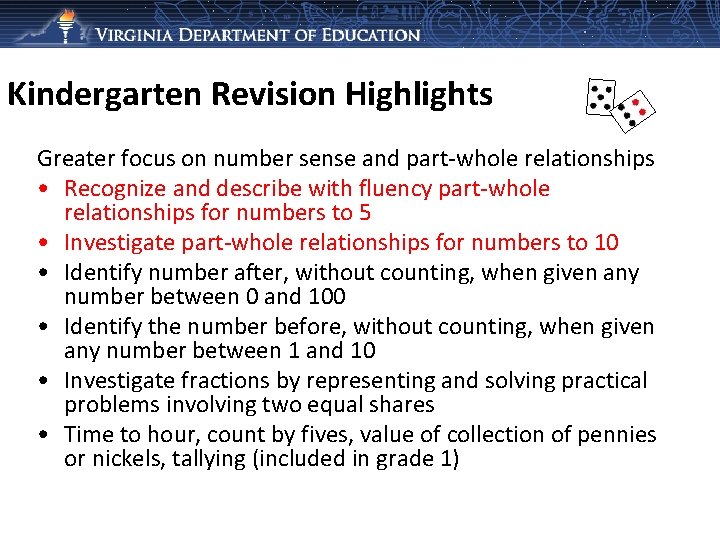
Kindergarten Revision Highlights Greater focus on number sense and part-whole relationships • Recognize and describe with fluency part-whole relationships for numbers to 5 • Investigate part-whole relationships for numbers to 10 • Identify number after, without counting, when given any number between 0 and 100 • Identify the number before, without counting, when given any number between 1 and 10 • Investigate fractions by representing and solving practical problems involving two equal shares • Time to hour, count by fives, value of collection of pennies or nickels, tallying (included in grade 1)
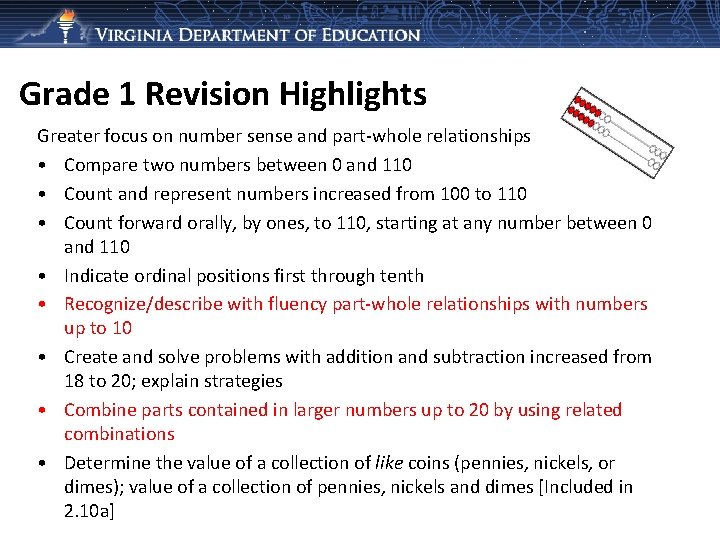
Grade 1 Revision Highlights Greater focus on number sense and part-whole relationships • Compare two numbers between 0 and 110 • Count and represent numbers increased from 100 to 110 • Count forward orally, by ones, to 110, starting at any number between 0 and 110 • Indicate ordinal positions first through tenth • Recognize/describe with fluency part-whole relationships with numbers up to 10 • Create and solve problems with addition and subtraction increased from 18 to 20; explain strategies • Combine parts contained in larger numbers up to 20 by using related combinations • Determine the value of a collection of like coins (pennies, nickels, or dimes); value of a collection of pennies, nickels and dimes [Included in 2. 10 a]
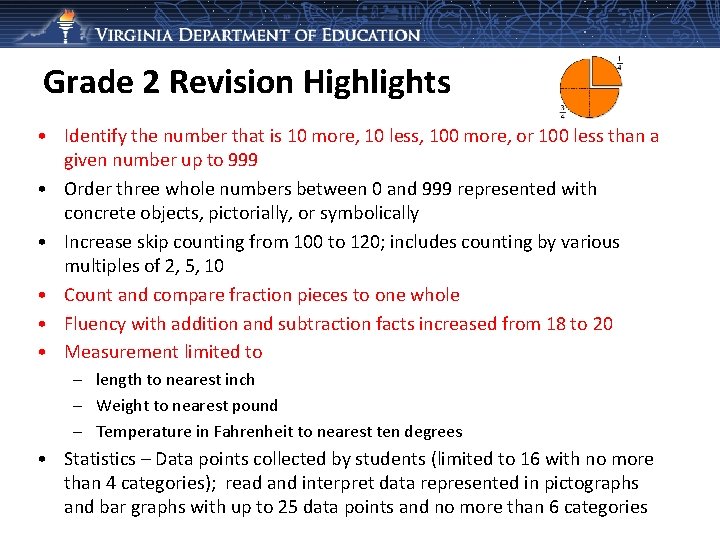
Grade 2 Revision Highlights • Identify the number that is 10 more, 10 less, 100 more, or 100 less than a given number up to 999 • Order three whole numbers between 0 and 999 represented with concrete objects, pictorially, or symbolically • Increase skip counting from 100 to 120; includes counting by various multiples of 2, 5, 10 • Count and compare fraction pieces to one whole • Fluency with addition and subtraction facts increased from 18 to 20 • Measurement limited to – length to nearest inch – Weight to nearest pound – Temperature in Fahrenheit to nearest ten degrees • Statistics – Data points collected by students (limited to 16 with no more than 4 categories); read and interpret data represented in pictographs and bar graphs with up to 25 data points and no more than 6 categories
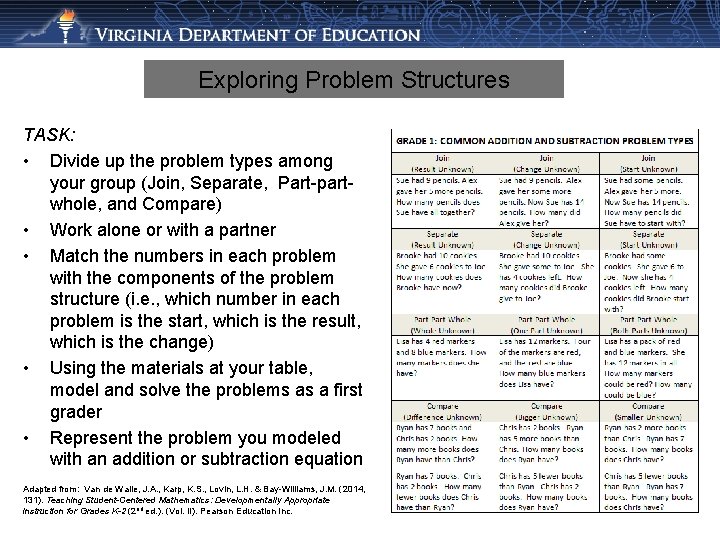
Exploring the Structure of Problems • Problem structure charts have been included in the curriculum frameworks • Instruction should include solving word problems based on common underlying structures – Video - Assisting Students Struggling with Mathematics: Response to Intervention (Rt. I) Recommendation #4 Gersten, R, et. Al. (2009) Assisting students struggling with mathematics: Response to intervention (Rt. I) for elementary and middle schools (NCEE 2009 -4060). Washington, DC: USDOE.
Exploring Problem Structures TASK: • Divide up the problem types among your group (Join, Separate, Part-partwhole, and Compare) • Work alone or with a partner • Match the numbers in each problem with the components of the problem structure (i. e. , which number in each problem is the start, which is the result, which is the change) • Using the materials at your table, model and solve the problems as a first grader • Represent the problem you modeled with an addition or subtraction equation Adapted from: Van de Walle, J. A. , Karp, K. S. , Lovin, L. H. & Bay-Williams, J. M. (2014, 131). Teaching Student-Centered Mathematics: Developmentally Appropriate Instruction for Grades K-2 (2 nd ed. ). (Vol. II). Pearson Education Inc.
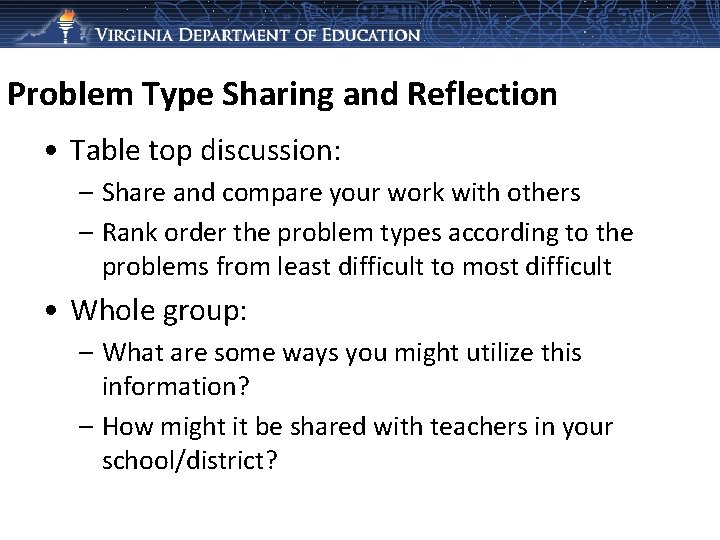
Problem Type Sharing and Reflection • Table top discussion: – Share and compare your work with others – Rank order the problem types according to the problems from least difficult to most difficult • Whole group: – What are some ways you might utilize this information? – How might it be shared with teachers in your school/district?
Grades 3 -5 2016 Standards of Learning and Curriculum Framework Revisions 54
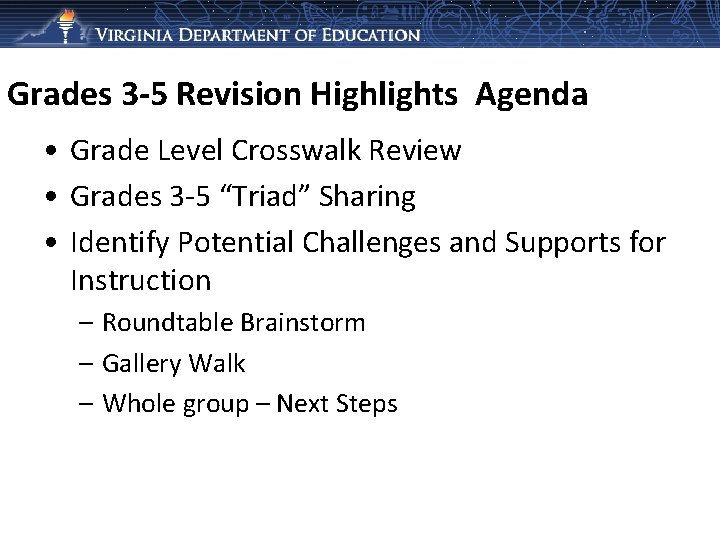
Grades 3 -5 Revision Highlights Agenda • Grade Level Crosswalk Review • Grades 3 -5 “Triad” Sharing • Identify Potential Challenges and Supports for Instruction – Roundtable Brainstorm – Gallery Walk – Whole group – Next Steps
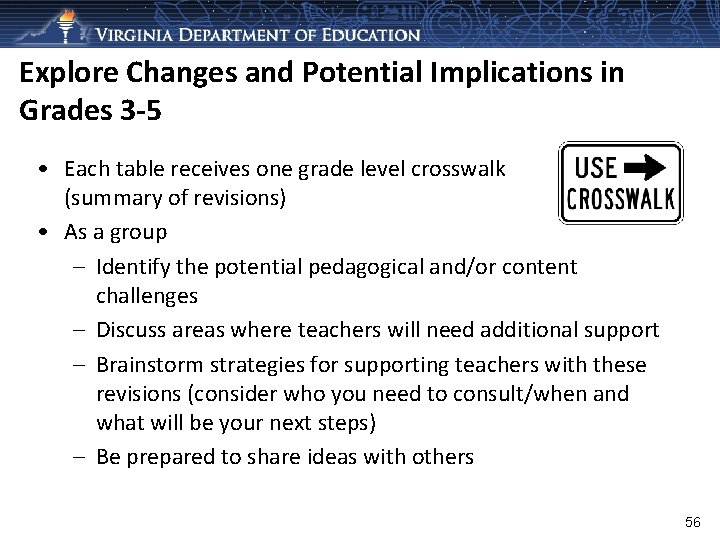
Explore Changes and Potential Implications in Grades 3 -5 • Each table receives one grade level crosswalk (summary of revisions) • As a group – Identify the potential pedagogical and/or content challenges – Discuss areas where teachers will need additional support – Brainstorm strategies for supporting teachers with these revisions (consider who you need to consult/when and what will be your next steps) – Be prepared to share ideas with others 56
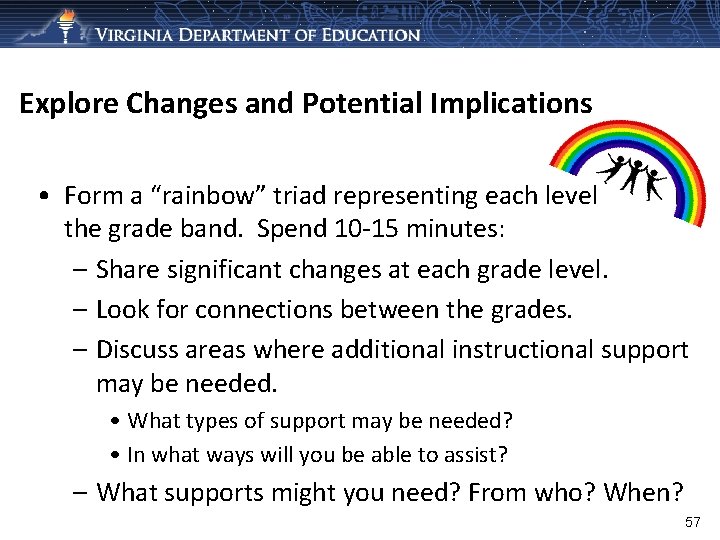
Explore Changes and Potential Implications • Form a “rainbow” triad representing each level in the grade band. Spend 10 -15 minutes: – Share significant changes at each grade level. – Look for connections between the grades. – Discuss areas where additional instructional support may be needed. • What types of support may be needed? • In what ways will you be able to assist? – What supports might you need? From who? When? 57
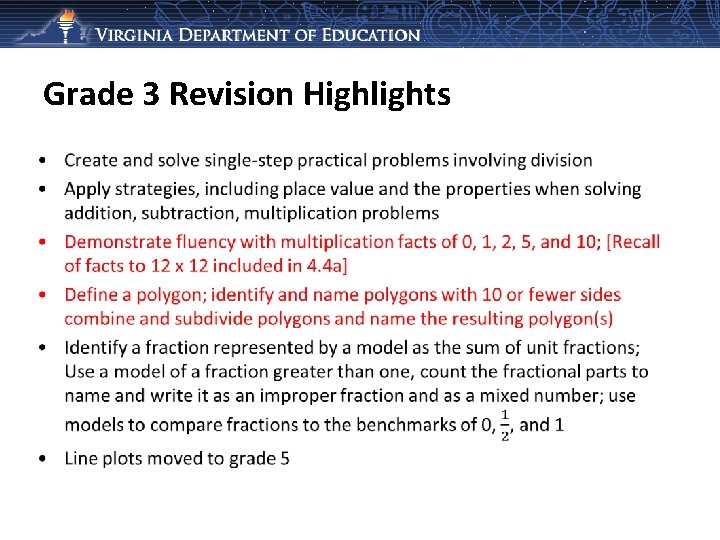
Grade 3 Revision Highlights •
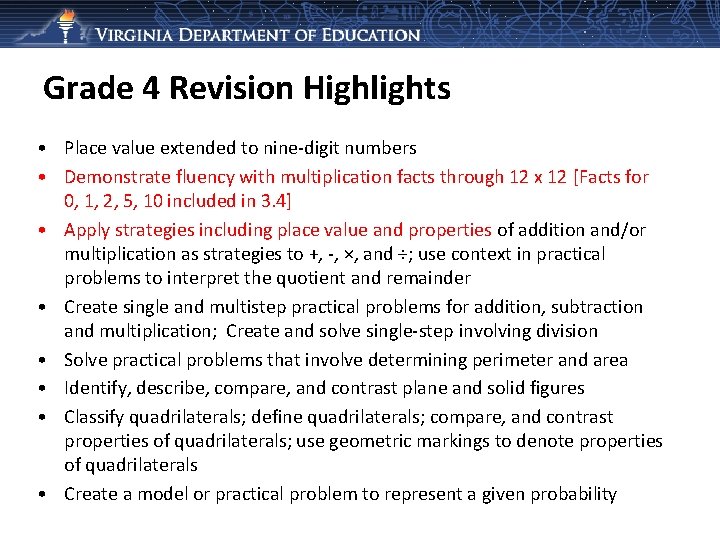
Grade 4 Revision Highlights • Place value extended to nine-digit numbers • Demonstrate fluency with multiplication facts through 12 x 12 [Facts for 0, 1, 2, 5, 10 included in 3. 4] • Apply strategies including place value and properties of addition and/or multiplication as strategies to +, -, ×, and ÷; use context in practical problems to interpret the quotient and remainder • Create single and multistep practical problems for addition, subtraction and multiplication; Create and solve single-step involving division • Solve practical problems that involve determining perimeter and area • Identify, describe, compare, and contrast plane and solid figures • Classify quadrilaterals; define quadrilaterals; compare, and contrast properties of quadrilaterals; use geometric markings to denote properties of quadrilaterals • Create a model or practical problem to represent a given probability
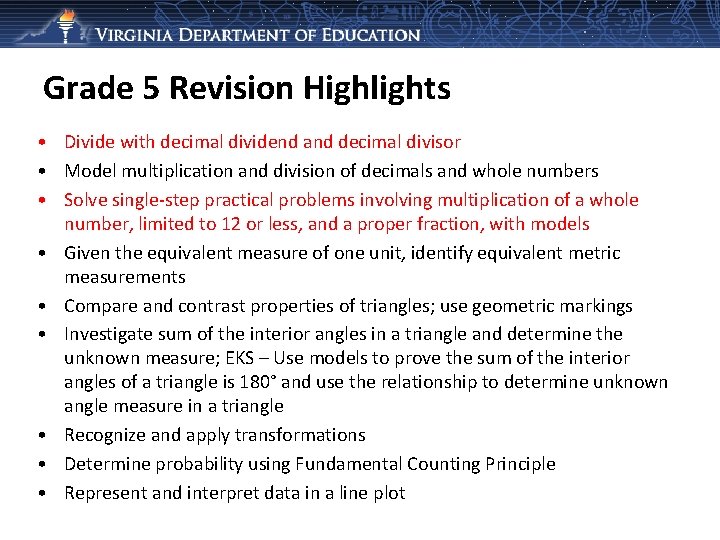
Grade 5 Revision Highlights • Divide with decimal dividend and decimal divisor • Model multiplication and division of decimals and whole numbers • Solve single-step practical problems involving multiplication of a whole number, limited to 12 or less, and a proper fraction, with models • Given the equivalent measure of one unit, identify equivalent metric measurements • Compare and contrast properties of triangles; use geometric markings • Investigate sum of the interior angles in a triangle and determine the unknown measure; EKS – Use models to prove the sum of the interior angles of a triangle is 180° and use the relationship to determine unknown angle measure in a triangle • Recognize and apply transformations • Determine probability using Fundamental Counting Principle • Represent and interpret data in a line plot
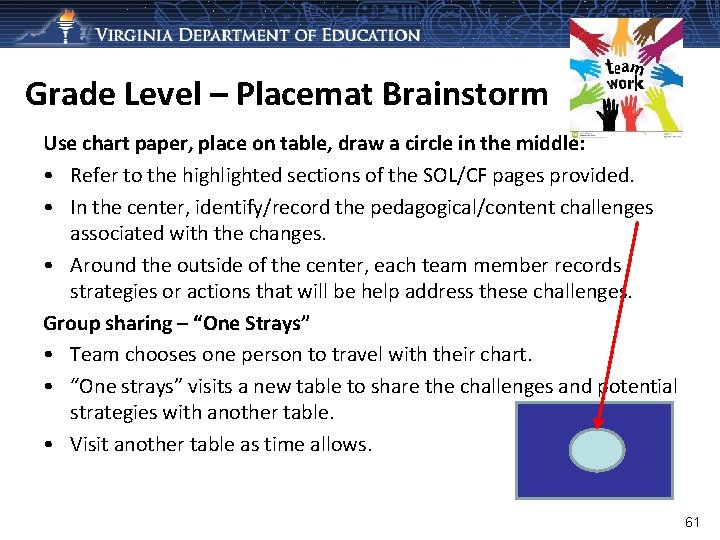
Grade Level – Placemat Brainstorm Use chart paper, place on table, draw a circle in the middle: • Refer to the highlighted sections of the SOL/CF pages provided. • In the center, identify/record the pedagogical/content challenges associated with the changes. • Around the outside of the center, each team member records strategies or actions that will be help address these challenges. Group sharing – “One Strays” • Team chooses one person to travel with their chart. • “One strays” visits a new table to share the challenges and potential strategies with another table. • Visit another table as time allows. 61
Grades 6 -8 and Algebra I 2016 Standards of Learning and Curriculum Framework Revisions 62
Grades 6 -8 & Algebra I Revision Highlights Agenda • 6 -8 & Algebra I Crosswalk Activity • Algebra I Equation Activity • Explore Patterns, Functions and Algebra 6 -8
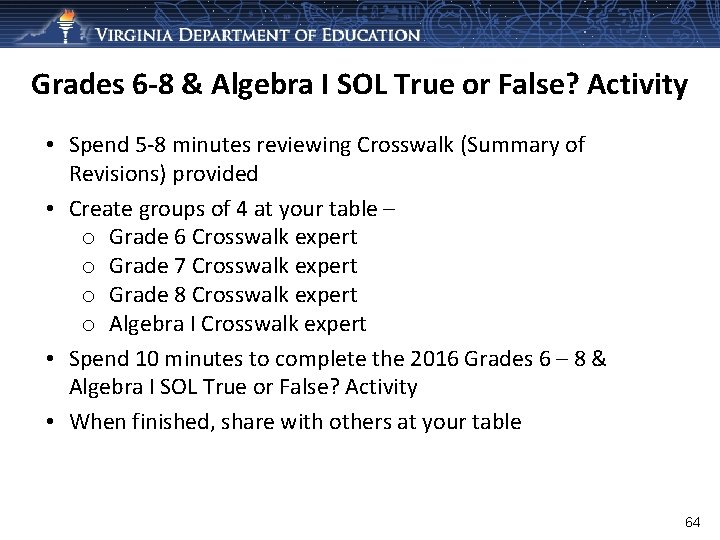
Grades 6 -8 & Algebra I SOL True or False? Activity • Spend 5 -8 minutes reviewing Crosswalk (Summary of Revisions) provided • Create groups of 4 at your table – o Grade 6 Crosswalk expert o Grade 7 Crosswalk expert o Grade 8 Crosswalk expert o Algebra I Crosswalk expert • Spend 10 minutes to complete the 2016 Grades 6 – 8 & Algebra I SOL True or False? Activity • When finished, share with others at your table 64
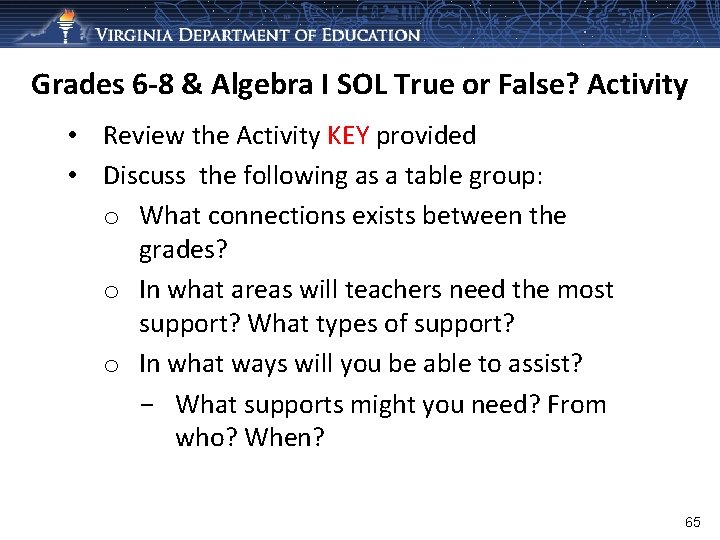
Grades 6 -8 & Algebra I SOL True or False? Activity • Review the Activity KEY provided • Discuss the following as a table group: o What connections exists between the grades? o In what areas will teachers need the most support? What types of support? o In what ways will you be able to assist? - What supports might you need? From who? When? 65
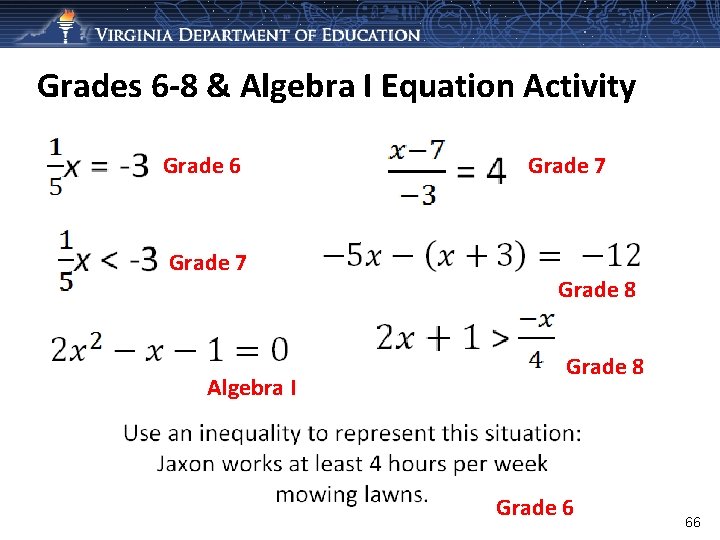
Grades 6 -8 & Algebra I Equation Activity Grade 6 Grade 7 Algebra I Grade 7 Grade 8 Grade 6 66
2009 Patterns, Functions and Algebra 7. 12 The student will represent relationships with tables, graphs, rules, and words. 8. 14 The student will make connections between any two representations (tables, graphs, words, and rules) of a given relationship. 67
Grades 6 Patterns, Functions and Algebra SOL 6. 12 The student will a) represent proportional relationships between two quantities b) determine the unit rate of a proportional relationship and use it to find the missing value in a ratio table c) determine if a proportional relationship exists between two quantities; and d) make connections between and among representations of a proportional relationship between two quantities using verbal descriptions, ratio tables, and graphs. 68
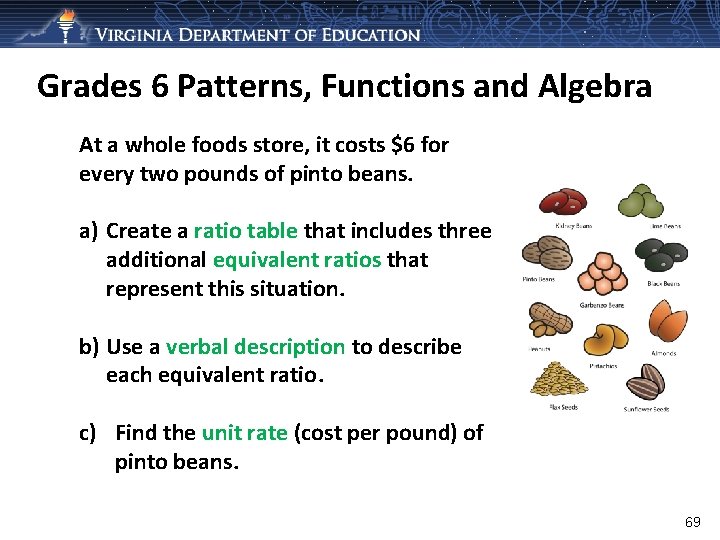
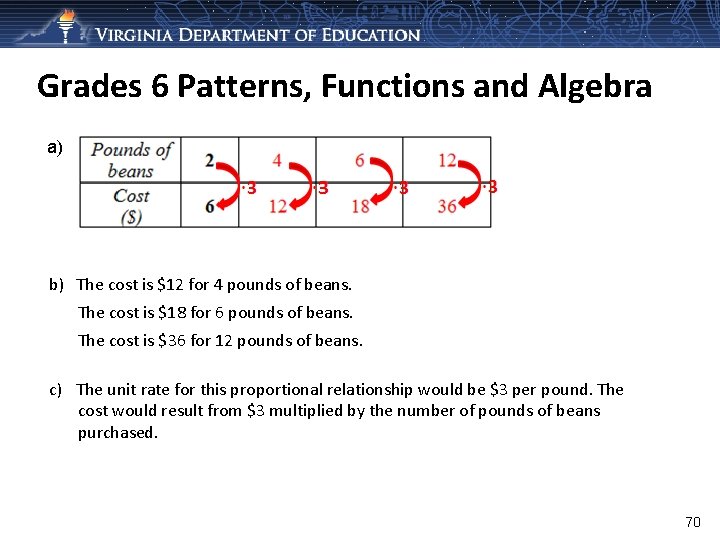
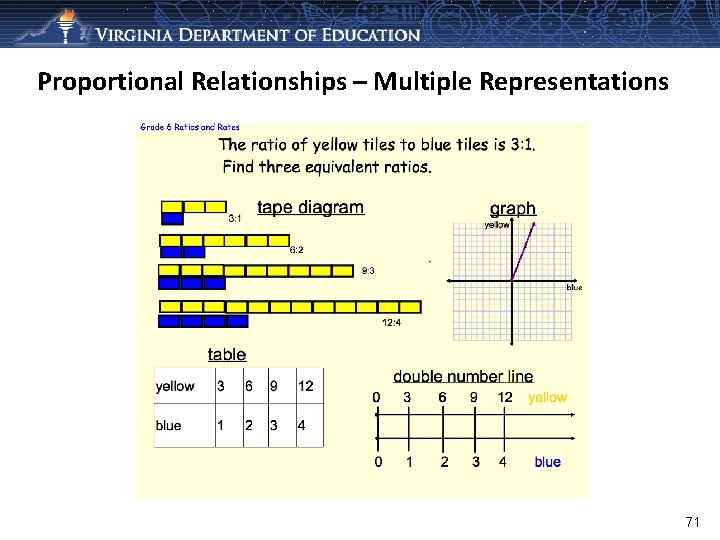
Grades 6 Patterns, Functions and Algebra At a whole foods store, it costs $6 for every two pounds of pinto beans. a) Create a ratio table that includes three additional equivalent ratios that represent this situation. b) Use a verbal description to describe each equivalent ratio. c) Find the unit rate (cost per pound) of pinto beans. 69
Grades 6 Patterns, Functions and Algebra a) b) The cost is $12 for 4 pounds of beans. The cost is $18 for 6 pounds of beans. The cost is $36 for 12 pounds of beans. c) The unit rate for this proportional relationship would be $3 per pound. The cost would result from $3 multiplied by the number of pounds of beans purchased. 70
Proportional Relationships – Multiple Representations 71
72
Grade 7 Patterns, Functions and Algebra SOL 7. 10 The student will a) determine the slope, m, as rate of change in a proportional relationship between two quantities and write an equation in the form y = mx to represent the relationship; b) Graph a line representing a proportional relationship between two quantities given the slope and an ordered pair, or given the equation in y = mx form, where m represents the slope as rate of change; c) determine the y-intercept, b, in an additive relationship between two quantities and write an equation in the form y = x + b to represent the relationship; d) Graph a line representing an additive relationship between two quantities given the y-intercept and an ordered pair, or given the equation in the form y = x + b, where b represents the y-intercept; and e) Make connections between and among representations of a proportional or additive relationship between two quantities using verbal descriptions, tables, equations, or graphs. 73
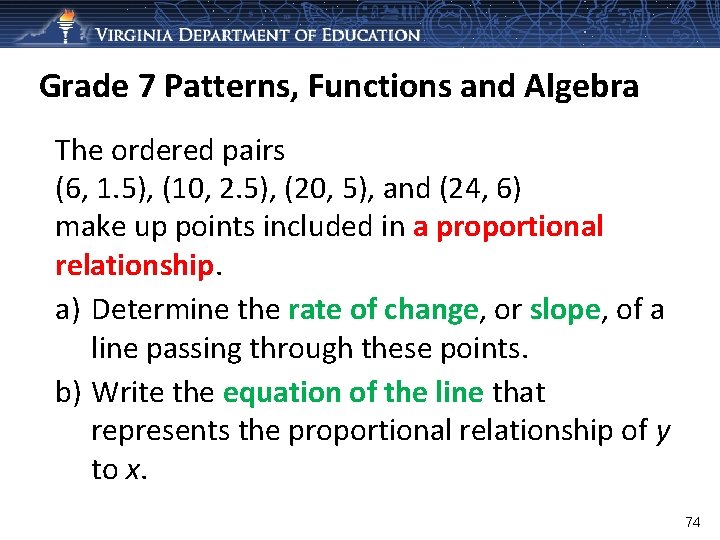
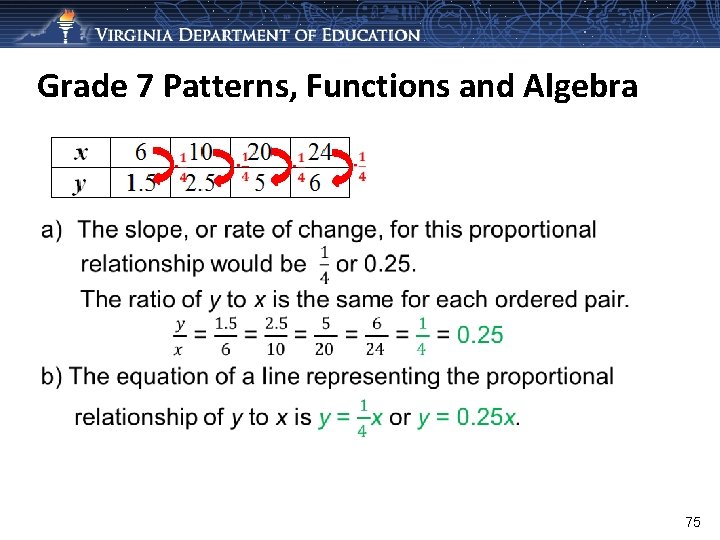
Grade 7 Patterns, Functions and Algebra The ordered pairs (6, 1. 5), (10, 2. 5), (20, 5), and (24, 6) make up points included in a proportional relationship. a) Determine the rate of change, or slope, of a line passing through these points. b) Write the equation of the line that represents the proportional relationship of y to x. 74
Grade 7 Patterns, Functions and Algebra 75
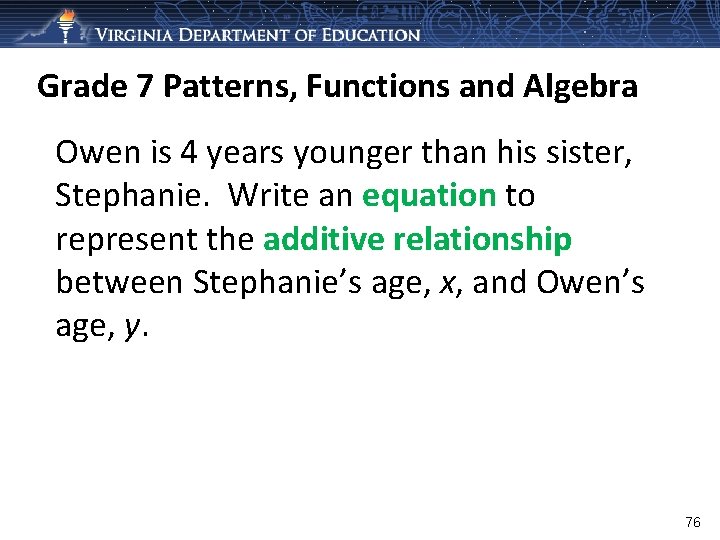
Grade 7 Patterns, Functions and Algebra Owen is 4 years younger than his sister, Stephanie. Write an equation to represent the additive relationship between Stephanie’s age, x, and Owen’s age, y. 76
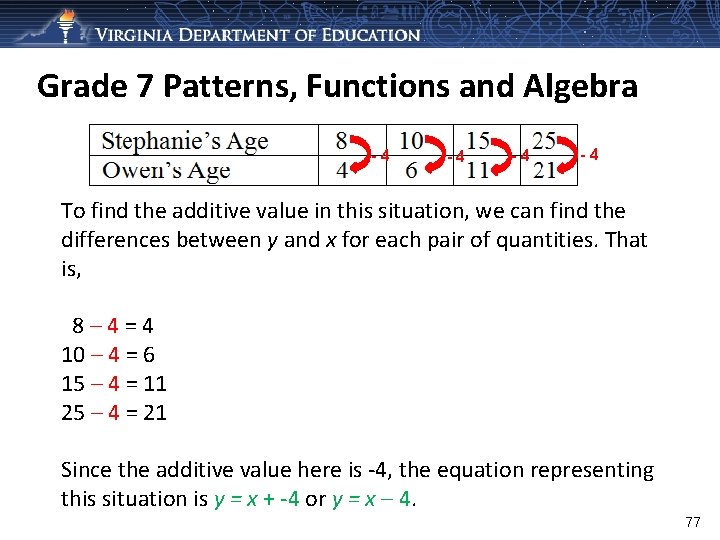
Grade 7 Patterns, Functions and Algebra -4 -4 To find the additive value in this situation, we can find the differences between y and x for each pair of quantities. That is, 8 – 4 = 4 10 – 4 = 6 15 – 4 = 11 25 – 4 = 21 Since the additive value here is -4, the equation representing this situation is y = x + -4 or y = x – 4. 77
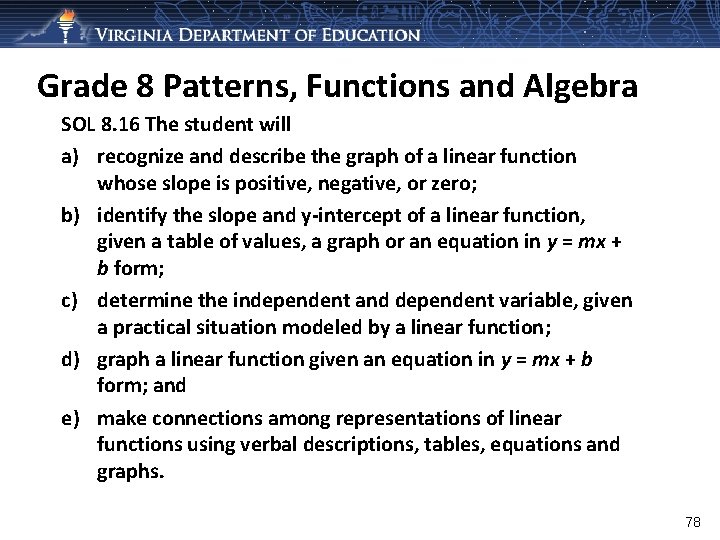
Grade 8 Patterns, Functions and Algebra SOL 8. 16 The student will a) recognize and describe the graph of a linear function whose slope is positive, negative, or zero; b) identify the slope and y-intercept of a linear function, given a table of values, a graph or an equation in y = mx + b form; c) determine the independent and dependent variable, given a practical situation modeled by a linear function; d) graph a linear function given an equation in y = mx + b form; and e) make connections among representations of linear functions using verbal descriptions, tables, equations and graphs. 78
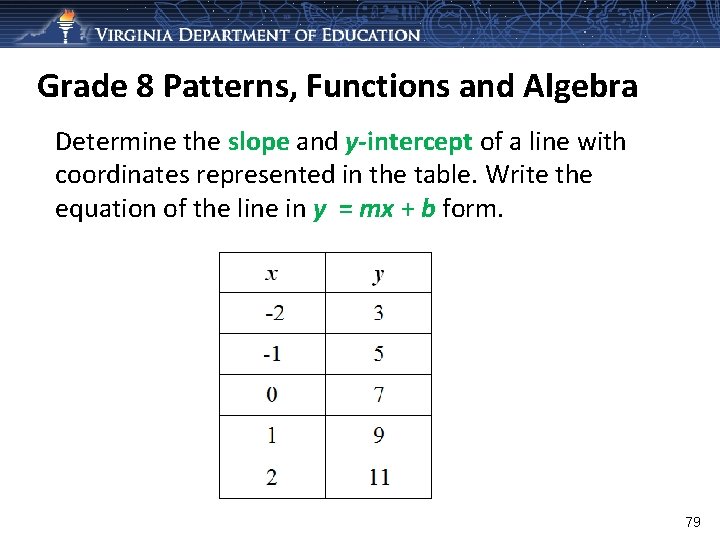
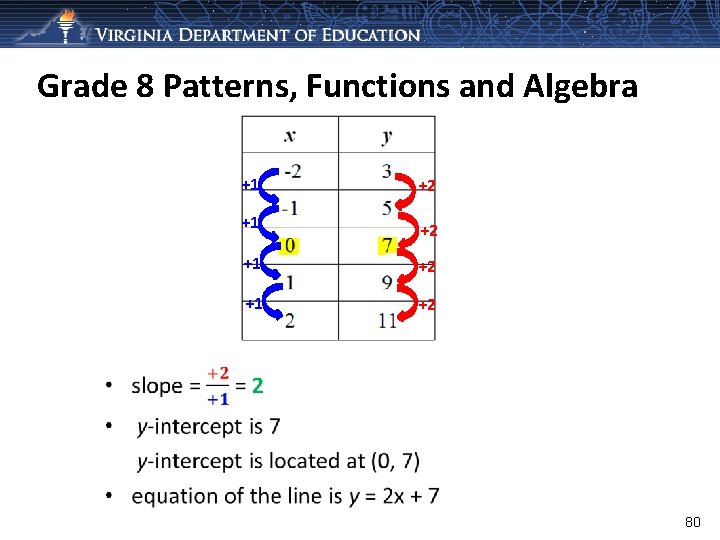
Grade 8 Patterns, Functions and Algebra Determine the slope and y-intercept of a line with coordinates represented in the table. Write the equation of the line in y = mx + b form. 79
Grade 8 Patterns, Functions and Algebra +1 +2 80
Grade 6 Revision Highlights • • • Operations with integers and practical problems Lines of symmetry for regular polygons Impact on measures of center when value is added, removed, or changed Represent proportional relationships; unit rates; ratio tables; determine if a proportional relationship exists; and make connections between and among representations Practical problems with one-step equations Represent practical situations with inequalities; solve one-step inequalities using addition/subtraction and graph on a number line Ballpark comparisons moved to Grade 7 (Computation and Estimation) Volume and surface area of a rectangular prism included in Grade 7 Properties of quadrilaterals included in Grade 7 Probability moved to Grade 8 Arithmetic and geometric sequences removed
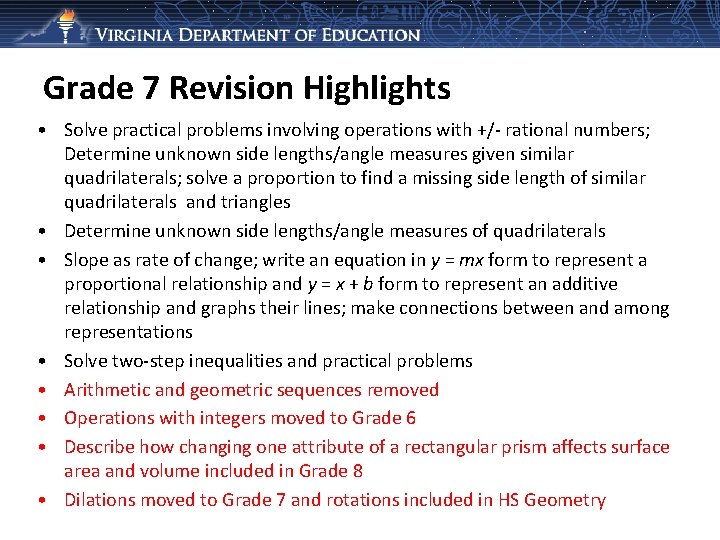
Grade 7 Revision Highlights • Solve practical problems involving operations with +/- rational numbers; Determine unknown side lengths/angle measures given similar quadrilaterals; solve a proportion to find a missing side length of similar quadrilaterals and triangles • Determine unknown side lengths/angle measures of quadrilaterals • Slope as rate of change; write an equation in y = mx form to represent a proportional relationship and y = x + b form to represent an additive relationship and graphs their lines; make connections between and among representations • Solve two-step inequalities and practical problems • Arithmetic and geometric sequences removed • Operations with integers moved to Grade 6 • Describe how changing one attribute of a rectangular prism affects surface area and volume included in Grade 8 • Dilations moved to Grade 7 and rotations included in HS Geometry
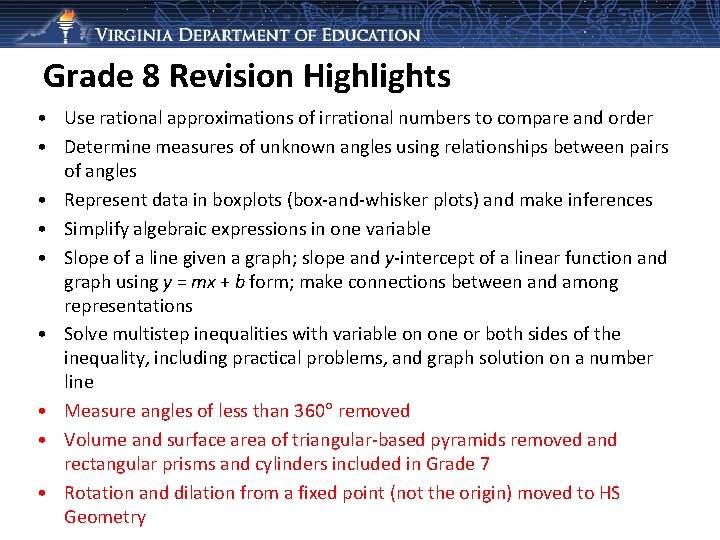
Grade 8 Revision Highlights • Use rational approximations of irrational numbers to compare and order • Determine measures of unknown angles using relationships between pairs of angles • Represent data in boxplots (box-and-whisker plots) and make inferences • Simplify algebraic expressions in one variable • Slope of a line given a graph; slope and y-intercept of a linear function and graph using y = mx + b form; make connections between and among representations • Solve multistep inequalities with variable on one or both sides of the inequality, including practical problems, and graph solution on a number line • Measure angles of less than 360 removed • Volume and surface area of triangular-based pyramids removed and rectangular prisms and cylinders included in Grade 7 • Rotation and dilation from a fixed point (not the origin) moved to HS Geometry
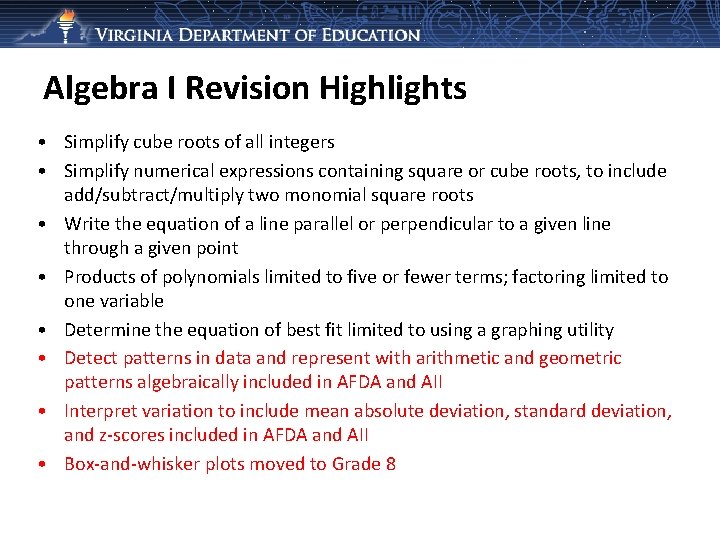
Algebra I Revision Highlights • Simplify cube roots of all integers • Simplify numerical expressions containing square or cube roots, to include add/subtract/multiply two monomial square roots • Write the equation of a line parallel or perpendicular to a given line through a given point • Products of polynomials limited to five or fewer terms; factoring limited to one variable • Determine the equation of best fit limited to using a graphing utility • Detect patterns in data and represent with arithmetic and geometric patterns algebraically included in AFDA and AII • Interpret variation to include mean absolute deviation, standard deviation, and z-scores included in AFDA and AII • Box-and-whisker plots moved to Grade 8
Implementation of the 2016 Standards 85
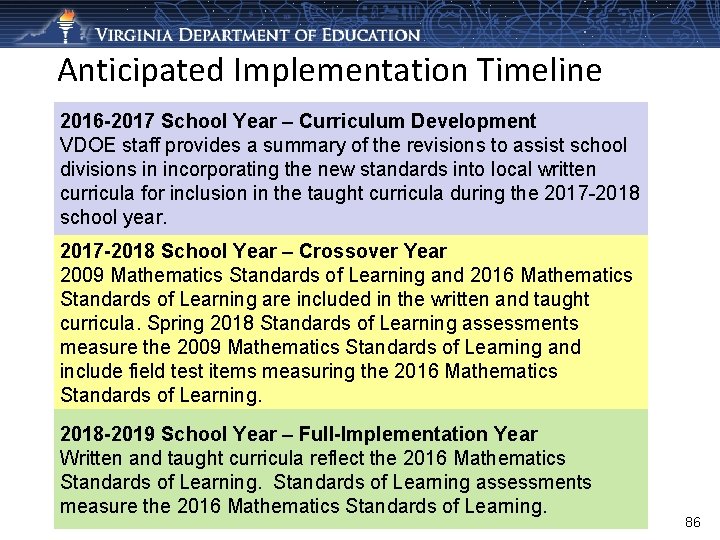
Anticipated Implementation Timeline 2016 -2017 School Year – Curriculum Development VDOE staff provides a summary of the revisions to assist school divisions in incorporating the new standards into local written curricula for inclusion in the taught curricula during the 2017 -2018 school year. 2017 -2018 School Year – Crossover Year 2009 Mathematics Standards of Learning and 2016 Mathematics Standards of Learning are included in the written and taught curricula. Spring 2018 Standards of Learning assessments measure the 2009 Mathematics Standards of Learning and include field test items measuring the 2016 Mathematics Standards of Learning. 2018 -2019 School Year – Full-Implementation Year Written and taught curricula reflect the 2016 Mathematics Standards of Learning assessments measure the 2016 Mathematics Standards of Learning. 86
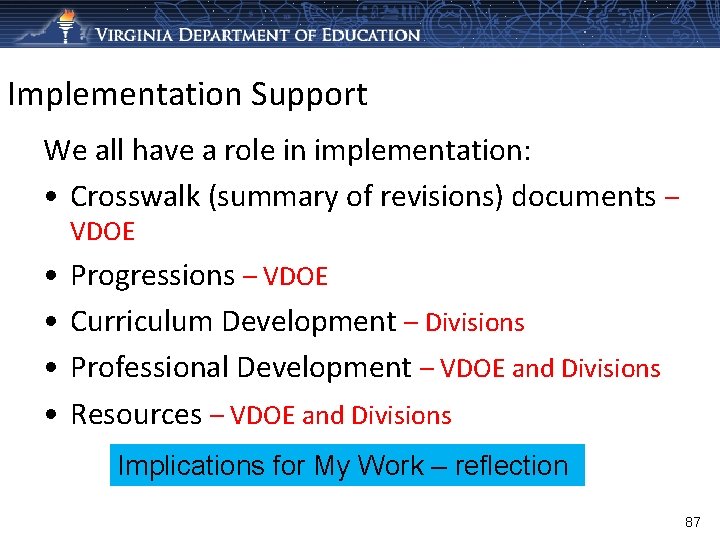
Implementation Support We all have a role in implementation: • Crosswalk (summary of revisions) documents – VDOE • • Progressions – VDOE Curriculum Development – Divisions Professional Development – VDOE and Divisions Resources – VDOE and Divisions Implications for My Work – reflection 87
Please contact us! Debra. Delozier@doe. virginia. gov Tina. Mazzacane@doe. virginia. gov Christa. Southall@doe. virginia. gov 88