Variations of cosmic ray muon flux during thunderstorms


 ΔX 0 = ΔY 0 =0. 7 m 3")


 PRL 122, 105101 (2019) “This work possibly provides the first direct evidence")
 and July 18, 2008")


: where is vertical profile of the Lorentz")


- Slides: 30
Variations of cosmic ray muon flux during thunderstorms as a tool for studying electric field distribution and particle production processes in the atmosphere A. S. Lidvansky, N. S. Khaerdinov, M. N. Khaerdinov Institute for Nuclear Research, Russian Academy of Sciences
The BASA: Scheme and view
The Carpet array (400 detectors) ΔX 0 = ΔY 0 =0. 7 m 3
Amplitude spectrum from a layer of scintillators Two thresholds are used to separate soft and hard components: Soft component is detected by huts between low (Al) and upper (Ah) thresholds. Electrons – 20%, positrons – 10%, -rays – 50%, admixture of muons is less than 20%. Hard component is measured by Carpet detectors (under concrete roof 29 g/cm 2) above upper threshold (muons 90%)
Universal instrument for measuring the near-ground field of the atmosphere and precipitation electric current Measurements of electrostatic and slowly variable field in the range from -40 k. V/m up to +40 k. V/m with an accuracy of ~ 10 V/m. Precipitation electric current is measured in the range from -50 n. A/m 2 up to +50 n. A/m 2 with an accuracy of ~ 10 p. A/m 2. The instrument allows one to measure not only thunderstorm field but also the background (fair weather) electric field by a single method.
Variations of the CR soft and hard componrents with near-ground electric field during thunderstorms Electrons, positrons, and gammas 10 -30 Me. V Muons > 100 Me. V
Muons with E > 100 Мэ. В, deviation from the mean intensity as a function of near-ground electric field strength (weighted average curve, summation over separate thunderstorms) Solid circles correspond to distribution after exclusion of ± 300 -second periods of active thunderstorm phase. Variations with large dispersion have no effect on the regular variation with the near-ground field.
Event on October 11, 2003 before correction for noise and homogeneity
Record enhancement during thunderstorm on October 11, 2003 Estimates of minimal distance to two lightning strokes exerting strong effect on the intensity are 4. 4 and 3. 1 km. Other lightning discharges, including very near, give no such an effect.
Two strong variations of muons on one day of a year separated by seven years: September 24, 2000 and 2007. In the latter event sharp variations associated with lightning discharges are observed Near ground field Soft component (e , e+, ) 10 -30 Me. V Hard component (muons > 100 Me. V) Precipitation electric current
(GRAPES-3 Collaboration) PRL 122, 105101 (2019) “This work possibly provides the first direct evidence for the generation of gigavolt potentials in thunderclouds that could also possibly explain the production of highest-energy (100 Me. V) gamma rays in the terrestrial gamma-ray flashes. ”
Events on June 18, 2008 (left, averaged over 15 s) and July 18, 2008 (right, averaged over 30 s)
A model of particle generation in thunderclouds. Secondary CR are seed particles and the electric field is a reservoir of energy Under stable conditions and at sufficient strength (D) and extension (from x 0 to x 1) of the field the intensity of particles increases exponentially (K is the probability of one cycle, and is its duration):
Admissible regions for runaway and feedback particles
Kinetic equation for muon intensity (one-dimensional problem): where is vertical profile of the Lorentz force normalized to air density
Intensity of muons during thunderstorms J 0μ is the spectrum without field, R is the mean atmospheric field under the local charge, and R is its dispersion, and is the potential difference between the ground level and muon production level.
Potential difference Ф between the muon production level (11. 4 km a. s. l. ) and the observation level (1. 7 km a. s. l. ) and amplitude of count rate disturbance (%) of 100 Me. V muons as a function of cloud boundary zenith angle θ. Percent isolines are shown in the figure.
The field of view of the remote video camera and atmospheric regions under analysis
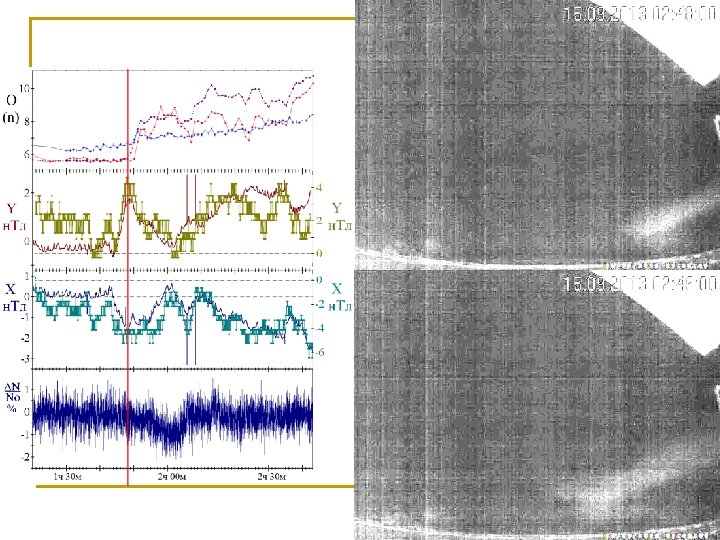
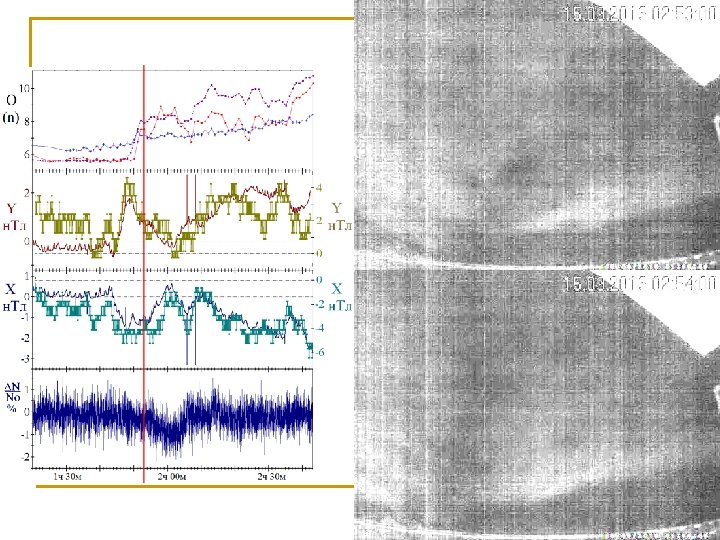
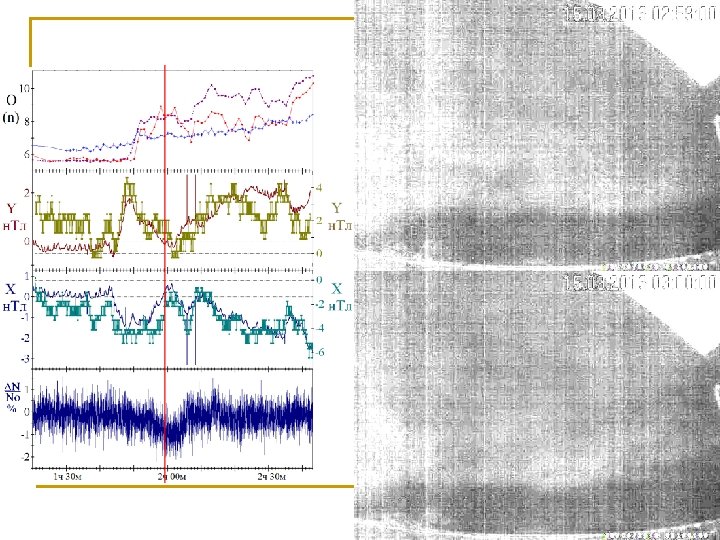
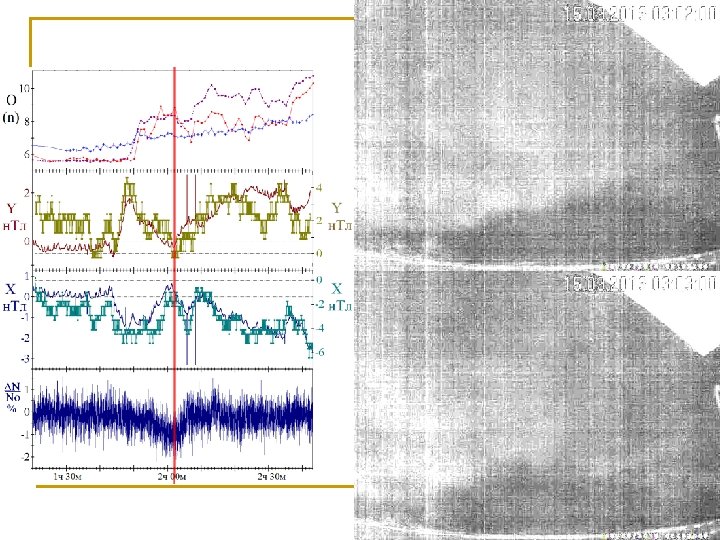
Three snapshots of the sky at a sharp disturbance of the muon flux during thunderstorm on September 15, 2013
Thunderstorm event on September 15, 2013. Interval of averaging is 15 s in all cases except for two upper panels. From top to bottom: 1. lightning indicator (arbitrary units proportional to amplitude of electromagnetic noise from lightning discharges), 2. mean brightness of different sky areas on distant camera images (red colour for ionosphere, violet for stratosphere, and blue for troposphere), 3. pressure, 4. variations of the soft component, 5. variations of the hard component, 6. precipitation electric current. Units of optical data in the second panel 10 -7 lx (data are presented with one-minute intervals averaged over four adjacent frames).
Thunderstorm event on September 15, 2013. Moments characterizing the dynamics of glow evolution in the atmosphere. Brightness is amplified by a factor of 25.
Field strength versus field extension for particle generation process with different rise time. Fundamental limit on electrostatic field in air calculated by J. R. Dwyer. Monte Carlo simulation (Geophys. Res. Lett. , 30, 2055 (2003)) at a pressure of 1 atm.
Examples of propagation of a runaway electron with initial energy of 70 Me. V in strong electric fields (3. 2 and 4 k. V per cm)
Conclusions n n Disturbances in intensity of CR muons during thunderstorms are directly connected with electric field potential difference in the stratosphere This difference was estimated to exceed the critical field for cyclic generation of particle so that hypothesis about existence of a new type of high-altitude discharge arose Attempts to find the glow associated with this discharge resulted in finding it more intense and durable than expected Analysis of thunderstorm disturbances of muon intensity with large-area muon detectors can be very useful tool for geophysical studies, but precise calibration is a problem that should be solved