Variations in Economic Structure Gross National Income PI

 GDP = Final Sales to Government, Consumers &")
")
")
")


- Slides: 19
Variations in Economic Structure Gross National Income PI PI PI
Distribution of Gross Domestic Product (%) GDP = Final Sales to Government, Consumers & Investment Note: 2003 Exports includes services
Imports/Exports 2002 -2003 ($ billions)
Structure of Merchandise Exports (%)
Structure of Merchandise Imports (%)
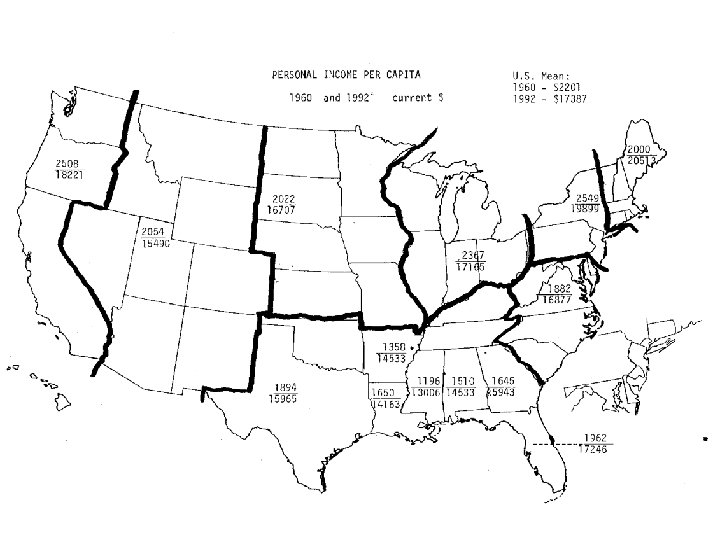
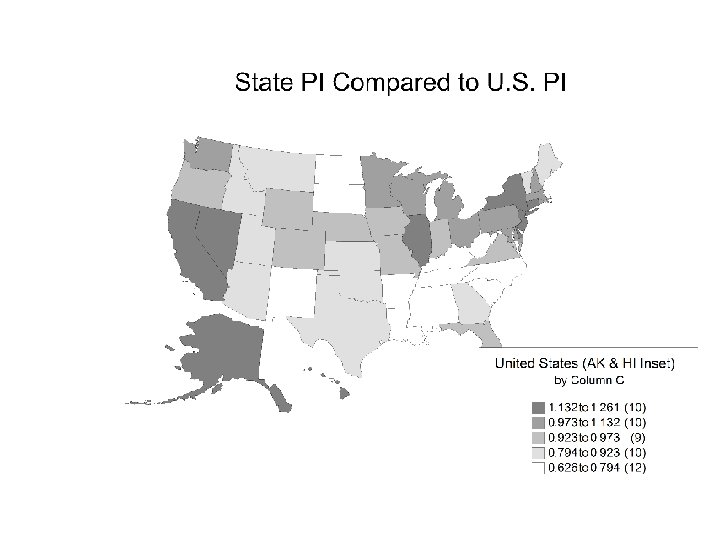
Index of Personal Income by State Relative to U. S.
Labor Market Adjustment Model North D S South S D D S QSouth S D QNorth
Changing Composition of Employment in the U. S.
Development of the U. S. Service Sector
Decomposition of Services
Development: The Circular Model of Capital Flow Stock of Productive Capacity Industrial Output Investment • Interest rates • Tax policy & public investment Final Consumer Demand “Savings” Business Income (Value Added) Payments to Households “Savings” - retained earnings, household savings, institutional investors, international capital sources
Vance’s Exogenic And Endogenic Model
Impact of Scale Economies on Market Division B Market Division A Market Division P P P a a I II distance t t P t a a I II
Impact of Transport C Improvement Market Division P P I II
Process of Regional Specialization Region A Region B Initial Condition: No Interregional Trade Local Production Equals Location Consumption
Process of Regional Specialization, Continued Exports to A Exports To B Region A Imports from B Region B Imports from A
Process of Regional Specialization, Continued Interregional Exports Production for Local Use Interregional Imports Production for Local Use