Variable nodes Factor nodes From Kschischang Frey Loeliger


Variable nodes Factor nodes From Kschischang, Frey, Loeliger 2001


Markowetz et al, 2007


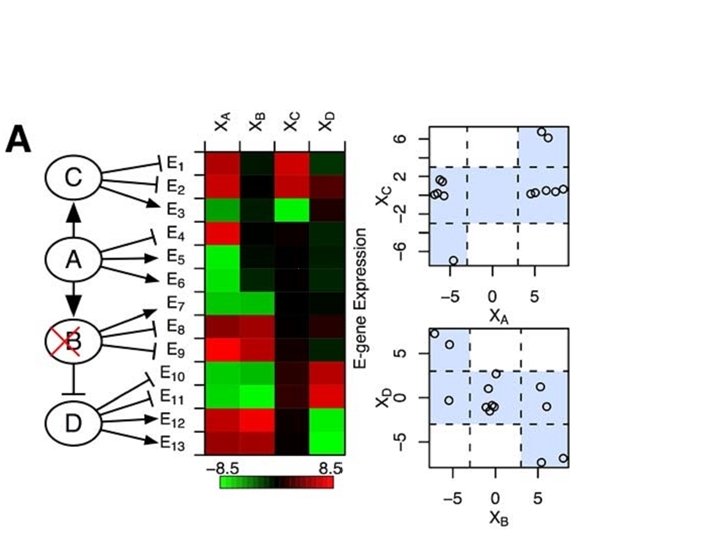

Interaction mode Consistent with expectation Expected trend in E-genes for specific interaction modes Inconsistent with expectation

Independence over all E-genes Re-arranging the terms
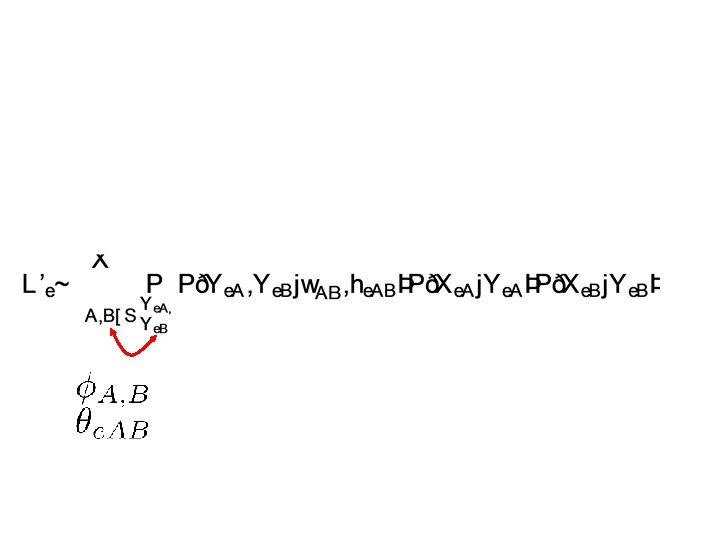

Each of these conditional distributions will correspond to a factor

Modeled as Gaussian distributions Four values for each possible type of interaction: inhibitory, activating, equivalent no interaction
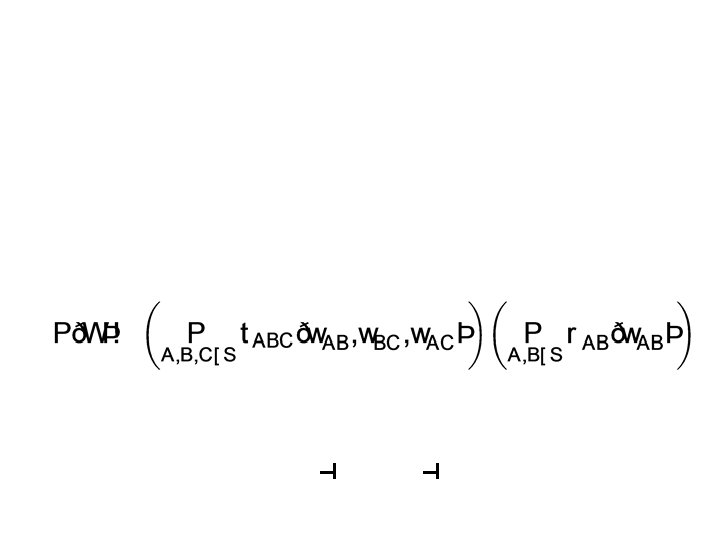

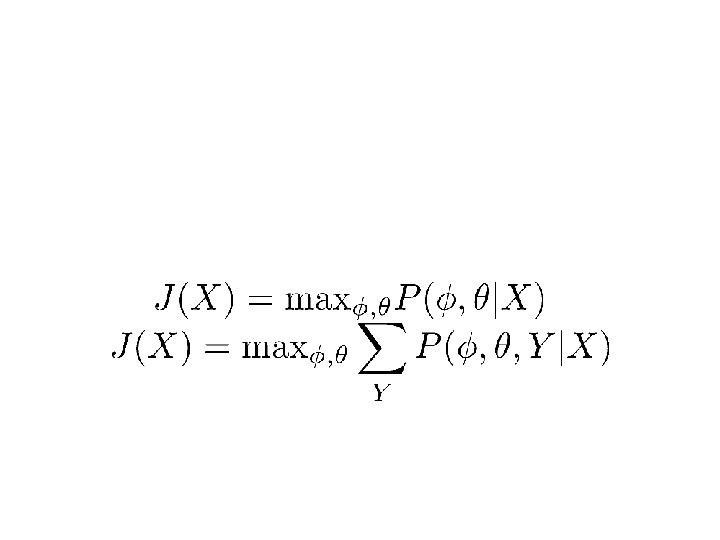
Prior

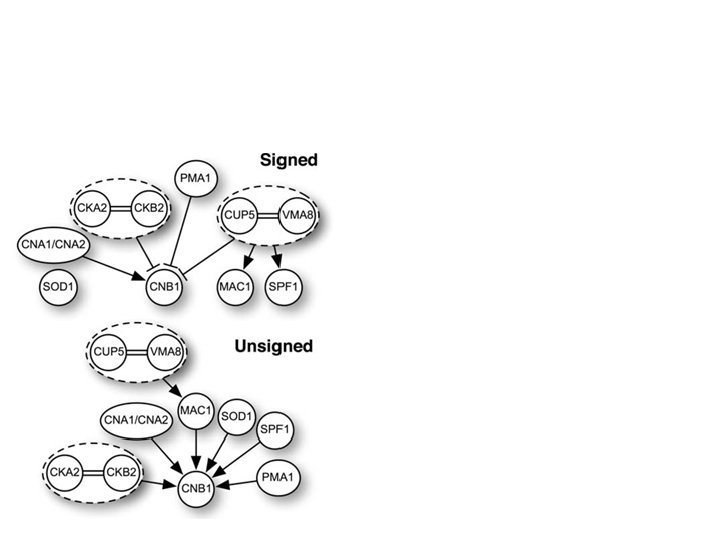
FG-NEM: capture inhibitory and activating relationships u. FG-NEM: capture only unsigned interactions FG-NEM AVT: FG-NEM run on absolute value data Solid lines: structure recovery Dashed lines: sign recovery

One of the S genes

Template matching: rank E genes based on similarity in expression to an “idealized template”

Most interactions in S-gene network are activating Novel expanded genes that have significant effect on the invasive phenotype


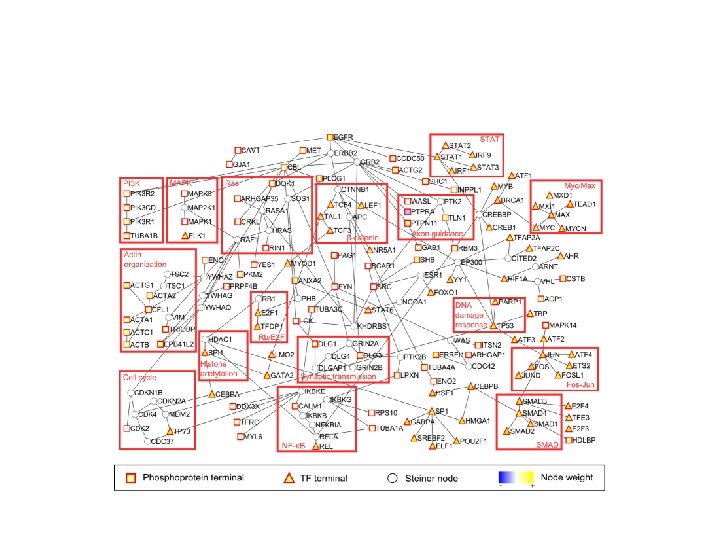
Image credit: TCGA, Gligorevic et al. , Proteomics 2015

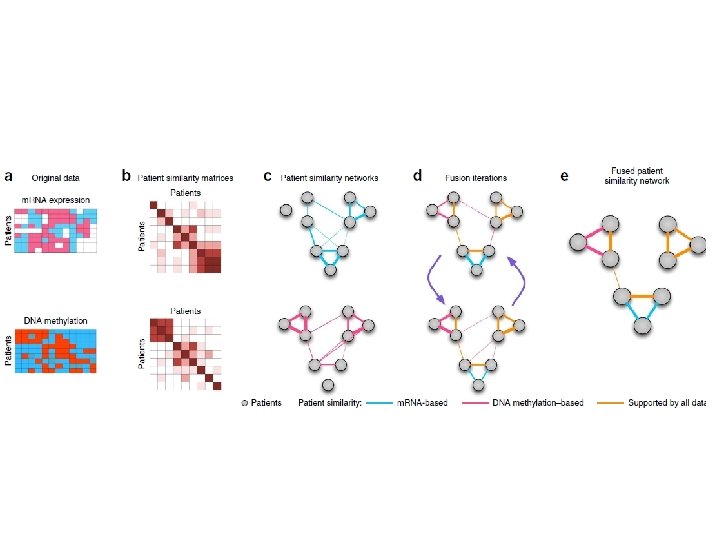
Image Credit: Dvir Aran, Ph. D. , University of California, San Francisco


Source nodes Sink nodes


Capacity constraint Conservation of flow
 15(20) 4(9) 7 10 4 13 12(12) (10)")
12 16 20 9 4 11(16) 15(20) 4(9) 7 10 4 13 12(12) (10) 1(4) 14 7(7) 8(13) 4(4) 11(14) Flow network G A flow of 19 on G Only positive flows are shown


A B E E F C C S={A, B, C} D S={A, B, C, D}

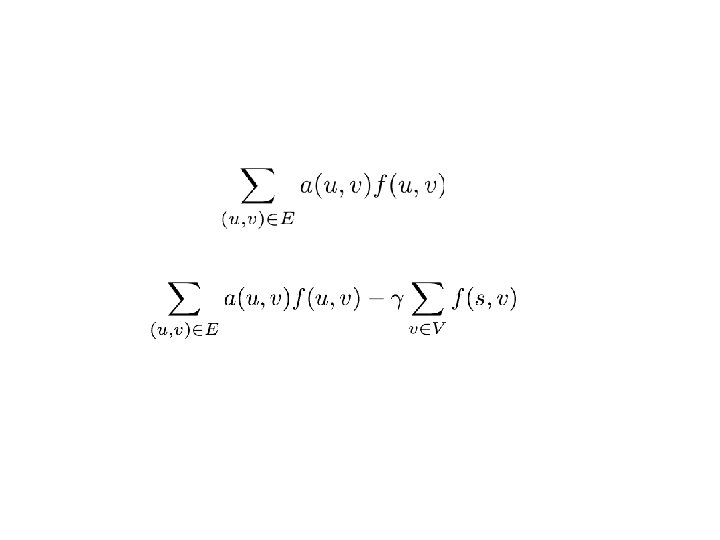
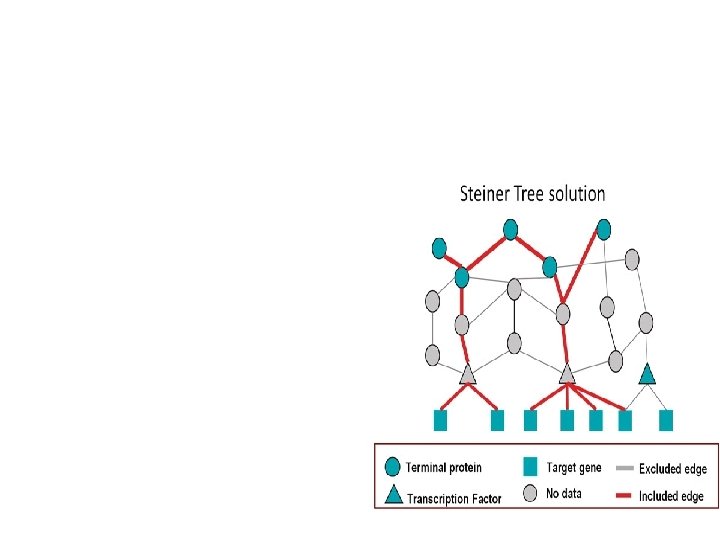
Trade-off between cost and prize

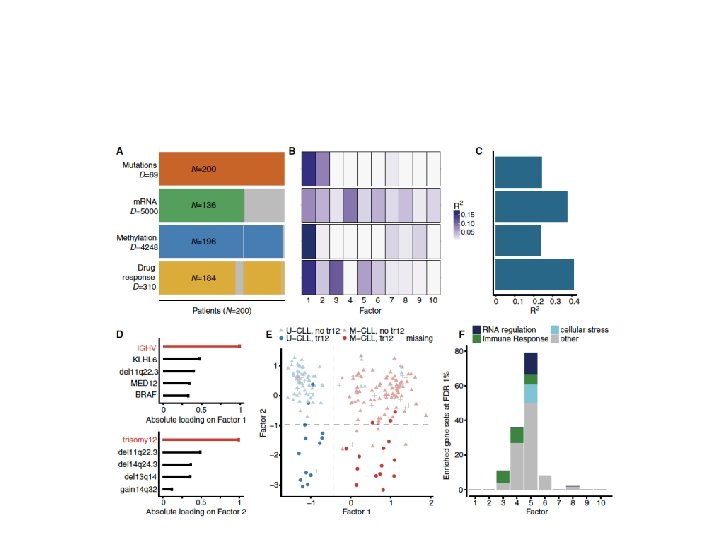
 Allows for missing partially overlapping datasets, (2) Based on a probabilistic model, (3)")
(1) Allows for missing partially overlapping datasets, (2) Based on a probabilistic model, (3) Learns sparse factors Ricard Argelaguet et al, MSB 2019

Gligorijevic´ V, Przˇulj N. 2015 Methods for biological data integration: perspectives and challenges. J. R. Soc. Interface 12: 20150571


- Slides: 55