
Variability Statistical Process Control 1 Outline Section 1
Variability & Statistical Process Control 1
Outline Section 1: Understanding the Impact of Variation Section 2: Process Control Systems Section 3: Measurement Capability Analysis 2
What is Variation? Loss Function What is the target for a given process? ? ? Target How far away from the target is still OK? 3
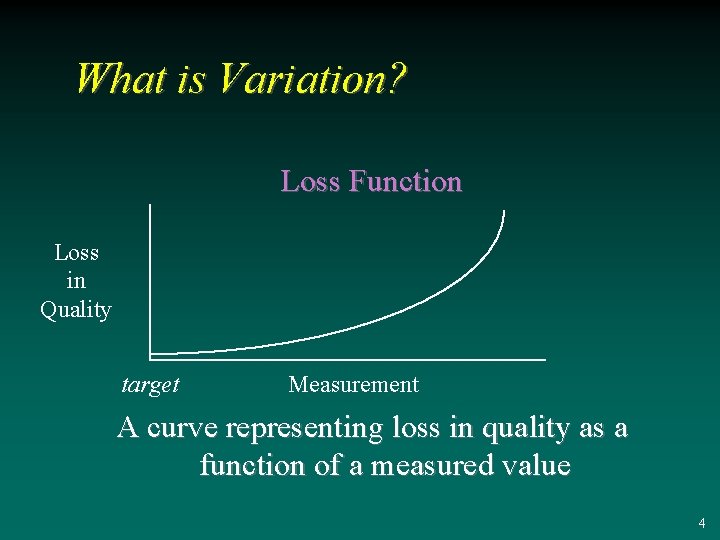
What is Variation? Loss Function Loss in Quality target Measurement A curve representing loss in quality as a function of a measured value 4
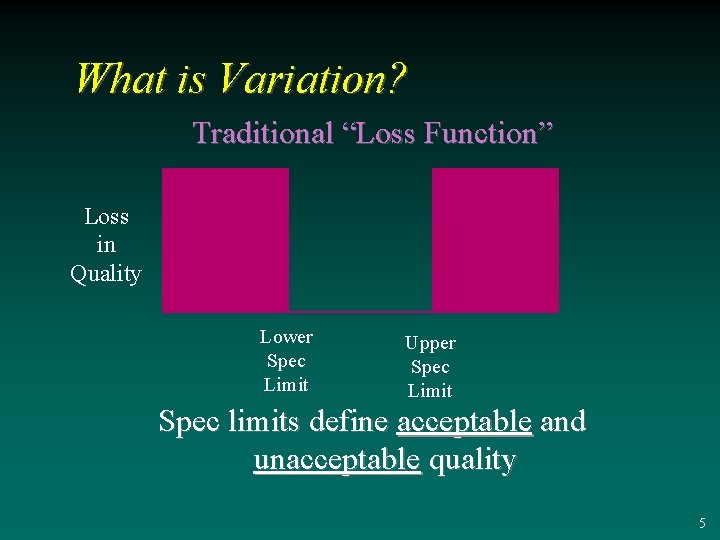
What is Variation? Traditional “Loss Function” Loss in Quality Lower Spec Limit Upper Spec Limit Spec limits define acceptable and unacceptable quality 5

What is Variation? Modern “Loss Function” Loss in Quality Increases as Variation from Target Increases Target: Desired Value or Outcome 6
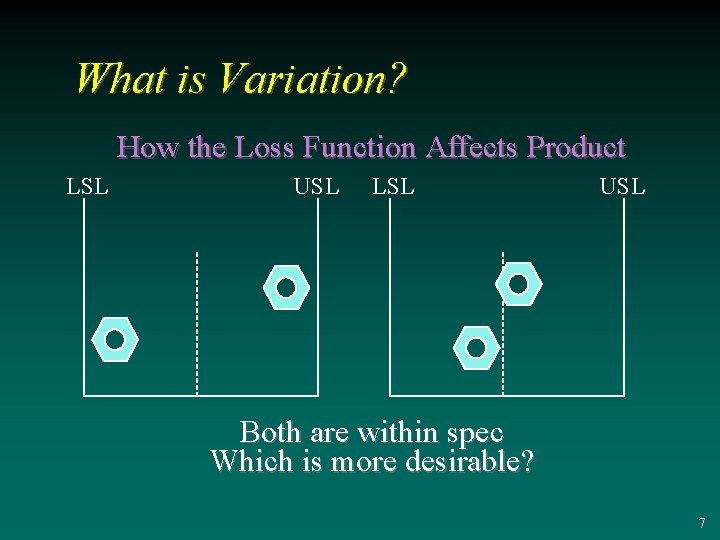
What is Variation? How the Loss Function Affects Product LSL USL Both are within spec Which is more desirable? 7
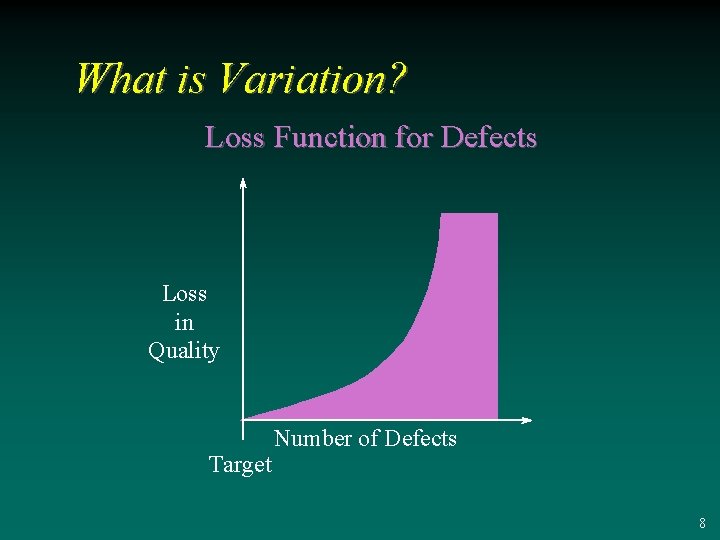
What is Variation? Loss Function for Defects Loss in Quality Target Number of Defects 8
What is Variation? Less Variation = Higher Quality 9
Examining Variation Definition A Stable Process has the same normal distribution at all times. A stable process is In Control A stable process still has variation 10
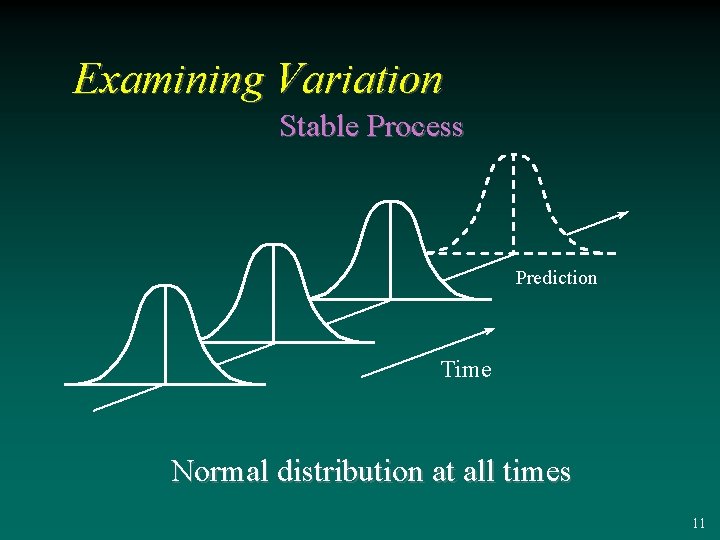
Examining Variation Stable Process Prediction Time Normal distribution at all times 11
Examining Variation Common Causes The cause of variations in a stable process is called a Common Cause. A common cause is a natural cause of variation in the system. 12
Examining Variation Common Cause Examples 3 3 Machine vibration Temperature fluctuations Slight variation in raw materials Human variation in setting control dials 13
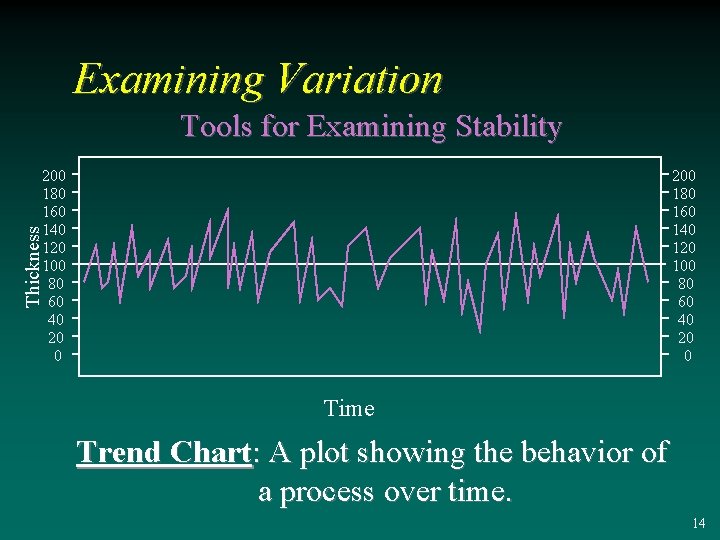
Examining Variation Tools for Examining Stability 200 180 160 140 120 100 80 60 40 20 0 Thickness 200 180 160 140 120 100 80 60 40 20 0 Time Trend Chart: A plot showing the behavior of a process over time. 14
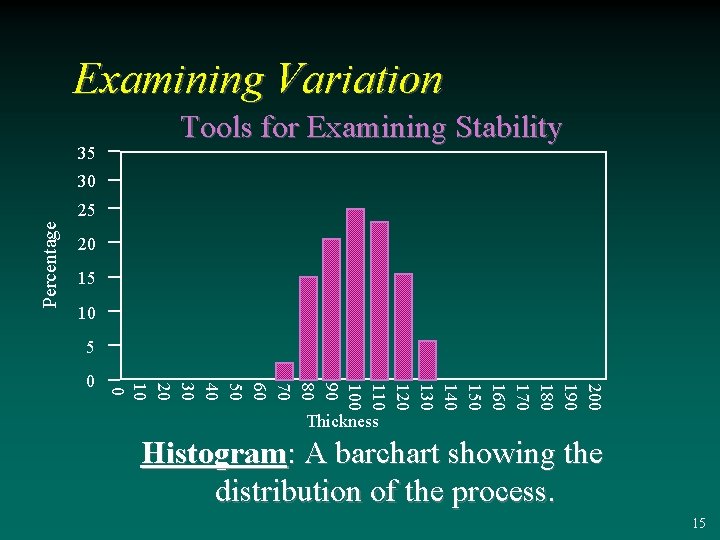
Examining Variation 35 Tools for Examining Stability 30 Percentage 25 20 15 10 5 200 190 180 170 160 150 140 130 120 110 100 90 80 70 60 50 40 30 20 10 0 0 Thickness Histogram: A barchart showing the distribution of the process. 15
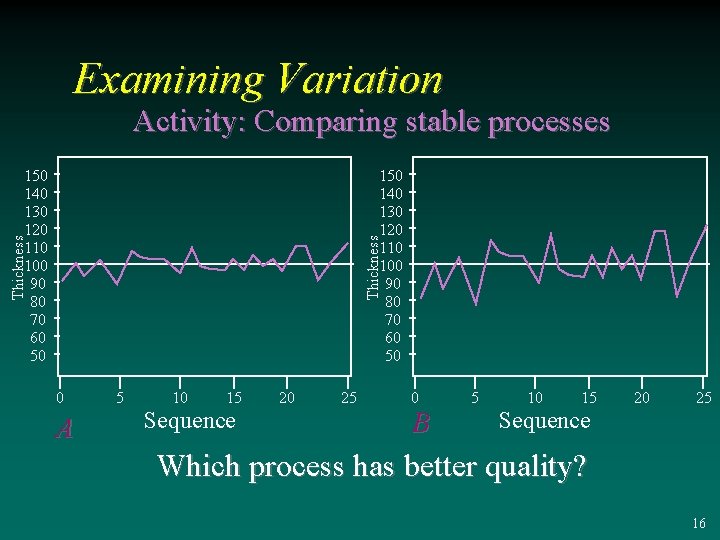
Examining Variation Activity: Comparing stable processes Thickness 150 140 130 120 110 100 90 80 70 60 50 0 A 5 10 15 Sequence 20 25 0 B 5 10 15 Sequence 20 25 Which process has better quality? 16
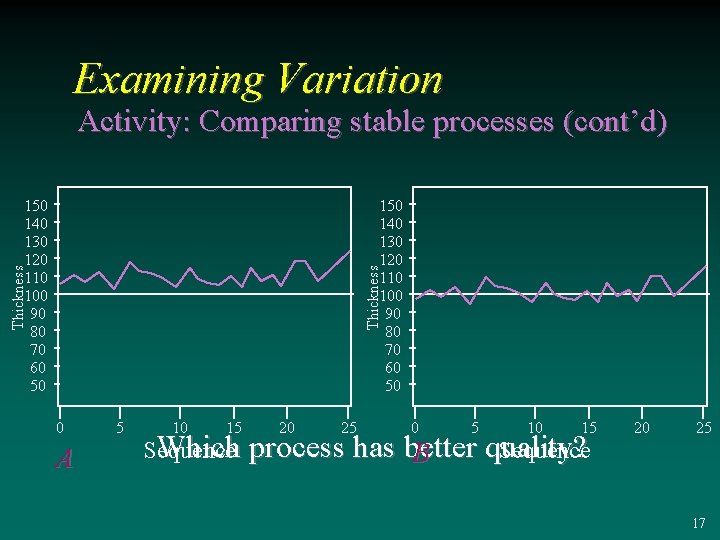
Examining Variation Activity: Comparing stable processes (cont’d) Thickness 150 140 130 120 110 100 90 80 70 60 50 0 A 5 10 15 20 25 0 5 10 15 Which process has better quality? Sequence B 20 25 17
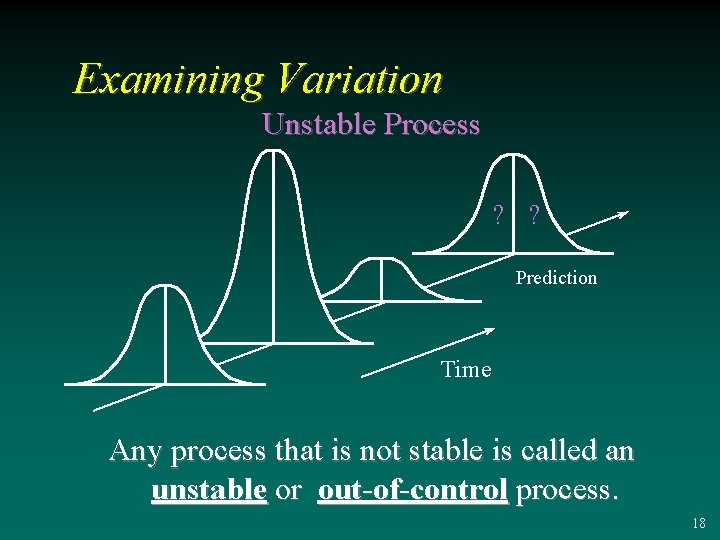
Examining Variation Unstable Process ? ? Prediction Time Any process that is not stable is called an unstable or out-of-control process. 18
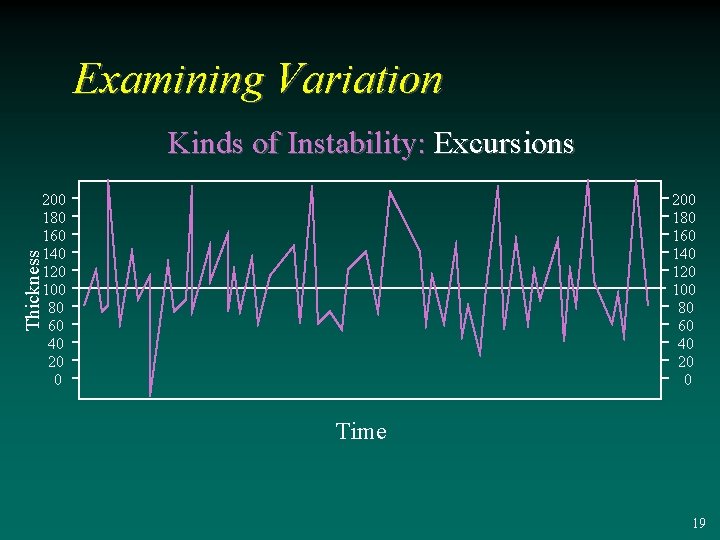
Examining Variation Kinds of Instability: Excursions 200 180 160 140 120 100 80 60 40 20 0 Thickness 200 180 160 140 120 100 80 60 40 20 0 Time 19
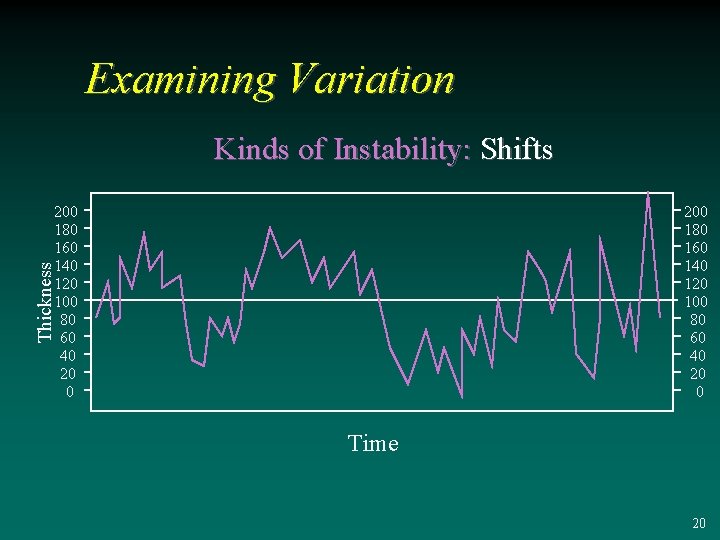
Examining Variation Kinds of Instability: Shifts 200 180 160 140 120 100 80 60 40 20 0 Thickness 200 180 160 140 120 100 80 60 40 20 0 Time 20
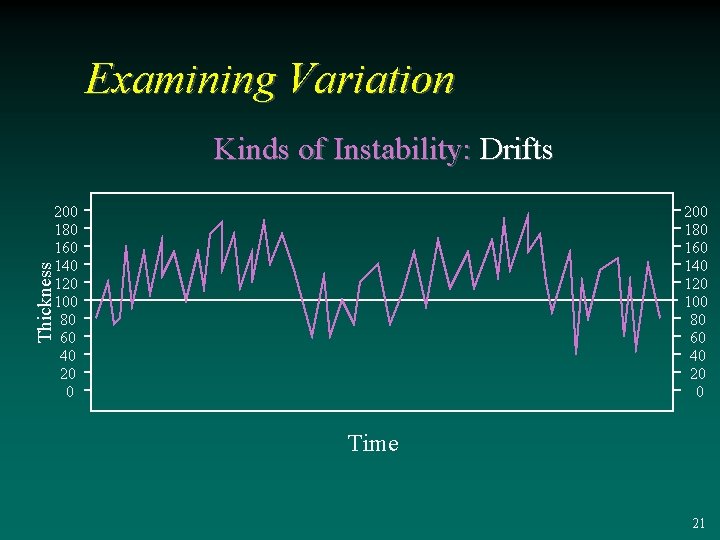
Examining Variation Kinds of Instability: Drifts 200 180 160 140 120 100 80 60 40 20 0 Thickness 200 180 160 140 120 100 80 60 40 20 0 Time 21
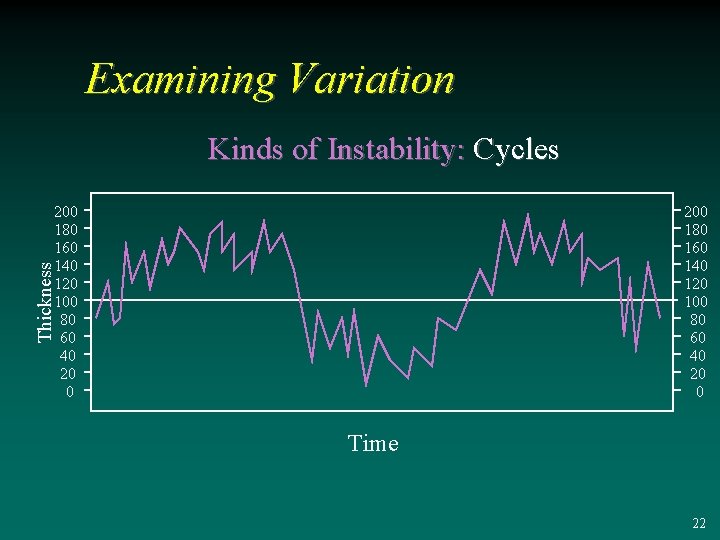
Examining Variation Kinds of Instability: Cycles 200 180 160 140 120 100 80 60 40 20 0 Thickness 200 180 160 140 120 100 80 60 40 20 0 Time 22
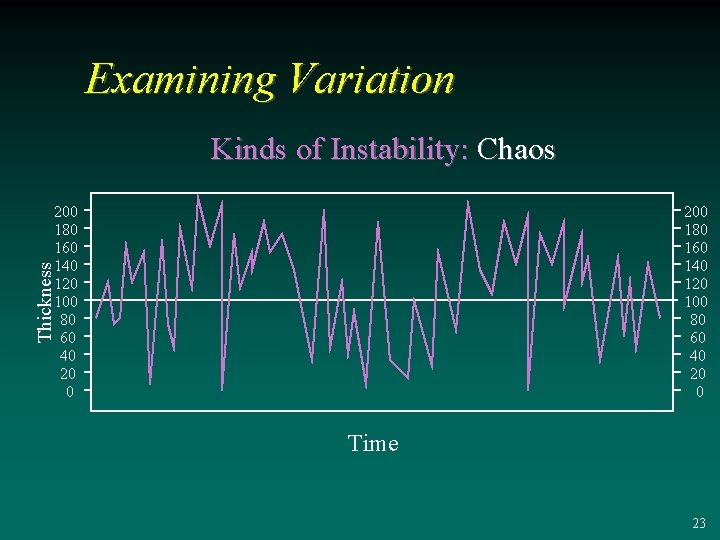
Examining Variation Kinds of Instability: Chaos 200 180 160 140 120 100 80 60 40 20 0 Thickness 200 180 160 140 120 100 80 60 40 20 0 Time 23
Examining Variation Special Causes Anything that causes variations that are not part of the stable process is called a special cause, assignable cause, or unnatural cause. 24
Examining Variation Examples of Special Causes 3 3 3 Batch of defective raw material Faulty set-up Human error Incorrect recipe Blown gasket Earthquake 25
Reducing Variation Improving a Stable Process Two strategies for improving a stable process 3 Centering at Target 3 Reducing Common Cause Variation 26
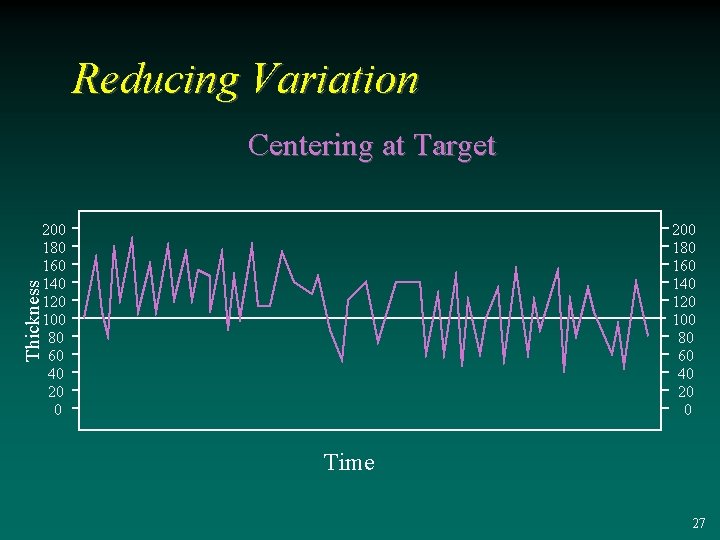
Reducing Variation Centering at Target 200 180 160 140 120 100 80 60 40 20 0 Thickness 200 180 160 140 120 100 80 60 40 20 0 Time 27
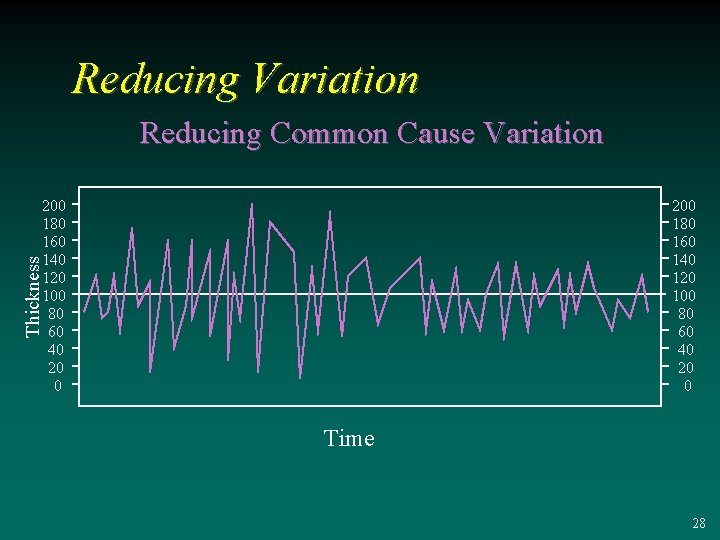
Reducing Variation Reducing Common Cause Variation 200 180 160 140 120 100 80 60 40 20 0 Thickness 200 180 160 140 120 100 80 60 40 20 0 Time 28
Reducing Variation in a Stable Process Make Permanent Changes are based on the scientific approach 3 3 Structured problem solving Planned experiments Examples: new equipment, equipment upgrade, new procedure, new machine settings, better raw material 29
Reducing Variation 3 3 Reducing Variation in an Unstable Process Do not ignore special causes. Do quickly detect special cause variations. Do stop production until the process is fixed. (Reactive) Do identify and permanently eliminate special causes. (Preventive) 30
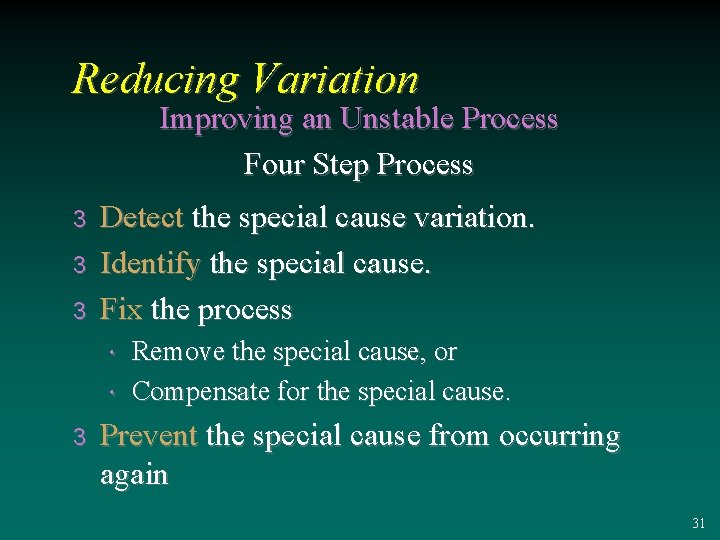
Reducing Variation Improving an Unstable Process Four Step Process 3 3 3 Detect the special cause variation. Identify the special cause. Fix the process • Remove the special cause, or • Compensate for the special cause. 3 Prevent the special cause from occurring again 31
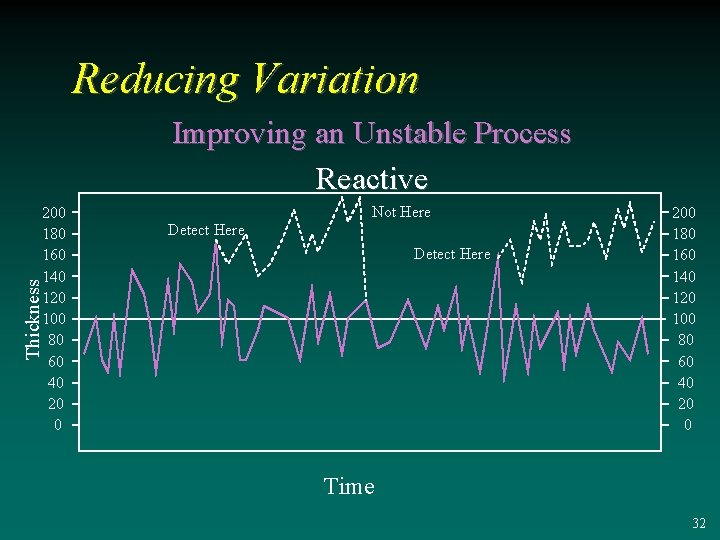
Reducing Variation Improving an Unstable Process Reactive Not Here Detect Here Thickness 200 180 160 140 120 100 80 60 40 20 0 Time 32
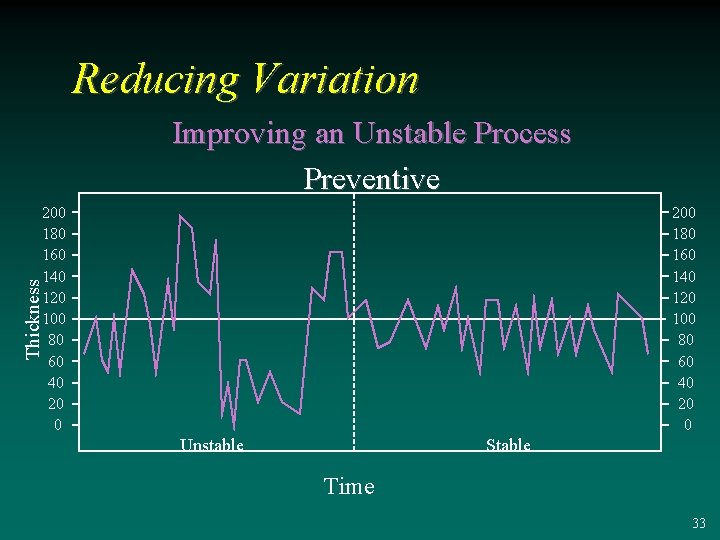
Reducing Variation Improving an Unstable Process Preventive 200 180 160 140 120 100 80 60 40 20 0 Thickness 200 180 160 140 120 100 80 60 40 20 0 Unstable Stable Time 33
Detecting Variation How can we decide if variation is the result of common or special cause? 34
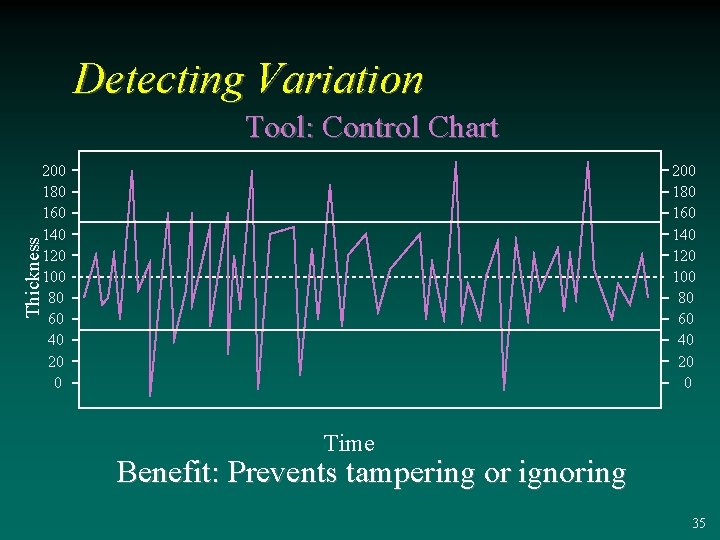
Detecting Variation Tool: Control Chart 200 180 160 140 120 100 80 60 40 20 0 Thickness 200 180 160 140 120 100 80 60 40 20 0 Time Benefit: Prevents tampering or ignoring 35
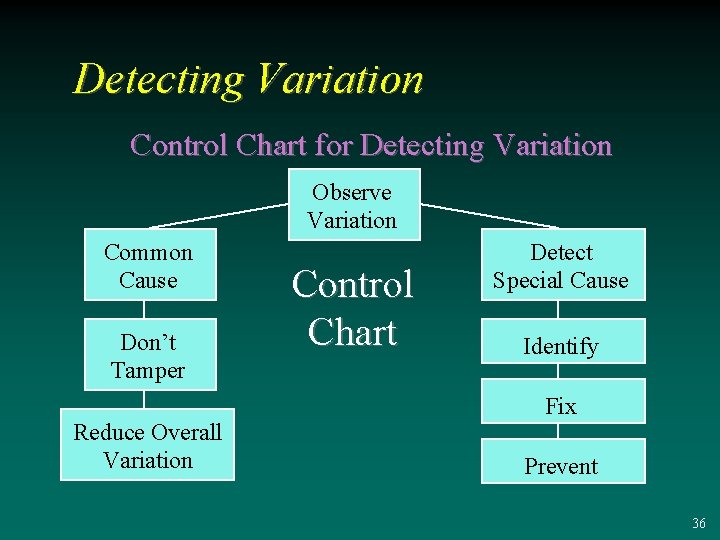
Detecting Variation Control Chart for Detecting Variation Observe Variation Common Cause Don’t Tamper Reduce Overall Variation Control Chart Detect Special Cause Identify Fix Prevent 36
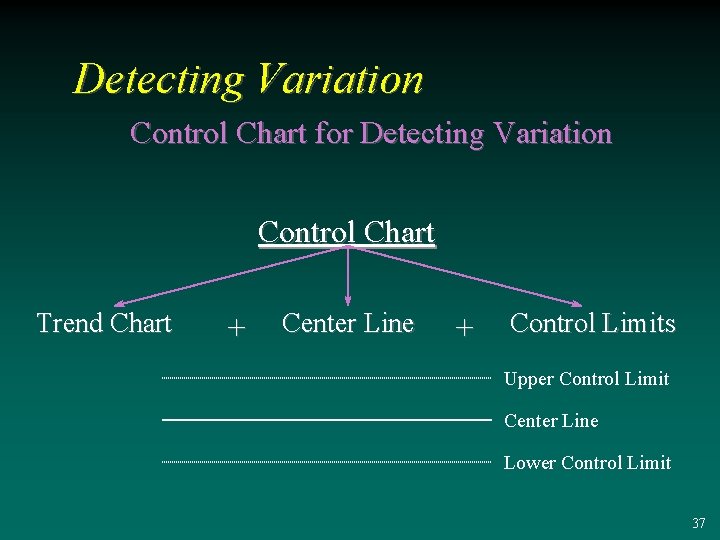
Detecting Variation Control Chart for Detecting Variation Control Chart Trend Chart + Center Line + Control Limits Upper Control Limit Center Line Lower Control Limit 37
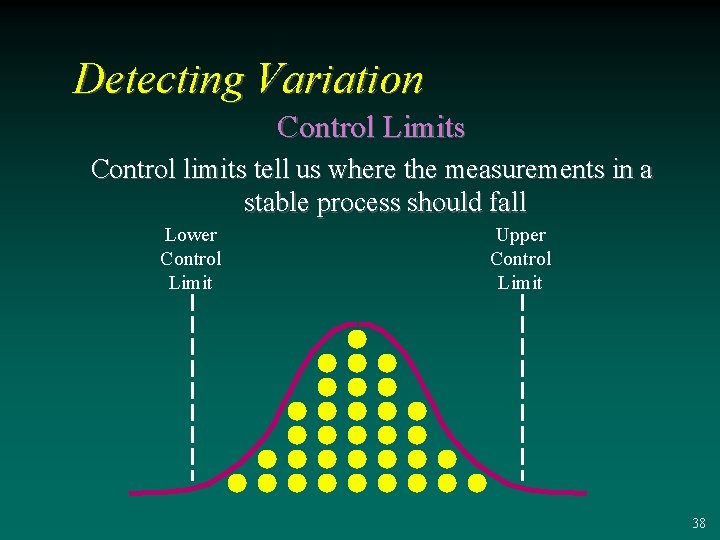
Detecting Variation Control Limits Control limits tell us where the measurements in a stable process should fall Lower Control Limit Upper Control Limit 38
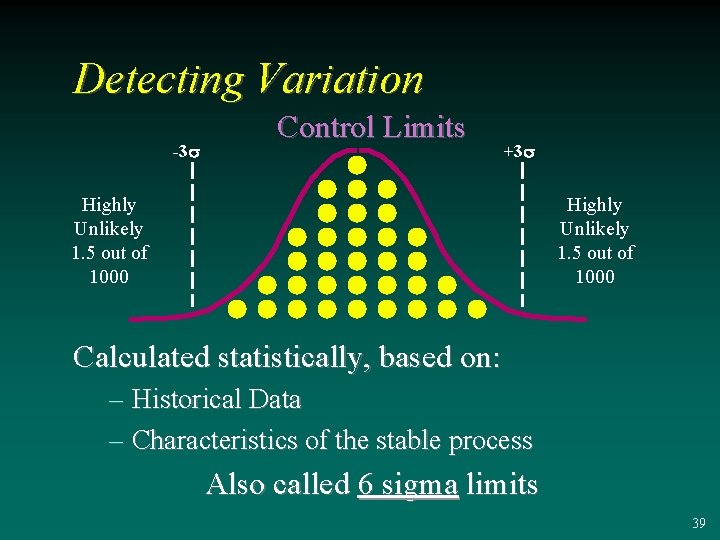
Detecting Variation -3 s Control Limits +3 s Highly Unlikely 1. 5 out of 1000 Calculated statistically, based on: – Historical Data – Characteristics of the stable process Also called 6 sigma limits 39
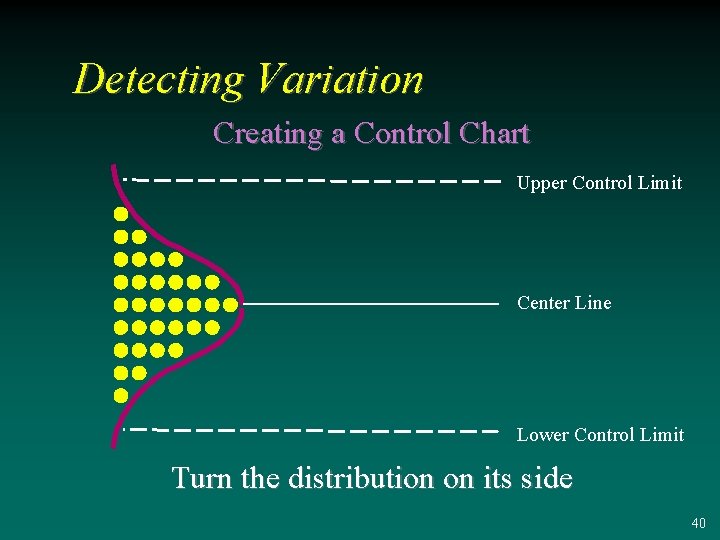
Detecting Variation Creating a Control Chart Upper Control Limit Center Line Lower Control Limit Turn the distribution on its side 40
Detecting Variation Can we use spec limits as control limits? Can we compute control limits for an unstable process? 41
Detecting Variation Creating a Control Chart What is the Center Line? Process mean, based on historical data or Process Target 42
Detecting Variation Creating a Control Chart Selecting the Center Line Measurements: Defects: The center line should be the target, unless we are unable or unwilling to control the process to target. Since the target is zero defects, the center line is the process mean. 43
Detecting Variation Control Limits vs. Spec Limits 3 3 Control Limits Based on performance of the process. Tell us when to take action on the process. 3 3 Spec Limits Based on performance of the product. Tell us when to disposition the product. 44
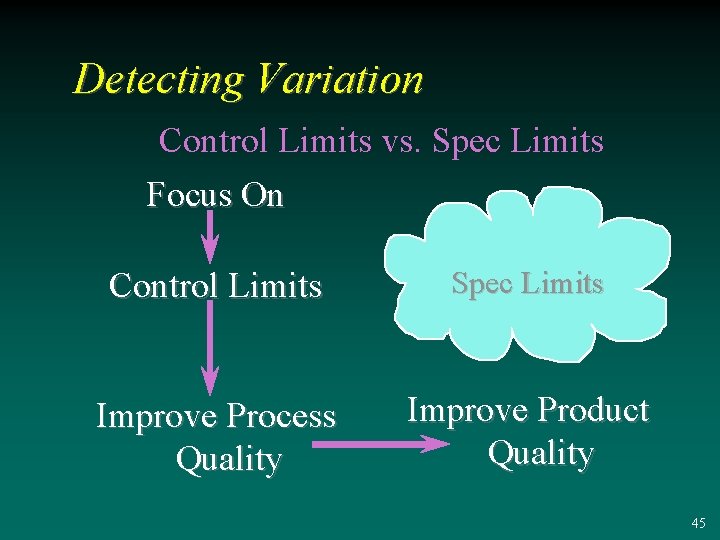
Detecting Variation Control Limits vs. Spec Limits Focus On Control Limits Spec Limits Improve Process Quality Improve Product Quality 45
Detecting Variation Uses of a Control Chart 3 On-Line: Assess the present stability of a process, as part of a process control system (PCS) 3 Off-Line: Assess the historical stability of a process 46
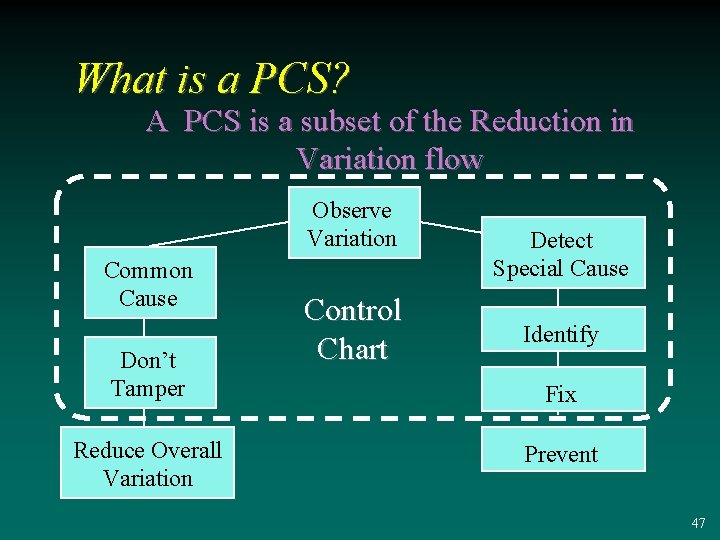
What is a PCS? A PCS is a subset of the Reduction in Variation flow Observe Variation Common Cause Don’t Tamper Reduce Overall Variation Control Chart Detect Special Cause Identify Fix Prevent 47
What is a PCS? Definition A process control system is an on-line, realtime system for identifying and responding to process/equipment problems 48
What is a PCS? Elements of a Process Control System 3 3 3 Measurements Calculations Control Chart PCS Rules Response Flow 49
Elements of a PCS Rules Set of rules applied to the data plotted on the control chart to determine if the process is stable or unstable. 50
Elements of a PCS Response Flow Sequence of actions followed to respond to an unstable process 51
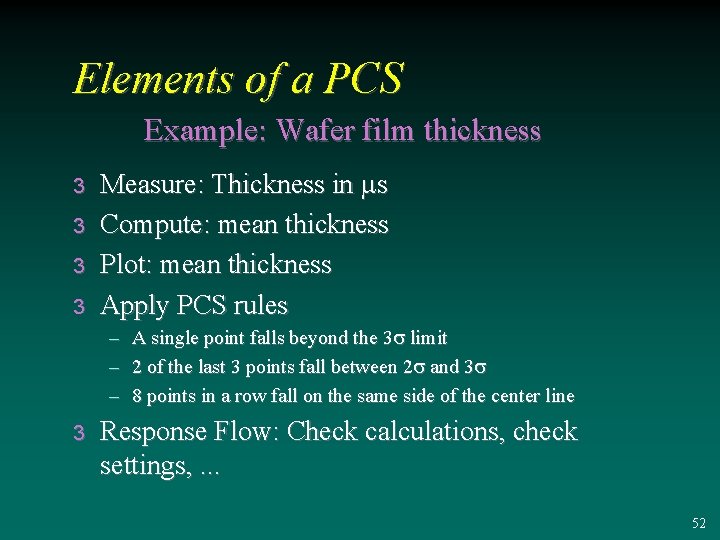
Elements of a PCS Example: Wafer film thickness 3 3 Measure: Thickness in ms Compute: mean thickness Plot: mean thickness Apply PCS rules – A single point falls beyond the 3 s limit – 2 of the last 3 points fall between 2 s and 3 s – 8 points in a row fall on the same side of the center line 3 Response Flow: Check calculations, check settings, . . . 52
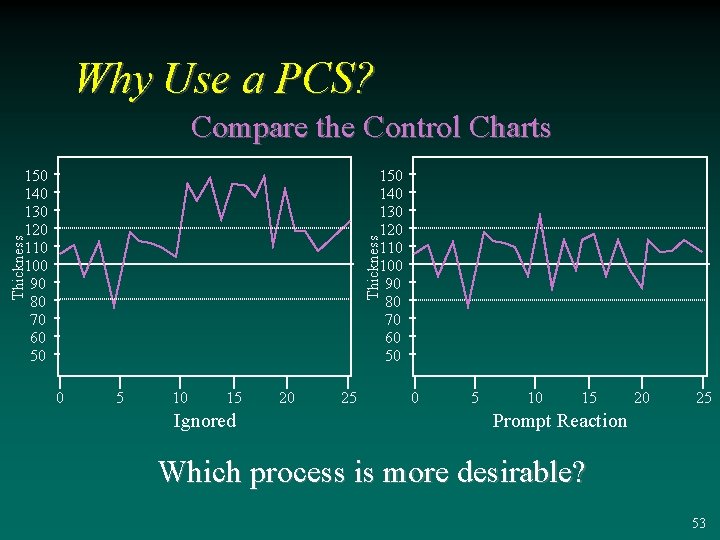
Why Use a PCS? Compare the Control Charts Thickness 150 140 130 120 110 100 90 80 70 60 50 0 5 10 15 Ignored 20 25 0 5 10 15 20 25 Prompt Reaction Which process is more desirable? 53
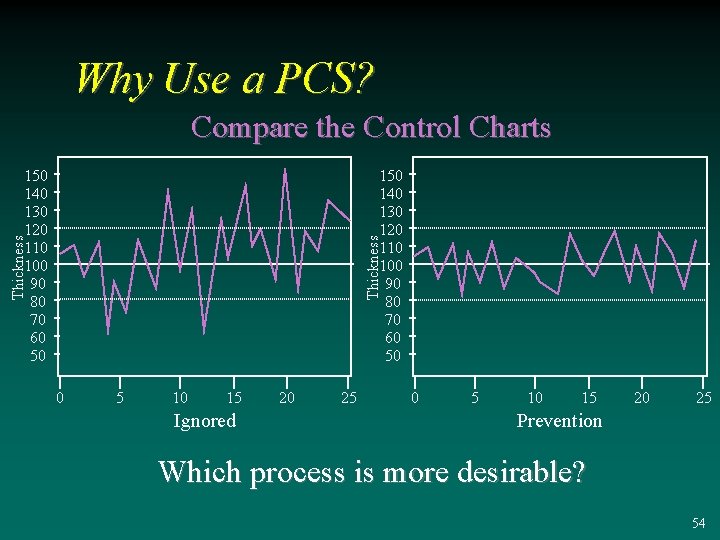
Why Use a PCS? Compare the Control Charts Thickness 150 140 130 120 110 100 90 80 70 60 50 0 5 10 15 Ignored 20 25 0 5 10 15 20 25 Prevention Which process is more desirable? 54
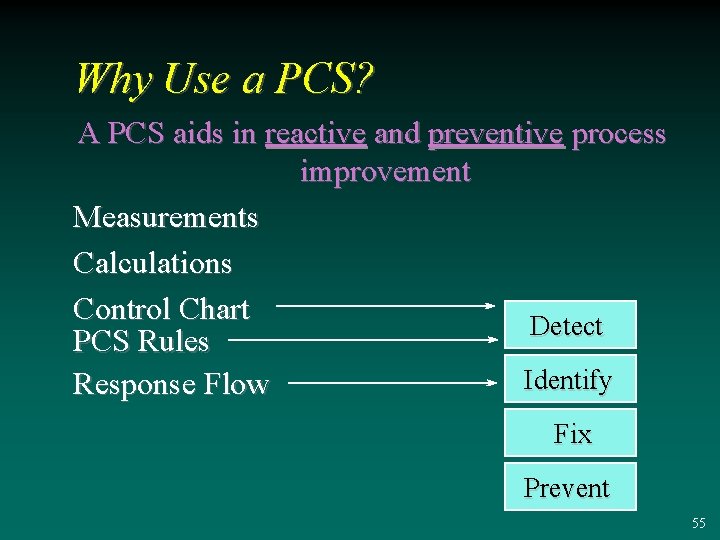
Why Use a PCS? A PCS aids in reactive and preventive process improvement Measurements Calculations Control Chart Detect PCS Rules Identify Response Flow Fix Prevent 55
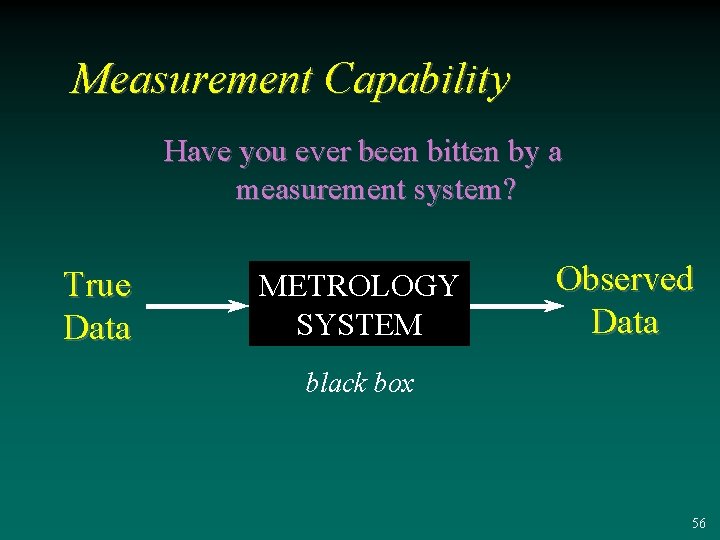
Measurement Capability Have you ever been bitten by a measurement system? True Data METROLOGY SYSTEM Observed Data black box 56
Measurement Capability 3 A Measurement Process Measurement tools themselves – hardware – software 3 All the procedures for using the tools – which operators – set-up/handling procedures – off-line calculations and data entry – calibration frequency and technique 57
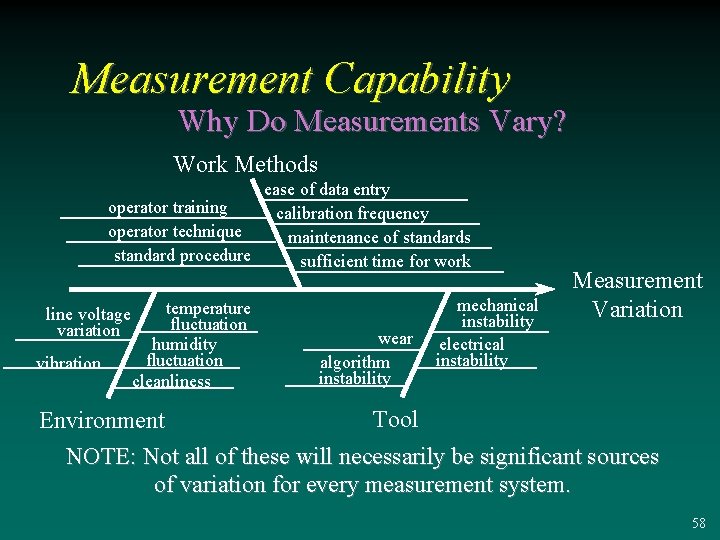
Measurement Capability Why Do Measurements Vary? Work Methods ease of data entry operator training calibration frequency operator technique maintenance of standards standard procedure sufficient time for work line voltage variation vibration temperature fluctuation humidity fluctuation cleanliness wear algorithm instability mechanical instability electrical instability Measurement Variation Tool Environment NOTE: Not all of these will necessarily be significant sources of variation for every measurement system. 58
Measurement Capability Assumptions We Often Make 3 Metrology tools are perfectly accurate 3 No day-to-day variation in performance 3 No operator-to-operator variation 59
Measurement Capability MCA Tells Us: 3 3 3 How big is the measurement error? What are the sources of measurement error? Is the tool stable over time? Is the tool capable of making the measurements for this project? Is the tool capable of making the measurements for this process? What needs to be done to improve the measurement process? 60
Measurement Capability vs. Calibration Procedure to compare readings from a tool with a standard and then correct for any deviations. Statistically: centering the mean of the distribution of readings on the “true value” (obtained from a standard). 61
Measurement Capability vs. Calibration (cont’d) Capability Procedure to identify and quantify sources of variation in readings and then eliminate them. Statistically: fitting the model to the readings so that the components of variance can be estimated. Both work together to keep measurement tool performing optimally. 62
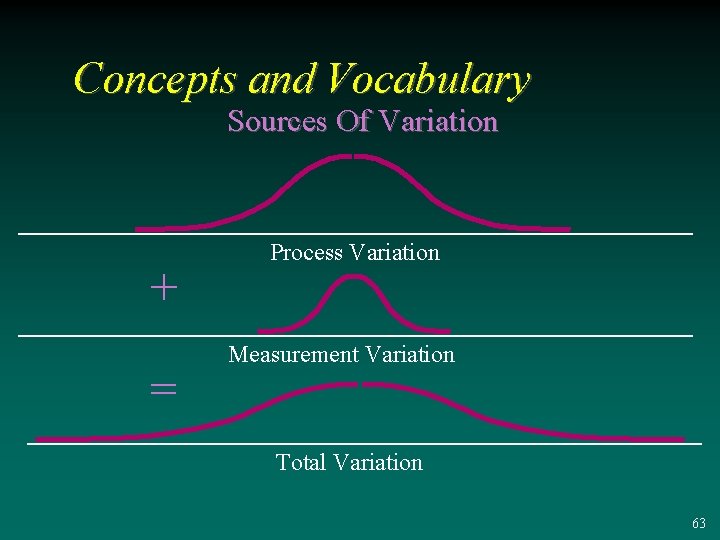
Concepts and Vocabulary Sources Of Variation + = Process Variation Measurement Variation Total Variation 63
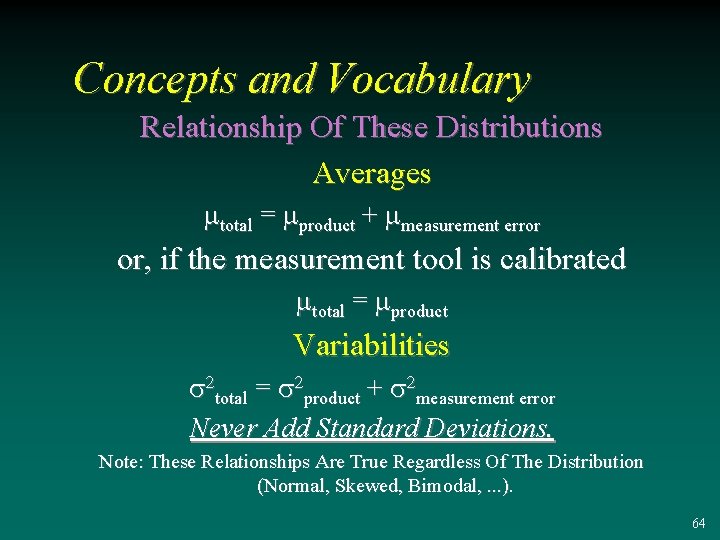
Concepts and Vocabulary Relationship Of These Distributions Averages mtotal = mproduct + mmeasurement error or, if the measurement tool is calibrated mtotal = mproduct Variabilities s 2 total = s 2 product + s 2 measurement error Never Add Standard Deviations. Note: These Relationships Are True Regardless Of The Distribution (Normal, Skewed, Bimodal, . . . ). 64
Concepts and Vocabulary Activity Suppose you have a process which has been operating for a significant period of time and has a s of 10 units. Then a measurement capability study is done and the measurement error (sms) of the metrology system is found to be 6 units. 3 3 What is the true variability of the product? How could you confirm that? 65
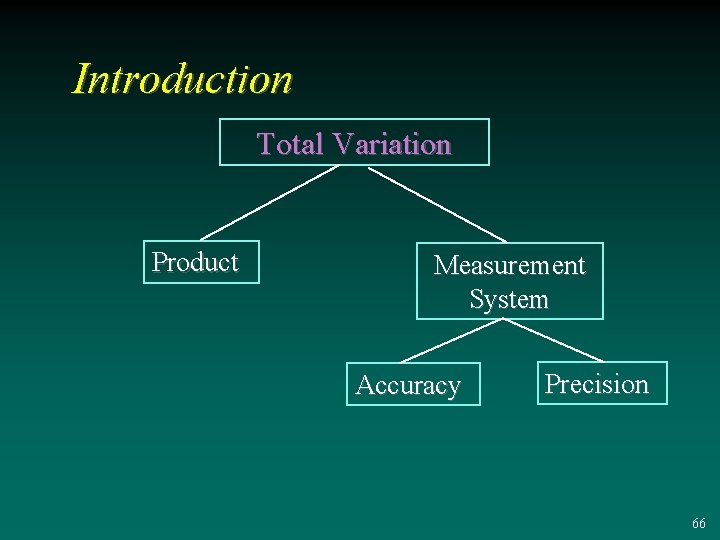
Introduction Total Variation Product Measurement System Accuracy Precision 66
Concepts and Vocabulary Accuracy The degree to which a process mean is on target Related Terms True Value Bias 67
Concepts and Vocabulary Precision The degree of variability in a process Related Terms Repeatability Reproducibility 68
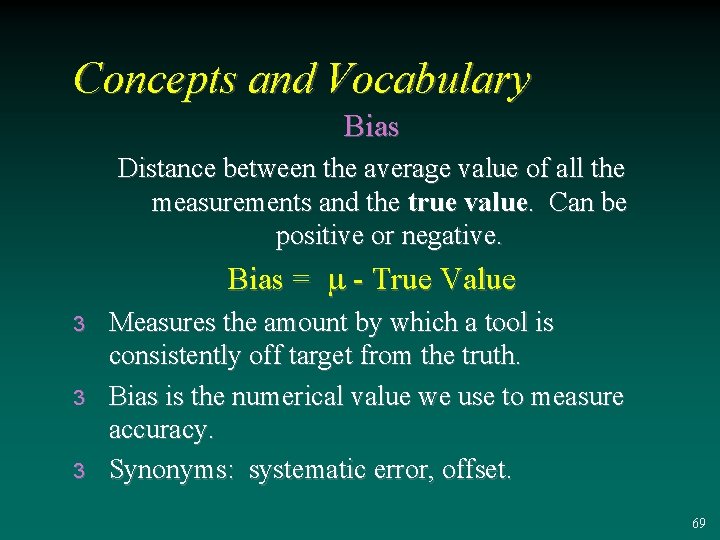
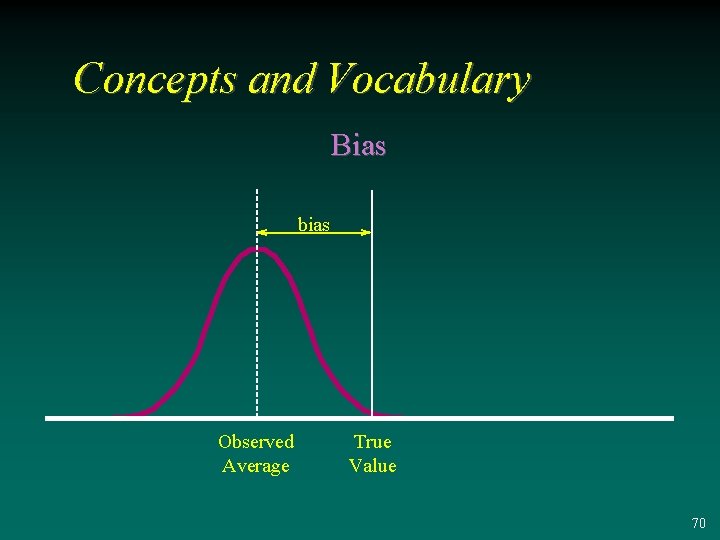
Concepts and Vocabulary Bias Distance between the average value of all the measurements and the true value. Can be positive or negative. Bias = m - True Value 3 3 3 Measures the amount by which a tool is consistently off target from the truth. Bias is the numerical value we use to measure accuracy. Synonyms: systematic error, offset. 69
Concepts and Vocabulary Bias bias Observed Average True Value 70
Concepts and Vocabulary Precision Says Nothing About How Close The Measurements Are To The Truth. Accuracy Says Nothing About How Close Measurements Are To Each Other. 71
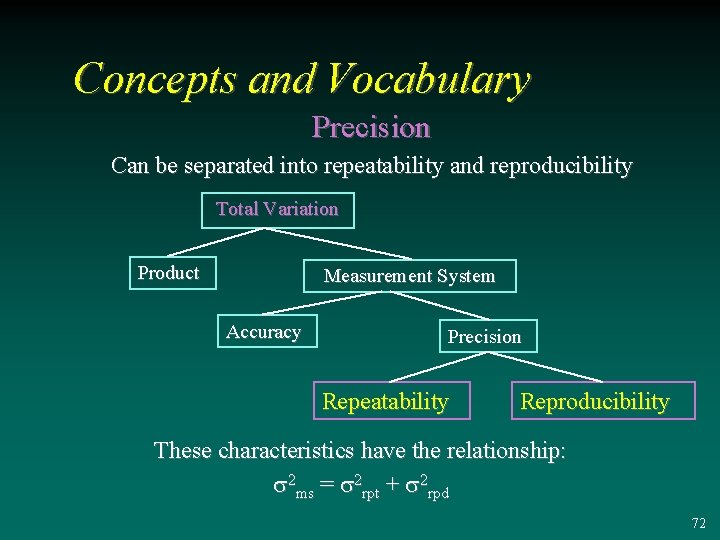
Concepts and Vocabulary Precision Can be separated into repeatability and reproducibility Total Variation Product Measurement System Accuracy Precision Repeatability Reproducibility These characteristics have the relationship: s 2 ms = s 2 rpt + s 2 rpd 72
Concepts and Vocabulary Repeatability Variation that results when repeated measurements are made of the same parameter under absolutely identical conditions. 3 Same operator 3 Same set-up procedure 3 Same part 3 Same environmental conditions Repeatability (s 2 rpt) is usually much smaller (better) than the precision of the system. 73
Concepts and Vocabulary Reproducibility The variation that results when different conditions are used to make the measurement. 3 Different Operators 3 Different Set-Up Procedures 3 Different Measurement Tools 3 Different Environmental Conditions 3 Different Days Reproducibility (srpd), is approximately the standard deviation of the averages of measurements from different measurement conditions. 74
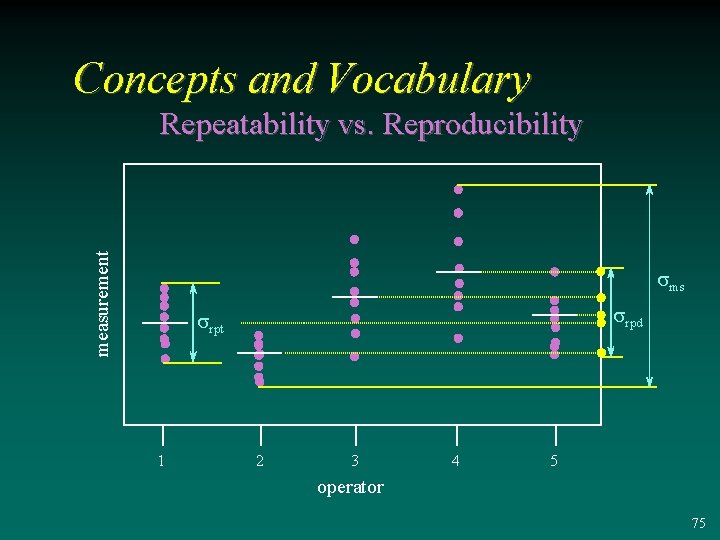
Concepts and Vocabulary measurement Repeatability vs. Reproducibility sms srpd srpt 1 2 3 4 5 operator 75
Concepts and Vocabulary Suppose the results of your measurement capability study show that srpt is 2. 4 Units and srpd is 1. 1 Units. What Is The Precision? 76
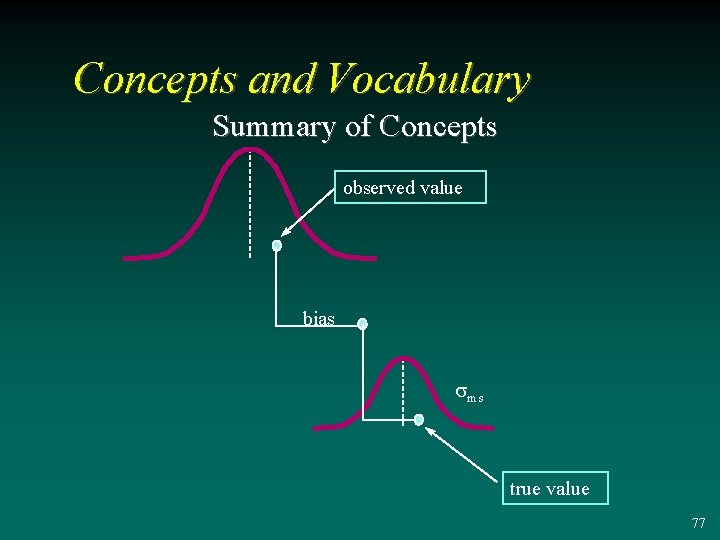
Concepts and Vocabulary Summary of Concepts observed value bias sms true value 77
Capability Indices Now that we understand the impact that measurement has on variation, how can we determine its impact on the product and process? Two Approaches 3 3 Compare measurement error to specs Compare measurement error to process variability 78
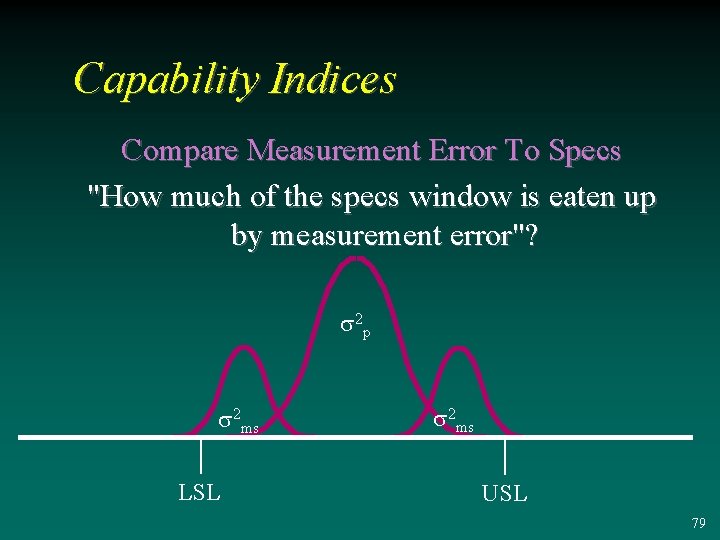
Capability Indices Compare Measurement Error To Specs "How much of the specs window is eaten up by measurement error"? s 2 p s 2 ms LSL s 2 ms USL 79
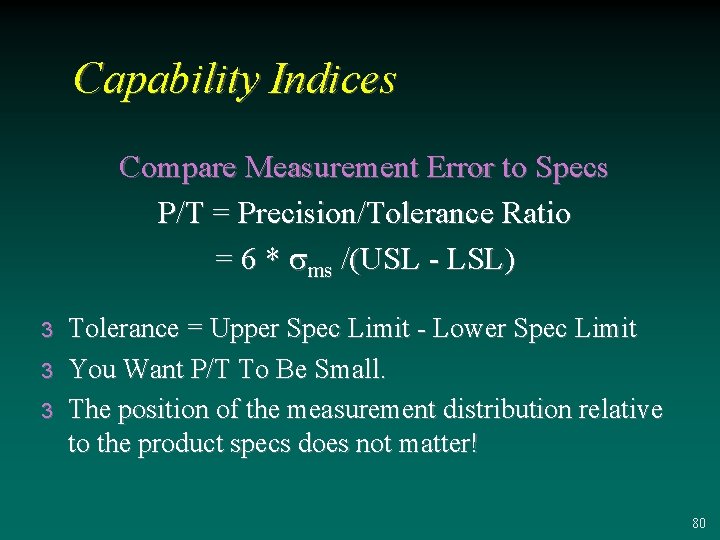
Capability Indices Compare Measurement Error to Specs P/T = Precision/Tolerance Ratio = 6 * sms /(USL - LSL) 3 3 3 Tolerance = Upper Spec Limit - Lower Spec Limit You Want P/T To Be Small. The position of the measurement distribution relative to the product specs does not matter! 80
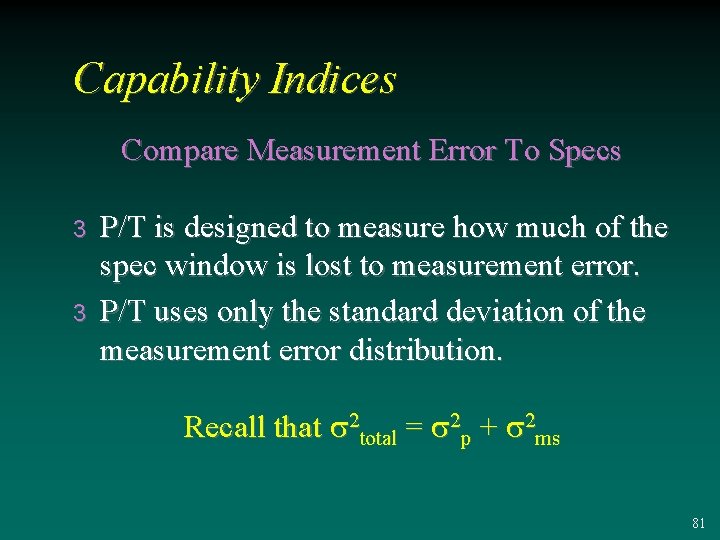
Capability Indices Compare Measurement Error To Specs 3 3 P/T is designed to measure how much of the spec window is lost to measurement error. P/T uses only the standard deviation of the measurement error distribution. Recall that s 2 total = s 2 p + s 2 ms 81
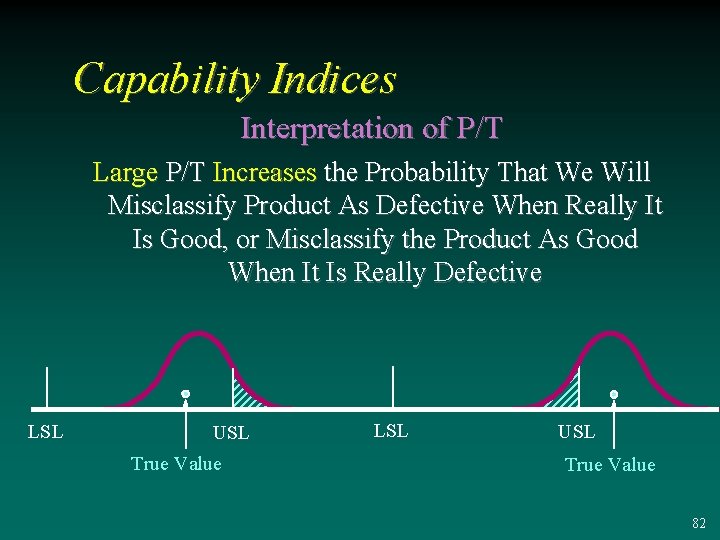
Capability Indices Interpretation of P/T Large P/T Increases the Probability That We Will Misclassify Product As Defective When Really It Is Good, or Misclassify the Product As Good When It Is Really Defective LSL USL True Value 82
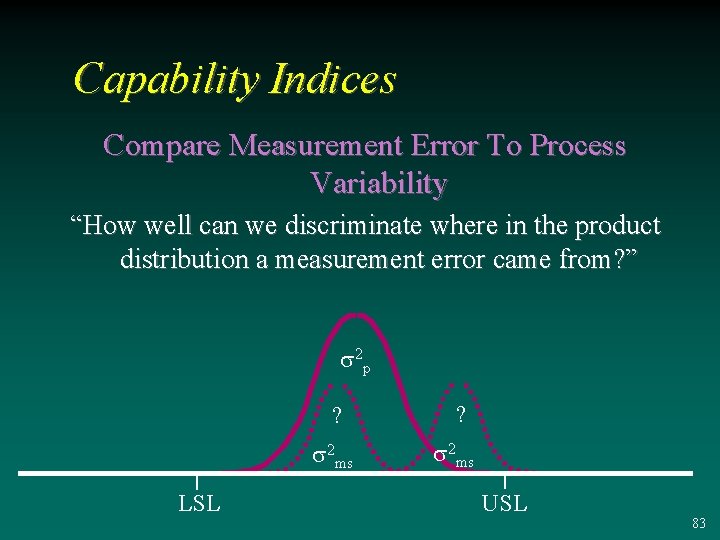
Capability Indices Compare Measurement Error To Process Variability “How well can we discriminate where in the product distribution a measurement error came from? ” s 2 p ? s 2 ms LSL ? s 2 ms USL 83
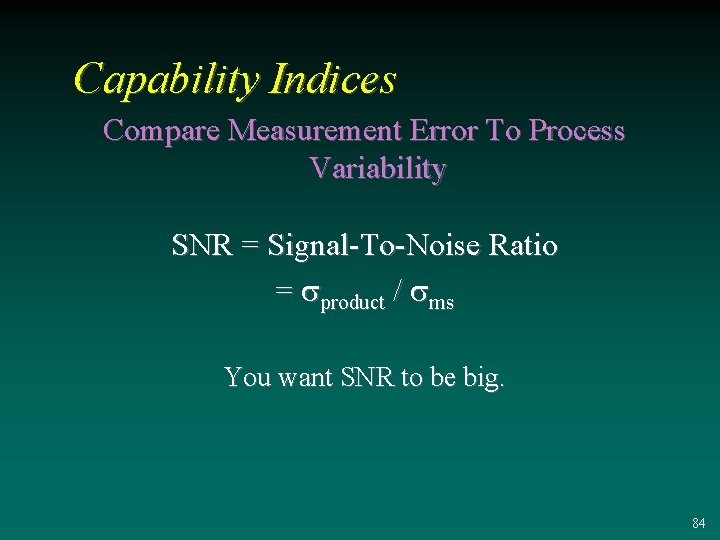
Capability Indices Compare Measurement Error To Process Variability SNR = Signal-To-Noise Ratio = sproduct / sms You want SNR to be big. 84
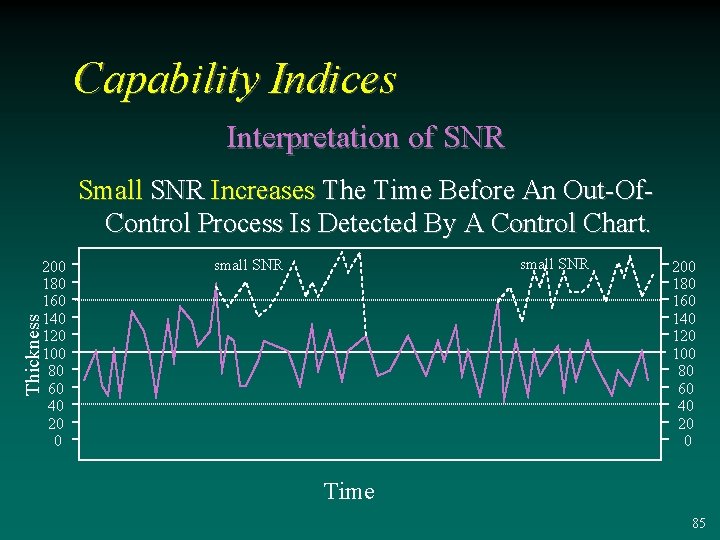
Capability Indices Interpretation of SNR Small SNR Increases The Time Before An Out-Of. Control Process Is Detected By A Control Chart. small SNR Thickness 200 180 160 140 120 100 80 60 40 20 0 Time 85
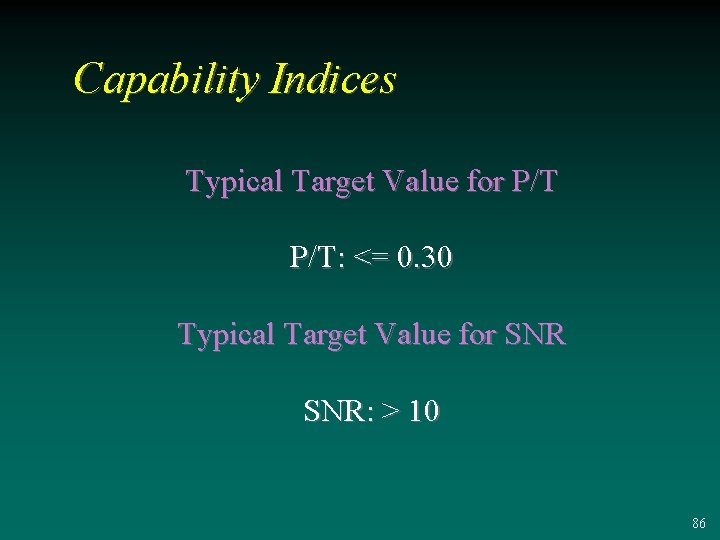
Capability Indices Typical Target Value for P/T: <= 0. 30 Typical Target Value for SNR: > 10 86
Capability Indices Cautions 3 3 3 Poorly developed spec limits imply meaningless P/T. Large P/T does not mean that engineering effort should be expended on improving metrology. The process may be so poor that improving metrology won't help in the short run. P/T and SNR do not indicate where the problem exists in the measurement system (operator, tool, repeatability). 87
Capability Indices Caution (cont’d) 3 3 3 Poor P/T performance may be partially overcome by increasing the sample size. Need to look at both P/T and SNR to get the full story. Confidence intervals for P/T and SNR can be calculated. 88
- Slides: 88