VaporLiquid Phase equilibrium Layout Objectives Concept of equilibrium

Vapor-Liquid Phase equilibrium

Layout Objectives Concept of equilibrium Form and sources of equilibrium data Graphical representation of equilibrium data Graphical mass balances for equilibrium systems Other representation of equilibrium data Calculation of bubble- and dew-point temperatures

Objectives of this session Explain what is meant by phase equilibrium Find desired VLE data in the literature Plot and use y-x, T-C, and H-C diagrams. Explain the relationships between these three diagrams. Derive the lever arm rule. Define and use K-values, Raoults’ law, and relative volatility Use trial and error methods to calculate bubble-point and dew-point temperature. back

Concept of equilibrium stage Equilibrium stage concept? The conditions for phase equilibria are:

Form and sources of equilibrium data

back
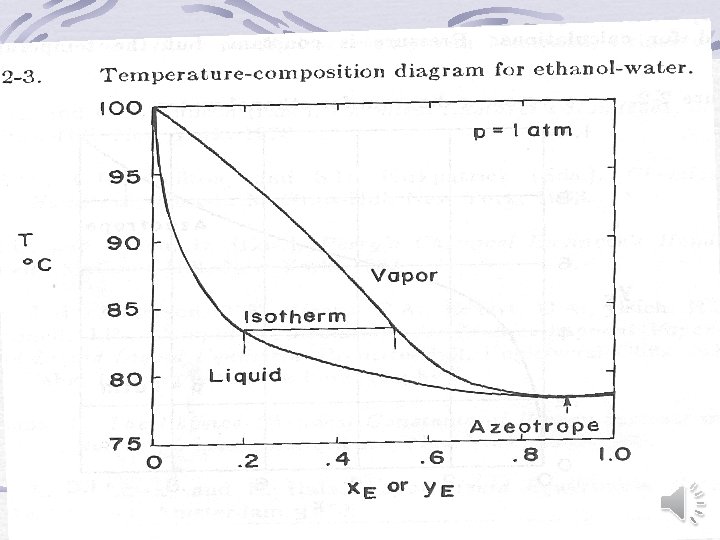
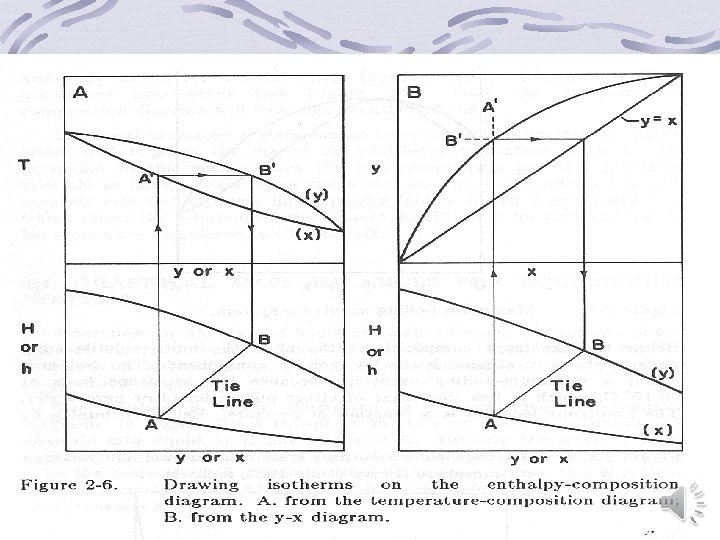
 diagram Temperature-Composition diagram")
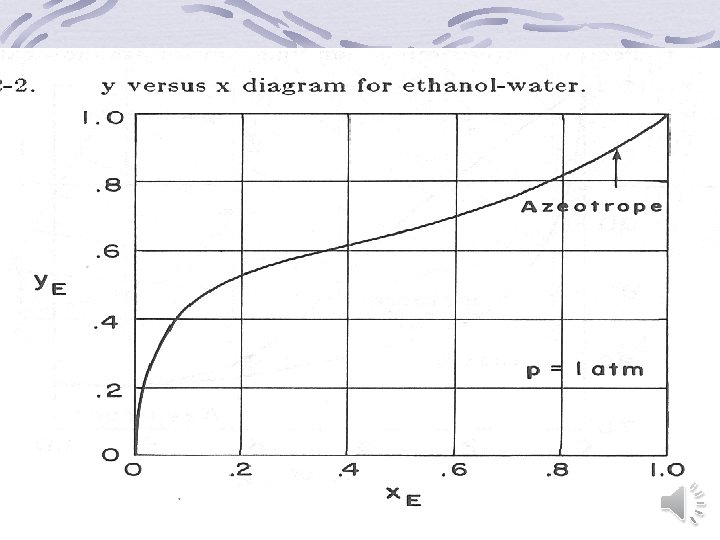
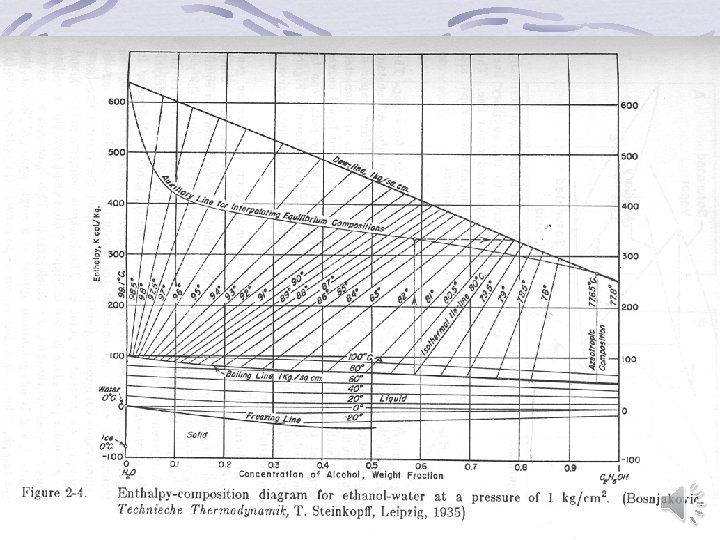
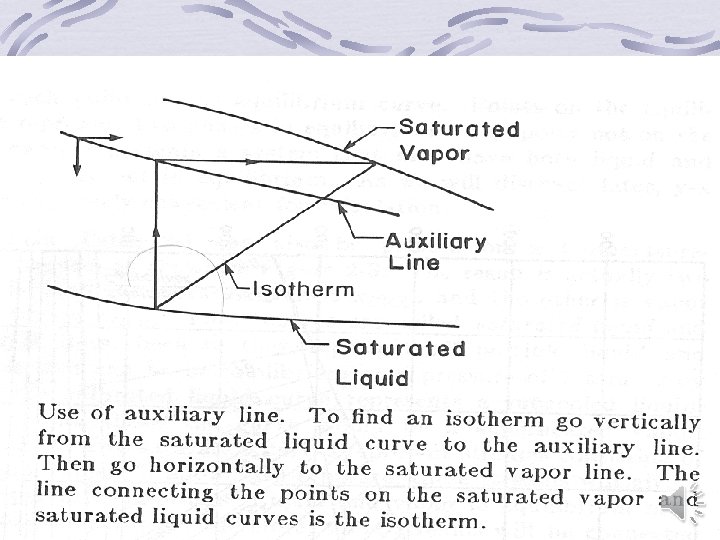
Graphical representation of binary equilibrium data y versus x (Mc. Cabe-Thiele) diagram Temperature-Composition diagram Enthalpy-Composition (Ponchon-Savarit) Diagram back

Back

Graphical mass balances for equilibrium systems Determination the amounts of liquid and vapor when two phase mixture separates (Lever arm rule) Back
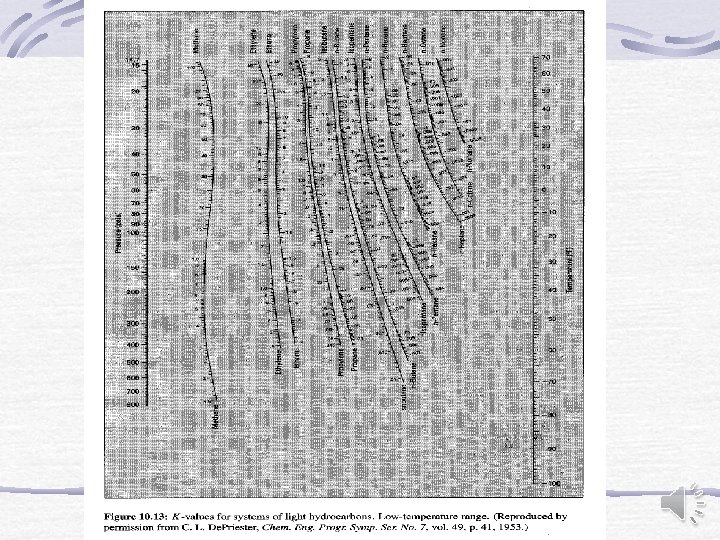
 For light hydrocarbons De. Priester")
Other representation of equilibrium data Equilibrium constant (Distribution coefficient) For light hydrocarbons De. Priester monographs
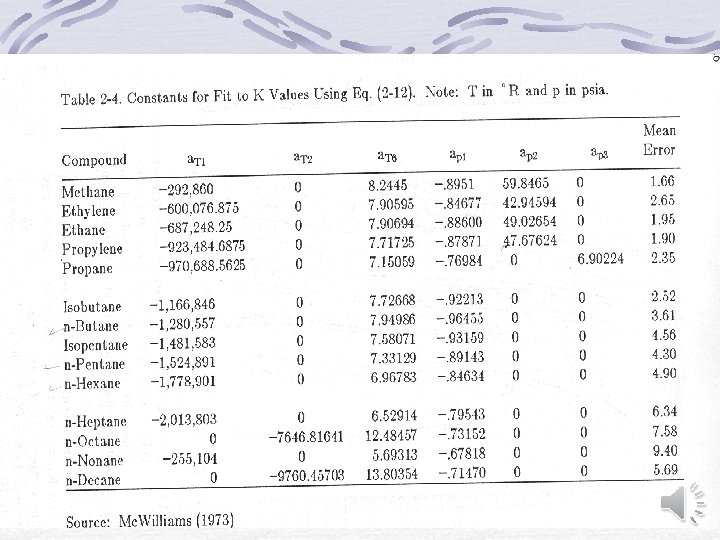
 K-value Correlation Wilson (1968) Mc. Williams (1973)")
Other representation of equilibrium data (cont. ) K-value Correlation Wilson (1968) Mc. Williams (1973) It is valid in the range of -70 o. C to 200 o. C
")
Almehaideb-Ashour-El-Fattah (2003)

High pressures – K-values for light hydrocarbon systems Use of equation of state for K-values: In modern practice, VLE calculations for light-hydrocarbon systems are done using computer calculations based on equations of state, such as the Soave-Redlich-Kwong equation or the Peng-Robinson equation In this approach, fugacity coefficients are used to express the fugacity of both the liquid and vapor phases relative to the ideal gas The following phase equilibrium relations result: The same equation of state is used to evaluate the two fugacity coefficients, which are functions of (T, P, xi’s) and (T, P, yi’s), respectively Back

Constraints

Raoults Law Assumptions The vapor phase is an ideal gas, Limits: it can be applied for low and moderate pressures The liquid phase is an ideal liquid solution. Limits: valid only for species of chemical similarity. General limitation: valid only in sub-critical region and for species that have vapor pressures.
 The model")
Raoults Law (cont. ) The model

Modified Raoults Law The model

Relative volatility The model back

Calculation of bubble point and dew point temperatures Bubble point calculation: P and xi = zi (given) Trial and error method Excel program is a suitable tool HYSYS or Design II back

Back
- Slides: 27