
VAM Primer www FLDOE org 2014 Florida Department


- Slides: 46
VAM Primer www. FLDOE. org © 2014, Florida Department of Education. All Rights Reserved.
Agenda • • History Statute Files provided to Districts Model Performance and Results www. FLDOE. org © 2014, Florida Department of Education. All Rights Reserved. 2
History www. FLDOE. org © 2014, Florida Department of Education. All Rights Reserved. 3
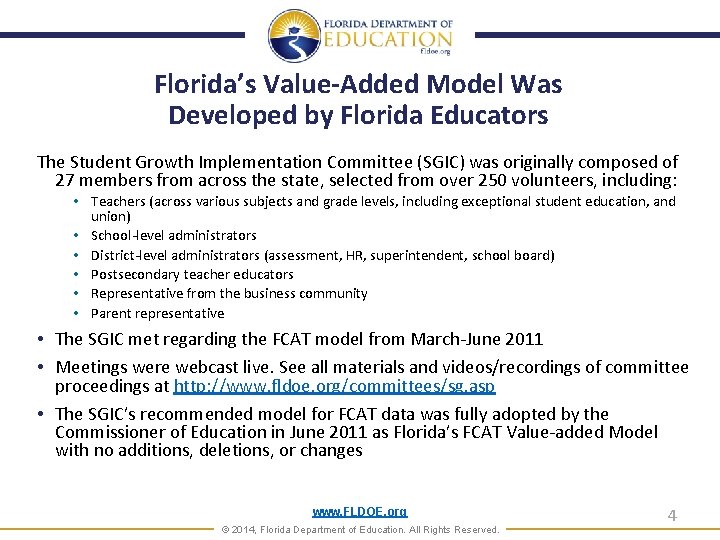
Florida’s Value-Added Model Was Developed by Florida Educators The Student Growth Implementation Committee (SGIC) was originally composed of 27 members from across the state, selected from over 250 volunteers, including: • Teachers (across various subjects and grade levels, including exceptional student education, and union) • School-level administrators • District-level administrators (assessment, HR, superintendent, school board) • Postsecondary teacher educators • Representative from the business community • Parent representative • The SGIC met regarding the FCAT model from March-June 2011 • Meetings were webcast live. See all materials and videos/recordings of committee proceedings at http: //www. fldoe. org/committees/sg. asp • The SGIC’s recommended model for FCAT data was fully adopted by the Commissioner of Education in June 2011 as Florida’s FCAT Value-added Model with no additions, deletions, or changes www. FLDOE. org © 2014, Florida Department of Education. All Rights Reserved. 4
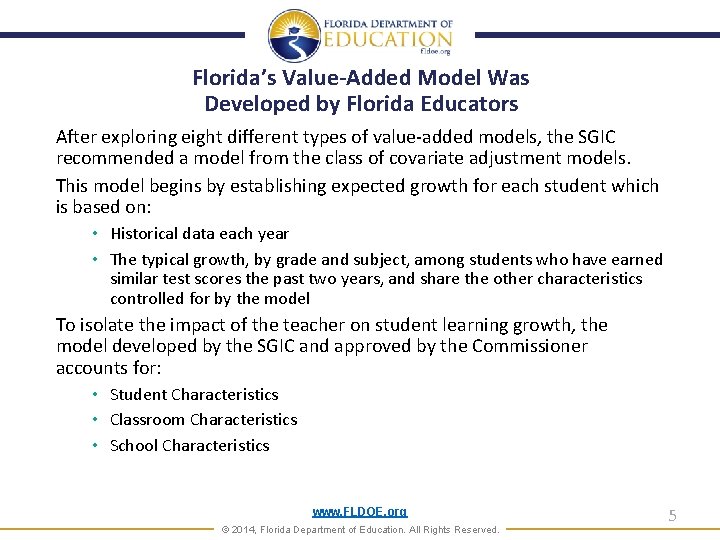
Florida’s Value-Added Model Was Developed by Florida Educators After exploring eight different types of value-added models, the SGIC recommended a model from the class of covariate adjustment models. This model begins by establishing expected growth for each student which is based on: • Historical data each year • The typical growth, by grade and subject, among students who have earned similar test scores the past two years, and share the other characteristics controlled for by the model To isolate the impact of the teacher on student learning growth, the model developed by the SGIC and approved by the Commissioner accounts for: • Student Characteristics • Classroom Characteristics • School Characteristics www. FLDOE. org © 2014, Florida Department of Education. All Rights Reserved. 5
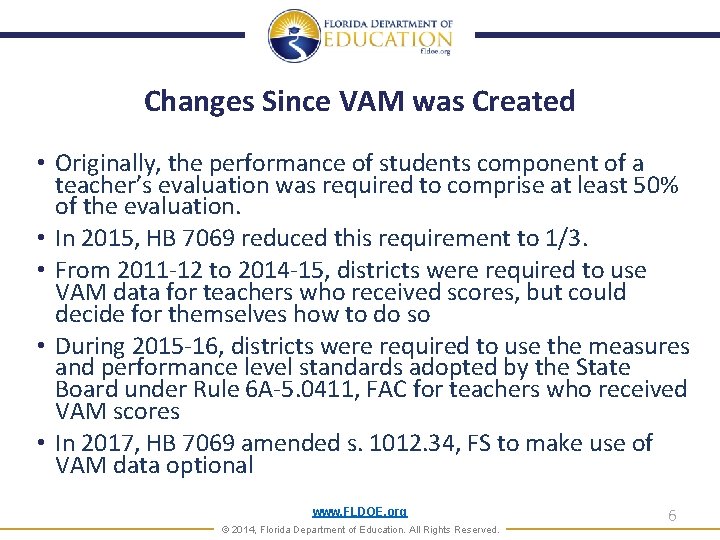
Changes Since VAM was Created • Originally, the performance of students component of a teacher’s evaluation was required to comprise at least 50% of the evaluation. • In 2015, HB 7069 reduced this requirement to 1/3. • From 2011 -12 to 2014 -15, districts were required to use VAM data for teachers who received scores, but could decide for themselves how to do so • During 2015 -16, districts were required to use the measures and performance level standards adopted by the State Board under Rule 6 A-5. 0411, FAC for teachers who received VAM scores • In 2017, HB 7069 amended s. 1012. 34, FS to make use of VAM data optional www. FLDOE. org © 2014, Florida Department of Education. All Rights Reserved. 6
Statute www. FLDOE. org © 2014, Florida Department of Education. All Rights Reserved. 7
Overview • Performance of students is required by law to be included in educator evaluations (s. 1012. 34, FS) • For about 1/3 of classroom teachers, a VAM score is produced • Districts have locally approved evaluation systems that describe how VAM scores will be used in their teachers’ and administrators’ evaluations www. FLDOE. org © 2014, Florida Department of Education. All Rights Reserved. 8
Evaluation Procedures Section 1012. 34, F. S. , Personnel evaluation procedures and criteria • Section 3 – Evaluation procedures and criteria; • Must be based upon the performance of students assigned to the educator’s classrooms (teachers) or schools (administrators); • Must be conducted at least annually; • Must be based upon sound educational principals and contemporary research in effective educational practices; and www. FLDOE. org © 2014, Florida Department of Education. All Rights Reserved. 9
Evaluation Procedures (Continued) Section 1012. 34, F. S. , Personnel evaluation procedures and criteria • Section 3 – Evaluation procedures and criteria; • Must include 1. Performance of students (at least 1/3) 2. Instructional practice/leadership (at least 1/3) 3. Other indicators of performance www. FLDOE. org © 2014, Florida Department of Education. All Rights Reserved. 10
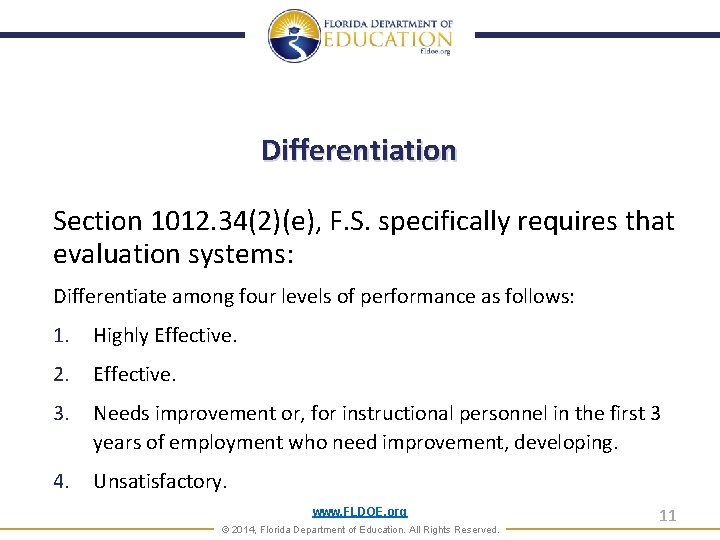
Differentiation Section 1012. 34(2)(e), F. S. specifically requires that evaluation systems: Differentiate among four levels of performance as follows: 1. Highly Effective. 2. Effective. 3. Needs improvement or, for instructional personnel in the first 3 years of employment who need improvement, developing. 4. Unsatisfactory. www. FLDOE. org © 2014, Florida Department of Education. All Rights Reserved. 11
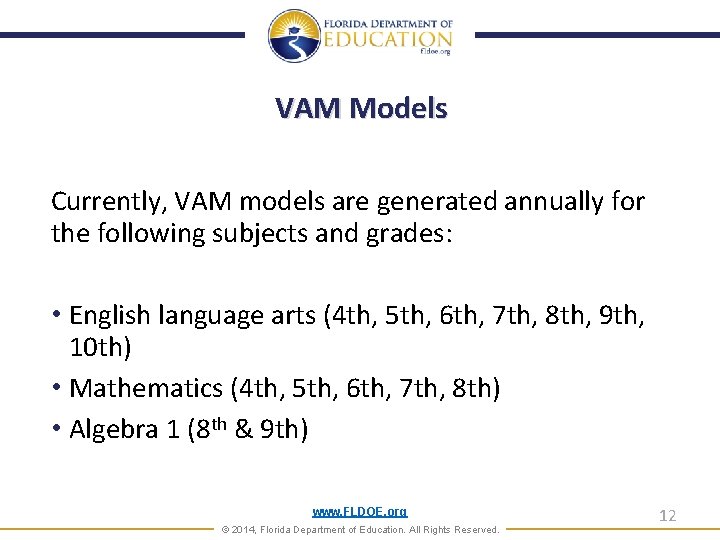
VAM Models Currently, VAM models are generated annually for the following subjects and grades: • English language arts (4 th, 5 th, 6 th, 7 th, 8 th, 9 th, 10 th) • Mathematics (4 th, 5 th, 6 th, 7 th, 8 th) • Algebra 1 (8 th & 9 th) www. FLDOE. org © 2014, Florida Department of Education. All Rights Reserved. 12
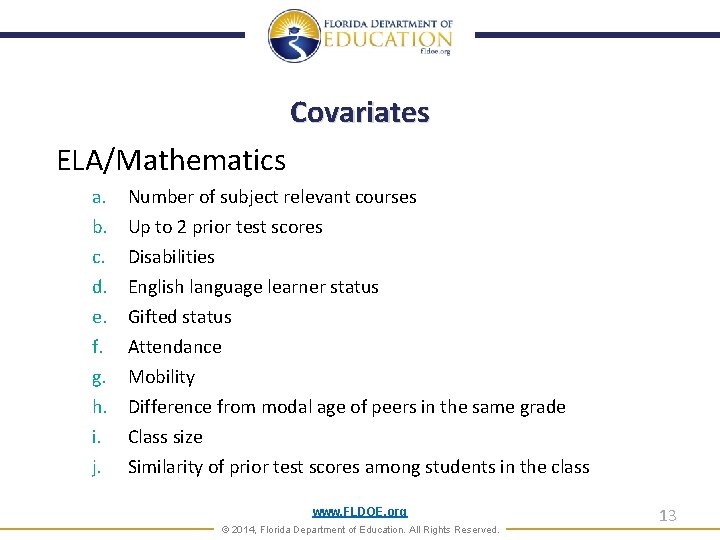
Covariates ELA/Mathematics a. b. c. d. e. f. g. h. i. j. Number of subject relevant courses Up to 2 prior test scores Disabilities English language learner status Gifted status Attendance Mobility Difference from modal age of peers in the same grade Class size Similarity of prior test scores among students in the class www. FLDOE. org © 2014, Florida Department of Education. All Rights Reserved. 13
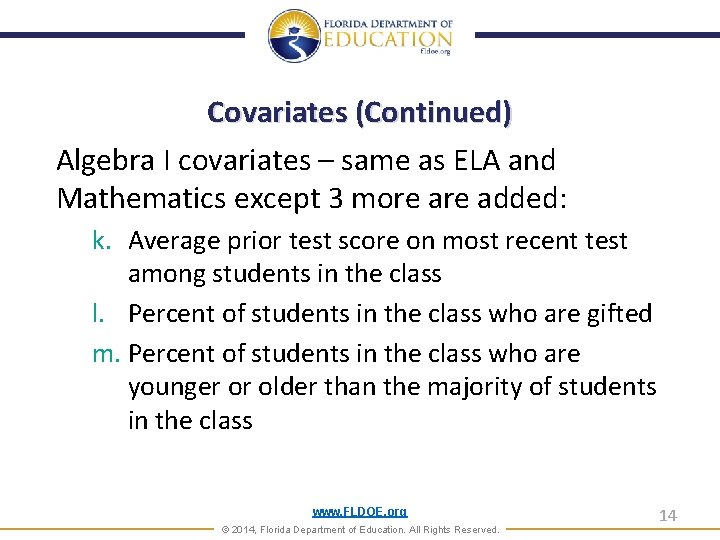
Covariates (Continued) Algebra I covariates – same as ELA and Mathematics except 3 more added: k. Average prior test score on most recent test among students in the class l. Percent of students in the class who are gifted m. Percent of students in the class who are younger or older than the majority of students in the class www. FLDOE. org © 2014, Florida Department of Education. All Rights Reserved. 14
Primary VAM Measures 1. 3 year aggregate combined VAM score ELA/Mathematics 2. Individual grade and subject VAM score Algebra I 3. Standard errors 4. Percent meeting expectations www. FLDOE. org © 2014, Florida Department of Education. All Rights Reserved. 15
Value-Added Results and Scores The formula produces a value-added score for a teacher, which reflects the average amount of learning growth of the teacher’s students above or below the expected learning growth of similar students in the state, using the variables accounted for in the model. • A score of “ 0” indicates that, on average, students performed no better or worse than expected based on the factors in the model • A positive score indicates that students, on average, performed better than expected • A negative score indicates that students, on average, performed worse than expected www. FLDOE. org © 2014, Florida Department of Education. All Rights Reserved. 16
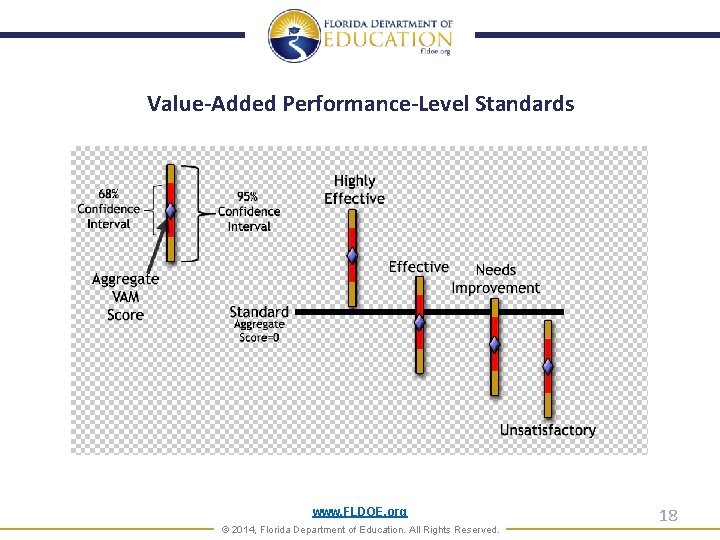
Standard Error • An estimate of a teacher’s impact on student learning (the score) contains some Variability. • The standard error is a statistical term that describes that variability. • Using the standard error to construct a confidence interval around a score (like the +/-3 points in an opinion poll) is a good statistical practice that can assist in increasing the accuracy of classification decisions. 17 www. FLDOE. org © 2014, Florida Department of Education. All Rights Reserved.
Value-Added Performance-Level Standards www. FLDOE. org © 2014, Florida Department of Education. All Rights Reserved. 18
Files Provided to Districts www. FLDOE. org © 2014, Florida Department of Education. All Rights Reserved. 19
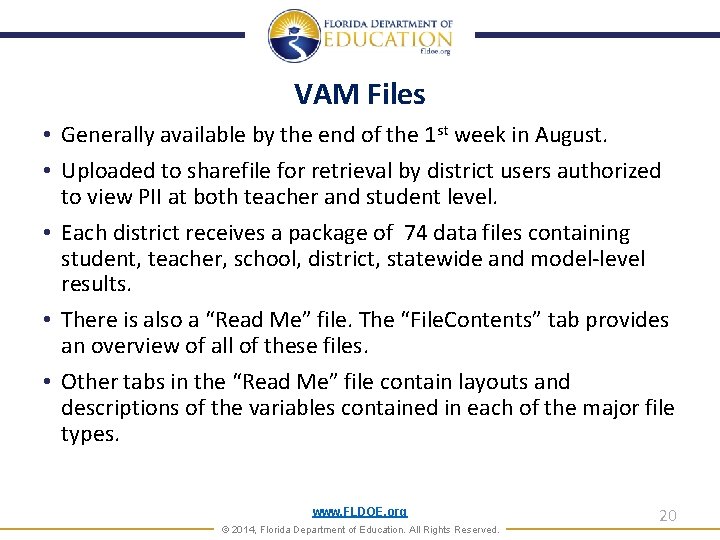
VAM Files • Generally available by the end of the 1 st week in August. • Uploaded to sharefile for retrieval by district users authorized to view PII at both teacher and student level. • Each district receives a package of 74 data files containing student, teacher, school, district, statewide and model-level results. • There is also a “Read Me” file. The “File. Contents” tab provides an overview of all of these files. • Other tabs in the “Read Me” file contain layouts and descriptions of the variables contained in each of the major file types. www. FLDOE. org © 2014, Florida Department of Education. All Rights Reserved. 20
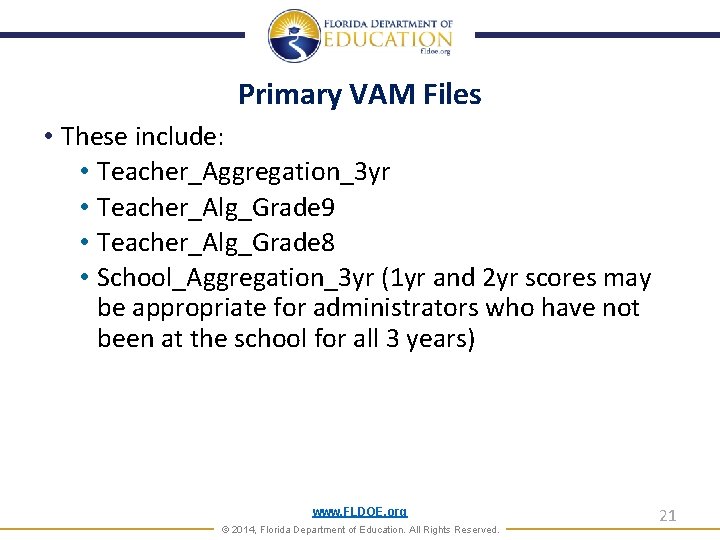
Primary VAM Files • These include: • Teacher_Aggregation_3 yr • Teacher_Alg_Grade 9 • Teacher_Alg_Grade 8 • School_Aggregation_3 yr (1 yr and 2 yr scores may be appropriate for administrators who have not been at the school for all 3 years) www. FLDOE. org © 2014, Florida Department of Education. All Rights Reserved. 21
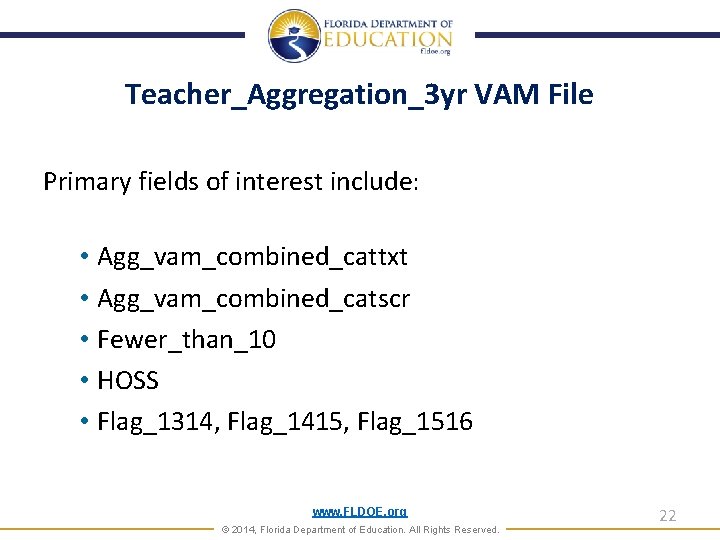
Teacher_Aggregation_3 yr VAM File Primary fields of interest include: • Agg_vam_combined_cattxt • Agg_vam_combined_catscr • Fewer_than_10 • HOSS • Flag_1314, Flag_1415, Flag_1516 www. FLDOE. org © 2014, Florida Department of Education. All Rights Reserved. 22
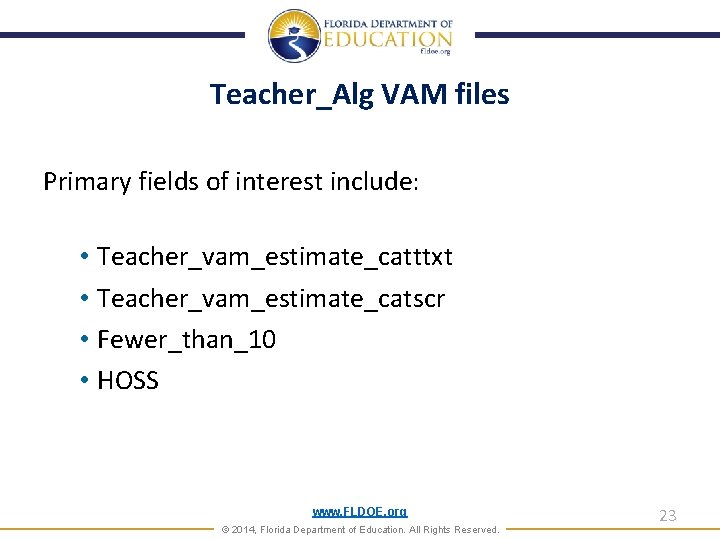
Teacher_Alg VAM files Primary fields of interest include: • Teacher_vam_estimate_catttxt • Teacher_vam_estimate_catscr • Fewer_than_10 • HOSS www. FLDOE. org © 2014, Florida Department of Education. All Rights Reserved. 23
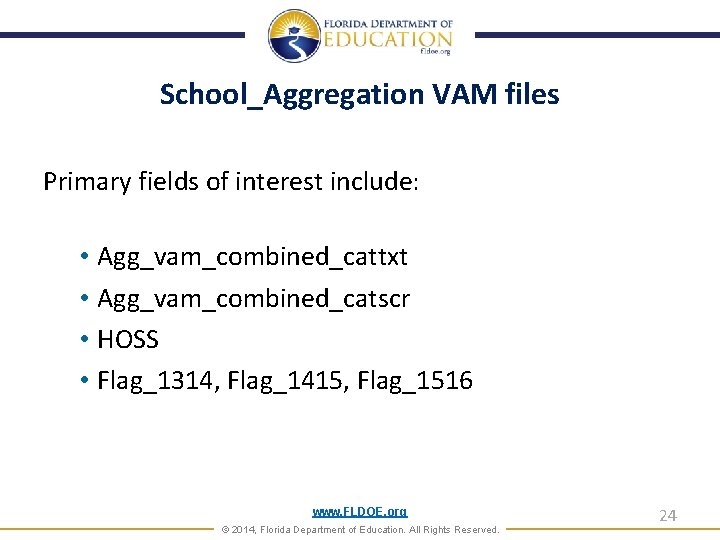
School_Aggregation VAM files Primary fields of interest include: • Agg_vam_combined_cattxt • Agg_vam_combined_catscr • HOSS • Flag_1314, Flag_1415, Flag_1516 www. FLDOE. org © 2014, Florida Department of Education. All Rights Reserved. 24
After reviewing if you still have questions about how to use these files, Call (850) 245 - 0411 or email VAM@fldoe. org www. FLDOE. org © 2014, Florida Department of Education. All Rights Reserved. 25
Model Performance & Results www. FLDOE. org © 2014, Florida Department of Education. All Rights Reserved. 26
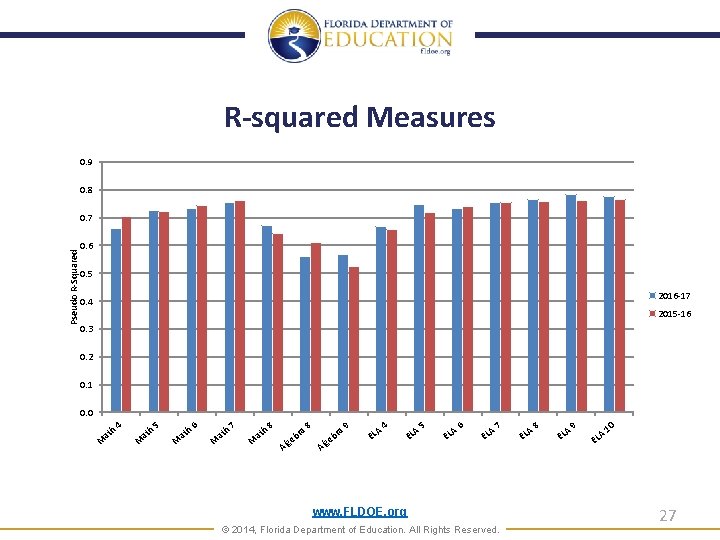
R-squared Measures 0. 9 0. 8 Pseudo R-Squared 0. 7 0. 6 0. 5 2016 -17 0. 4 2015 -16 0. 3 0. 2 0. 1 0. 0 h 4 M at M h 5 at M h 6 at M h 7 at M h at 8 ra A b lge 8 ra b lge A 9 A EL 4 A EL 5 A EL 6 A EL 7 www. FLDOE. org © 2014, Florida Department of Education. All Rights Reserved. A EL 8 A EL 9 A EL 10 27
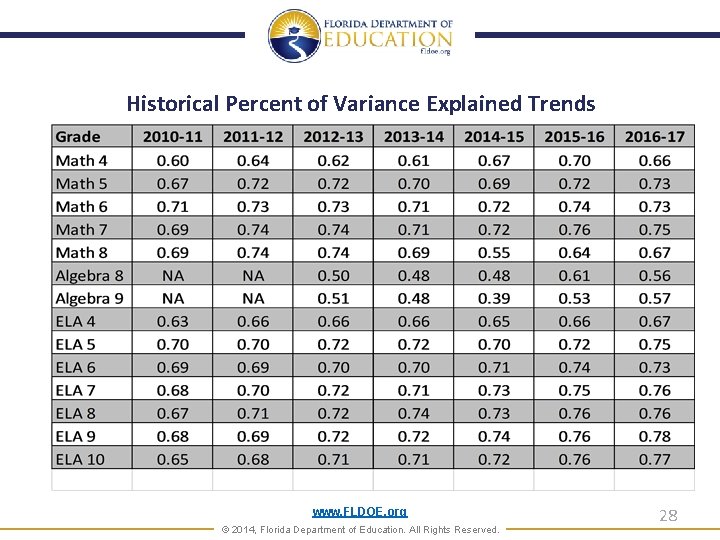
Historical Percent of Variance Explained Trends www. FLDOE. org © 2014, Florida Department of Education. All Rights Reserved. 28
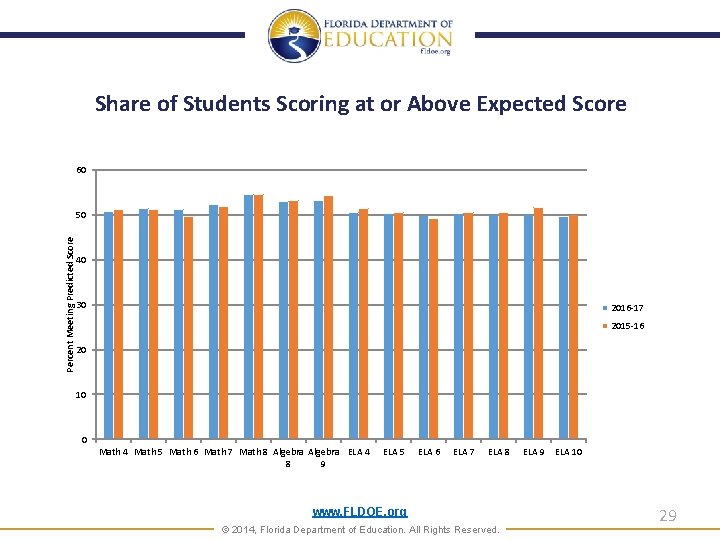
Share of Students Scoring at or Above Expected Score 60 Percent Meeting Predicted Score 50 40 30 2016 -17 2015 -16 20 10 0 Math 4 Math 5 Math 6 Math 7 Math 8 Algebra ELA 4 8 9 ELA 5 ELA 6 ELA 7 ELA 8 www. FLDOE. org © 2014, Florida Department of Education. All Rights Reserved. ELA 9 ELA 10 29
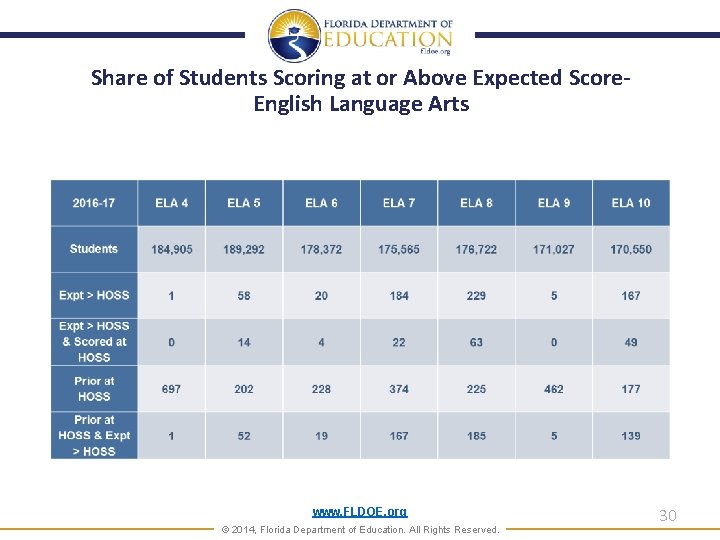
Share of Students Scoring at or Above Expected Score. English Language Arts www. FLDOE. org © 2014, Florida Department of Education. All Rights Reserved. 30
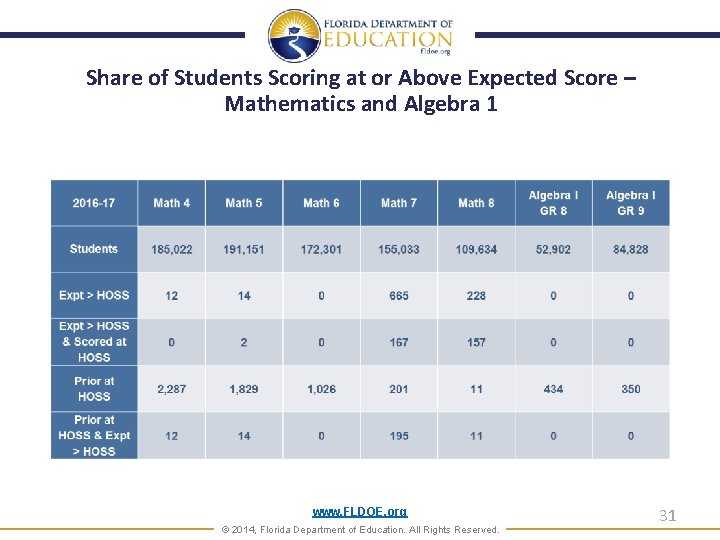
Share of Students Scoring at or Above Expected Score – Mathematics and Algebra 1 www. FLDOE. org © 2014, Florida Department of Education. All Rights Reserved. 31
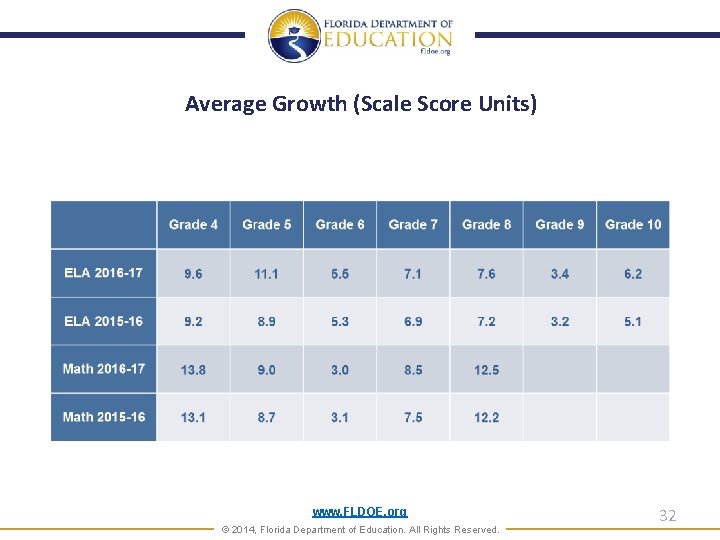
Average Growth (Scale Score Units) www. FLDOE. org © 2014, Florida Department of Education. All Rights Reserved. 32
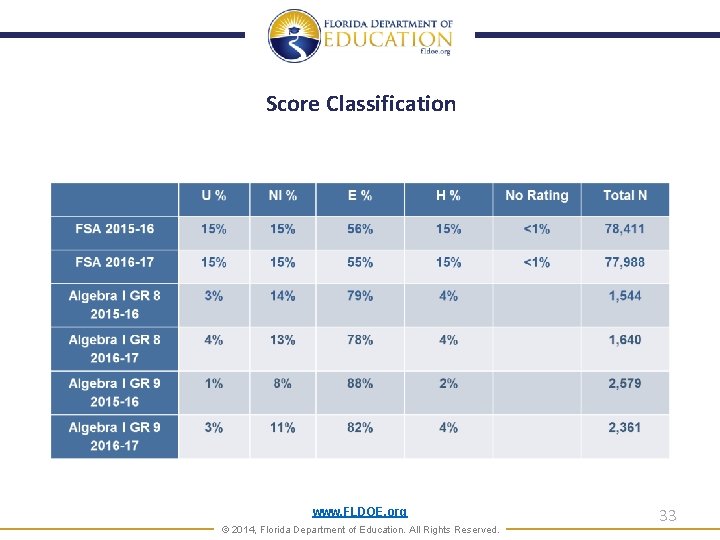
Score Classification www. FLDOE. org © 2014, Florida Department of Education. All Rights Reserved. 33
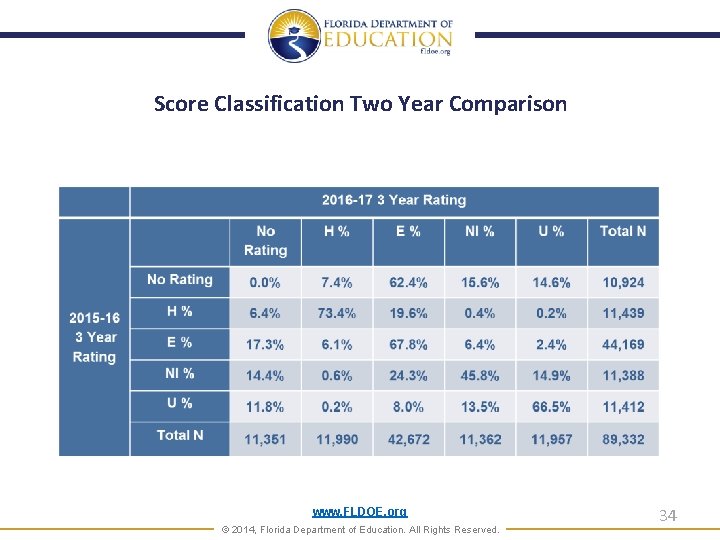
Score Classification Two Year Comparison www. FLDOE. org © 2014, Florida Department of Education. All Rights Reserved. 34
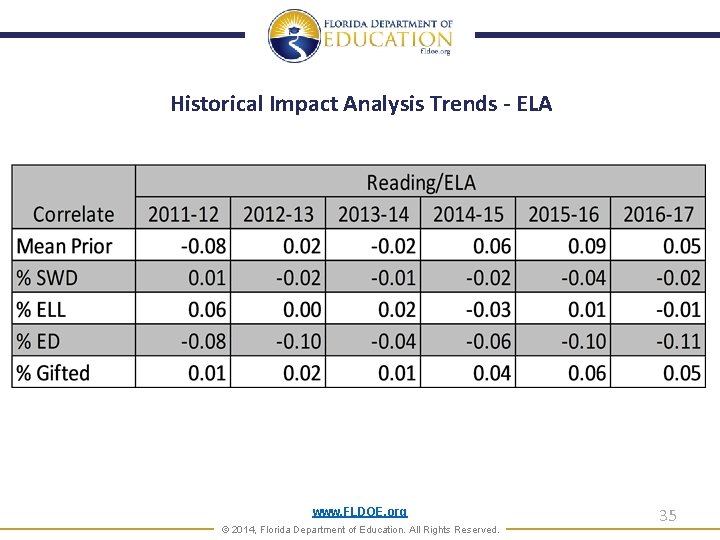
Historical Impact Analysis Trends - ELA www. FLDOE. org © 2014, Florida Department of Education. All Rights Reserved. 35
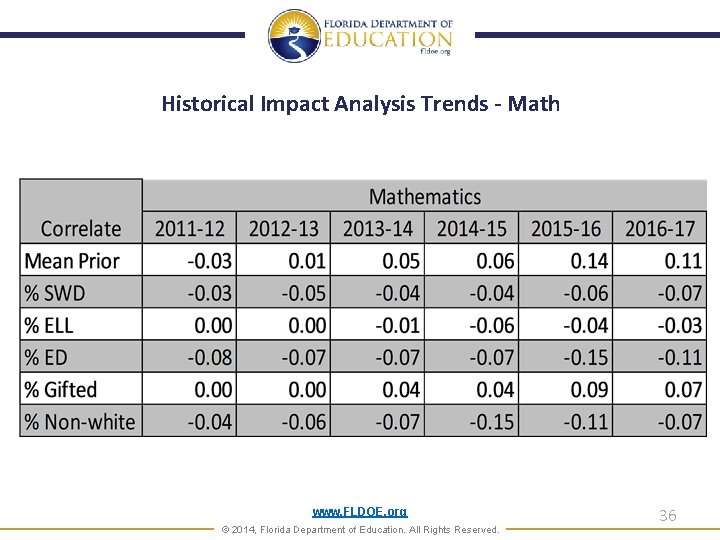
Historical Impact Analysis Trends - Math www. FLDOE. org © 2014, Florida Department of Education. All Rights Reserved. 36
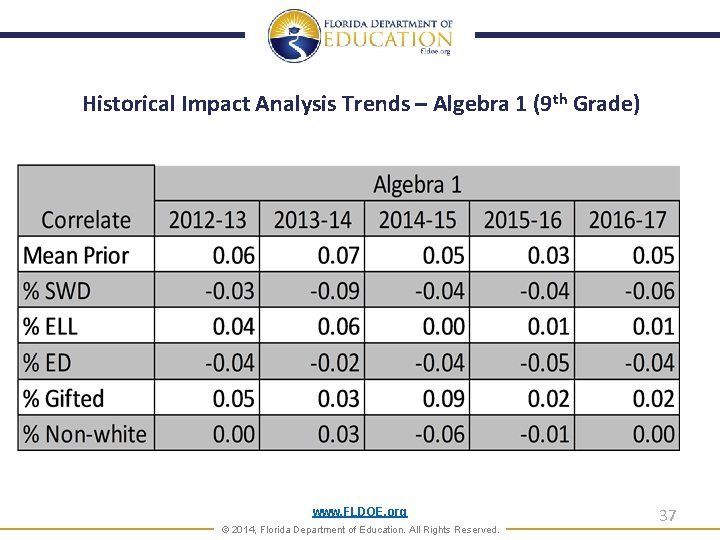
Historical Impact Analysis Trends – Algebra 1 (9 th Grade) www. FLDOE. org © 2014, Florida Department of Education. All Rights Reserved. 37
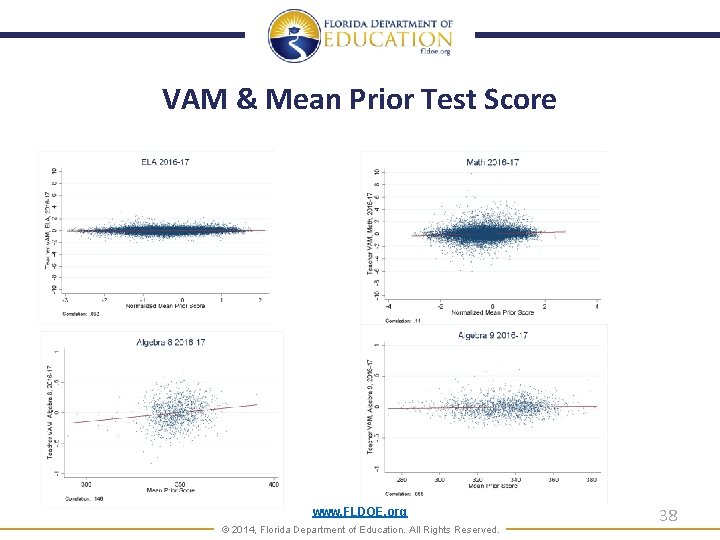
VAM & Mean Prior Test Score www. FLDOE. org © 2014, Florida Department of Education. All Rights Reserved. 38
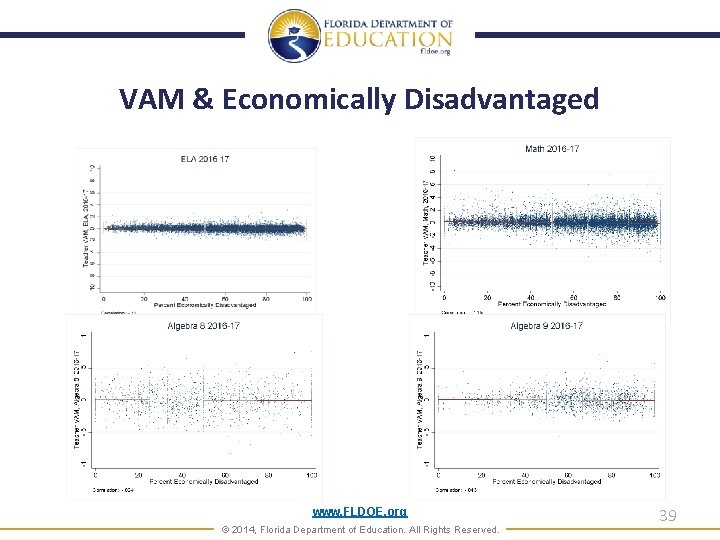
VAM & Economically Disadvantaged www. FLDOE. org © 2014, Florida Department of Education. All Rights Reserved. 39
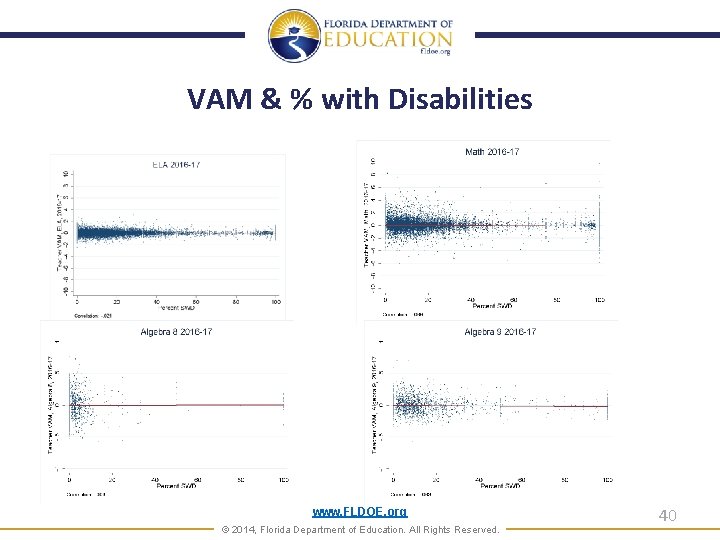
VAM & % with Disabilities www. FLDOE. org © 2014, Florida Department of Education. All Rights Reserved. 40
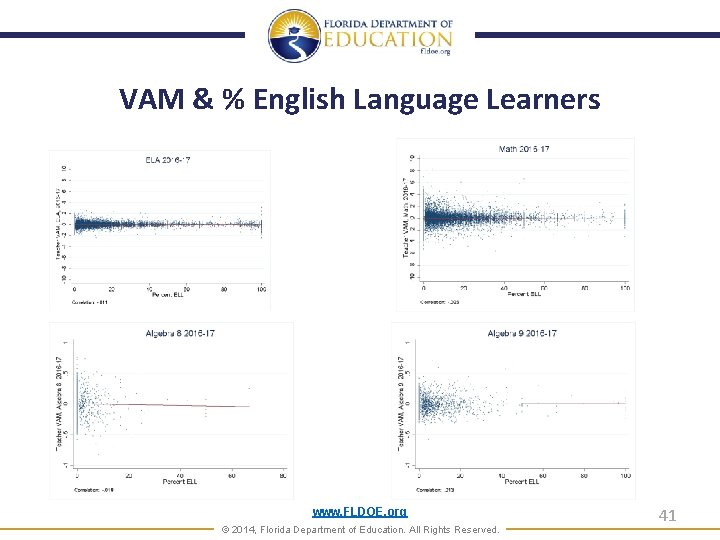
VAM & % English Language Learners www. FLDOE. org © 2014, Florida Department of Education. All Rights Reserved. 41
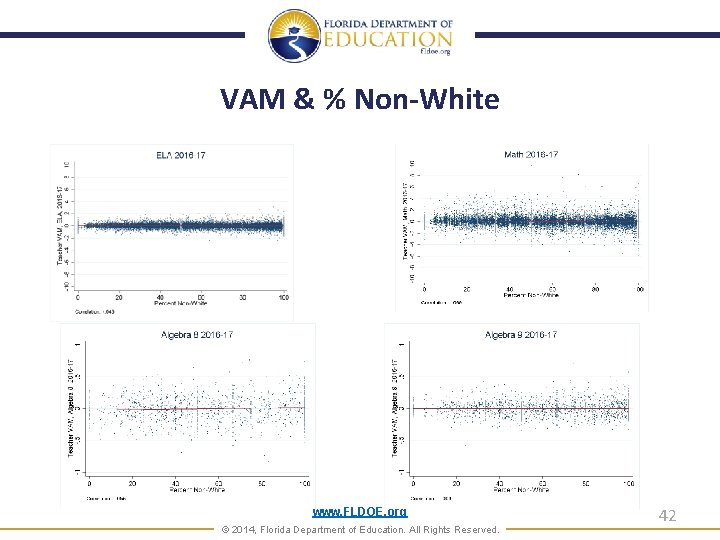
VAM & % Non-White www. FLDOE. org © 2014, Florida Department of Education. All Rights Reserved. 42
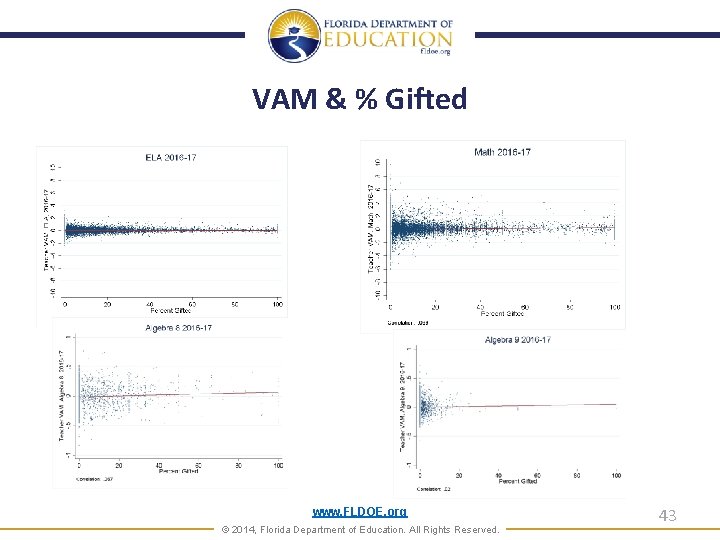
VAM & % Gifted www. FLDOE. org © 2014, Florida Department of Education. All Rights Reserved. 43
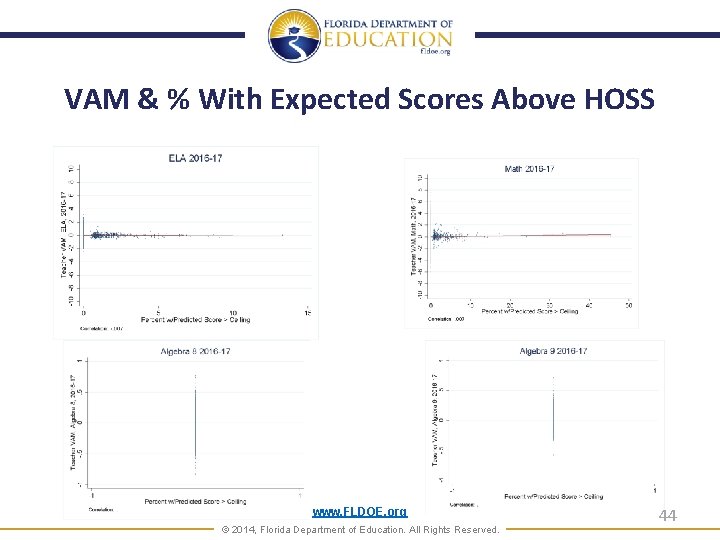
VAM & % With Expected Scores Above HOSS www. FLDOE. org © 2014, Florida Department of Education. All Rights Reserved. 44
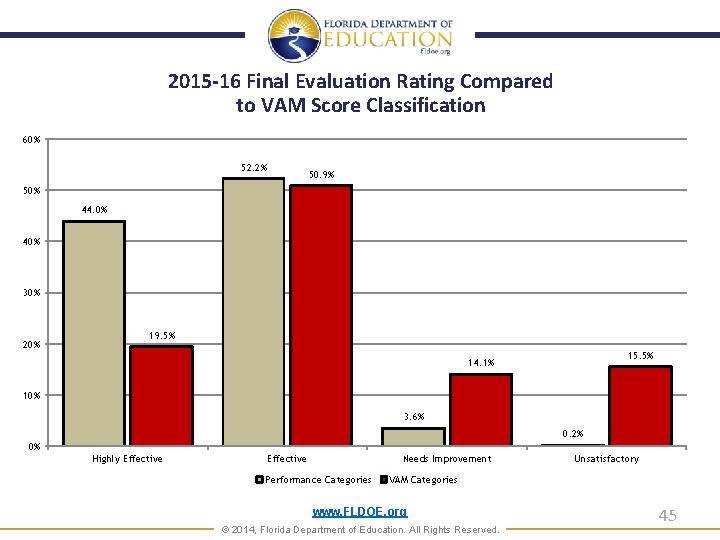
2015 -16 Final Evaluation Rating Compared to VAM Score Classification 60% 52. 2% 50. 9% 50% 44. 0% 40% 30% 20% 19. 5% 15. 5% 14. 1% 10% 3. 6% 0. 2% 0% Highly Effective Needs Improvement Performance Categories Unsatisfactory VAM Categories www. FLDOE. org © 2014, Florida Department of Education. All Rights Reserved. 45
www. FLDOE. org https: //app 1. fldoe. org/rules/default. aspx OR ARM@fldoe. org www. FLDOE. org © 2014, Florida Department of Education. All Rights Reserved. 46