Value Stream Mapping VSM 2013 ZOGG All rights
 价值流程图 © 2013 ZOGG All rights reserved. 1")


 is a hand-drawn map that")


 Ø Collect data from the production")


 – 5 S")


 Lean VSM Characters(Check List) 1. Arrange production base on Tack time 按照节拍时间生产 –")
 Lean VSM Characters(Check List) 3. “Where will you need to use supermarket pull")

 8. “What process improvements will be")


 行动计划及优先等级 ACTION ITEM LIST 1 Checklist for site survey 2")


- Slides: 55
Value Stream Mapping (VSM) 价值流程图 © 2013 ZOGG All rights reserved. 1
What’s Lean 什么是精益生产 q Philosophy NOT a program q Thinking Not flavor q Toolkit Not a campaign q Practice q Journeys q Life Lean is a philosophy where waste is identified continuously and eliminated passionately. Waste is any activity (or inactivity) that consumes resources for which the customer is not willing to pay. © 2013 ZOGG All rights reserved.
3 Level of Lean 精益生产的三个层次 Hands - on Refered Heard © 2013 ZOGG All rights reserved.
Principles Of Lean 精益生产 5原则 5 Customer defines VALUE 4 Identify the VALUE STREAM(and eliminate 8 wastes) Establish Make value-creating steps FLOWPull 3 Let customer PULL product from you as needed Create Flow people who add Pursue PERFECTION (empower 2 value) Lean Capability Ø Ø Ø Pursue Perfection 1 Map The Value Identify Value Time © 2013 ZOGG All rights reserved.
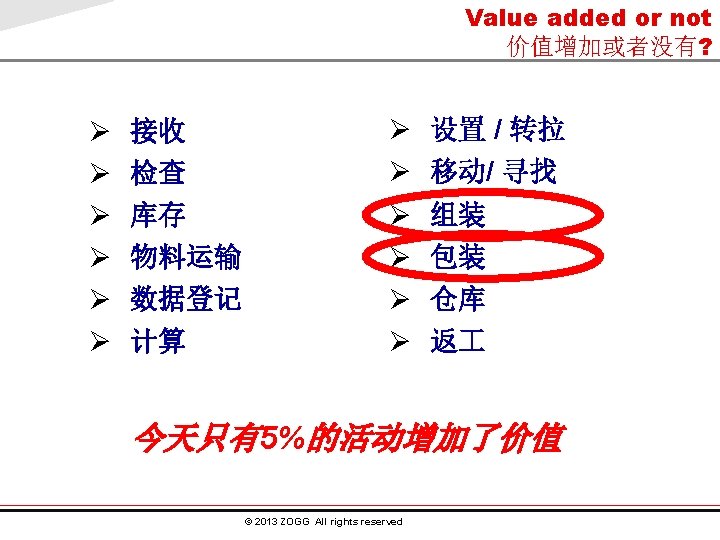
Value Added vs. Non-Value Added 增值与非增值的定义 q Value Added增值 Any activity that increases the market form or function of the product or service. (These are things the customer is willing to pay for. ) 任何增加市场或产品和服务的功能或市场形式的活动(客户愿 意为此付费的活动) q Non-Value Added Any activity that does not add market form or function or is not necessary. (These activities should be eliminated, simplified, reduced or integrated. ) 任何不增加市场或产品和服务的功能(这些活动应当消除,简 化,减少或合并) © 2013 ZOGG All rights reserved.
What is waste 什么是浪费 浪费是…. u Waste is anything that does not directly add value to the final product or contribute to the product’s transformation. 浪费是指对最终成品不直接增值或产品的转变不作贡献的 任何东西。 u Waste only adds time and cost, no value. 浪费只增加时间 和成本,不增加价值。 u Waste is the reason that product flow stops and is the cause for non competitiveness. 生产流动的停止是造成浪 费的原因,浪费是缺乏竞争性的根源。 © 2013 ZOGG All rights reserved.
7 Functional Wastes of Lean 精益思想中的七种功能性浪费 OVERPRODUCTION TRANSPORTATION INVENTORY 7 Wastes WAITING MOTION EXTRA PROCESSING © 2013 ZOGG All rights reserved. DEFECTS No way! UNUSED CREATIVITY
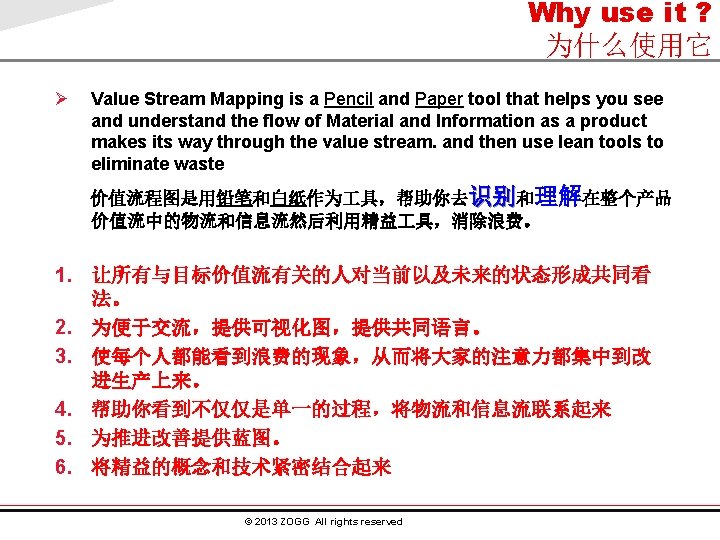
Value Stream Definition 价值流的定义 A Value Stream Map (VSM) is a hand-drawn map that helps people to see and understand process, material and information flow through a production process or value stream, from start to finish. © 2013 ZOGG All rights reserved.
Value Stream Mapping 价值流图 What we mean by Value Stream Mapping is simple: 我们所说的价值流图是很简单的: 1. Follow a product’s production path from beginning to end (supplier to customer). 产品的生产路线从开始到结束(供应商到客户) 2. Carefully Draw a visual representation of every process in the material and information flow. 过程导向,把物流和信息流和用一种直观可视的方法仔细的表 现出来。 3. Then ask a set of questions and draw (using Icons) a “Future State” map of how value should flow. 然后问一系列问题,用图标画在指明价值流动的将来价值流图 © 2013 ZOGG All rights reserved.
Blocks of Value Stream Map 价值流图的5大板块 30 Days Supplier Loop Customer Loop Takt Time = 440 min/44 = 10 min/unit Information Bi. Monthly 880 Monthl y Orders MRP Manufacturing Loop 45 Days Op 1 1 Day 1 1. 6 2 Days S/U = 0. 08 hr CT = 0. 9 min S/U = 1 hr CT = 1. 6 min 45 Op 2 Op 3 S/U = 0. 08 hr CT = 0. 9 min 2 0. 9 2 Days Op 4 1 Day S/U = 0 CT = 60 min 2 0. 9 60 5 Days S/U = 0. 08 hr CT = 1. 2 min 1 Lead Time Data Bar © 2013 ZOGG All rights reserved. Op 5 S/U = 1. 95 hr CT = 40. 3 min 5 1. 2 1 Day Op 6 1 40. 3 Total = 57 Days Total = 1 Hr. 44. 9 Min.
VSM Kaizen Steps 价值流图改善的步骤 Step 1: Mapping Current VSM。 绘制当前价值流图 1. 1: Understand Current Statecustomer demand 理解客户的需求 Future State 1. 2: Process flow and data box 序流数据箱 - Quick identify main process (in order) 迅速的识别主要的过程(按次序) - Fill in data boxes填写数据箱 1. 3: Map the material flow 画出物料流及库存三角 - Draw inventory triangles库存三角 - Delivery to customer 产品投递给客户 - Delivery from suppliers供应商投递原材料 1. 4: Map the information flow 画出信息流 Action Plan - How do processes know what to make? 怎么知道要做什么? - Where is material being pushed? 哪儿推动物料? (Kaizen Events) 1. 5: Calculate Total Product Cycle Time 计算产品生产周期 Step 2:Discover kaizen opportunities, Burst point list. 寻找改善机会,绘制爆炸点 Step 3:mapping Future VSM,绘制将来价值流图 Step 4:Develop and follow action plan。 制定改善行动计划 © 2013 ZOGG All rights reserved.
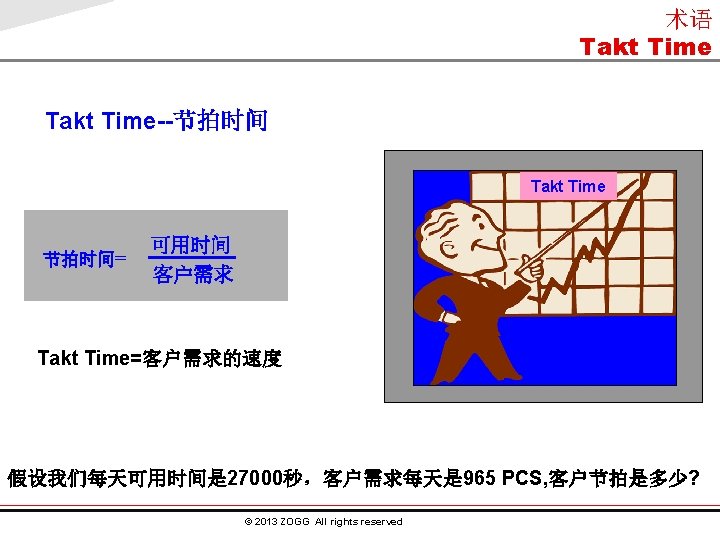
Demand 客户需求 Step 1. 1: Understand customer demand 理解客户需求 Ø Sources for customer data客户数据的来源 – Plan for Every Part (PFEP)每个零件的计划 – Budgeted volumes 预算的产量 – Production Control forecasts生产控制预测 Analyze variation (daily, weekly, monthly…) 分析变化(每日,每周,每月) – Production history 生产历史 • Analyze variation (daily, weekly, monthly…) 分析变化(每日,每周,每月) – Sales information databases销售信息数据库 • Product changes, new business opportunities 产品改变,新的业务机会 © 2013 ZOGG All rights reserved. CUSTOMER 20, 000 pcs. / mo. Std. Pack = 300 Shift: 2 Shifts Output: 400/Shift Working Hrs: 8 hrs Takt = 72 sec.
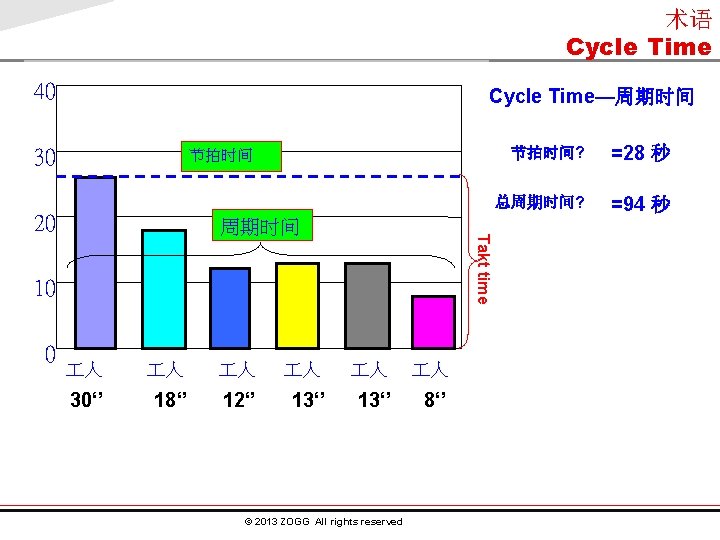
术语 L/T VAT L/T – Cycle Time is the time it takes an operator to go through all of their work elements before repeating them. Also, it is the time between parts coming off the end of the process (eg, drop-rate from a cell). 周期时间(C/T):一个零件或产品在一个过程中需多久被完 成 – Value Added Time is the time of those work elements that actually transform the product in a way the customer is willing to pay for. 产品所经历的实体的变化所耗用的顾客愿意为之买单的时间 – Lead Time is the time it takes one piece to move all the way through a process or a value stream, from start to finish (dock to dock). – 前置期-在价值流或全过程从开始到完成一个产品所需的时间。 © 2013 ZOGG All rights reserved.
VSM Current State 价值流图当前状态 Step 1. 2 - Process flow and data box 序流数据箱 Ø Walk the process走过整个过程 – Don’t rely on what you think is happening, find out what is really happening – 不要依赖你想的,找出事情实际是怎样。 – Record physical data about the process – 记录过程的物理数据 Ø List out the individual steps in the process 列出过程中的每个步骤 Ø In the process use arrows to designate the flow of material between each step 在过程中用箭号指出在每个步骤之间的物流 © 2013 ZOGG All rights reserved.
VSM Current State 价值流图当前状态 Map the Process Flow画出流程图(产品生产过程) Ø Collect data from the production floor 从生产线收集数据 Customer Part A = 1000/wk Part B = 500/wk Part C = 500/wk (400 pcs/day) Stamping C/T = 4 sec #mach = 1 uptime = 85% #shifts = 2 C/O = 1 hr Shipping © 2013 ZOGG All rights reserved.
Information for a Process Data Box 数据箱中的信息 1 Line 生产单元拉数 2 HC/Line Head. Count,人员配置 3 UPH Unit Per Hour,每小时班产 4 FPY 一次通过率 5 Scrap Rate 报废率,因无法修理而导致报废的概率 6 C/T Cycle Time,循环时间 7 VAT 增值时间 8 C/O Change Over Time,换型时间 9 Batch Size 投入产生产的最小批量数 10 Up time(%) 有效利用时间率 © 2013 ZOGG All rights reserved.
VSM Current State 价值流图当前状态 Step 1. 3: Map the Material Flow 画出物料流图 Ø Identify raw material receipt area on map 识别物料接收处 Ø Determine amount of raw material inventory on hand for product family selected: Days/shifts on hand 确定选择的产品族的存货数量:每天/班在手库存 Ø Identify how material moves through process: Push or Pull 识别物料如何在过程中移动:推动或拉动 © 2013 ZOGG All rights reserved.
VSM Current State 价值流图当前状态 Step 1. 3: Map the Material Flow画出物料流图 Customer Suppliers Weekly Stamping 8 Days Coils C/T = 4 sec #mach = 1 uptime = 85% #shifts = 2 C/O = 1 hr Daily Saw Cutting Part A = 1000/wk Part B = 500/wk Part C = 500/wk (400 pcs/day) 10 Days 1600 Bar Stock #mach = 2 pcs/ cycle = 1 C/T = 120 sec C/O = 0 uptime = 90% PCT = 60 sec APCT = 66. 7 sec yield = 99% 800 Weekly Washing Welding 1800 #mach = 1 pcs/ cycle = 60 C/T = 360 sec C/O = 0 uptime = 80% PCT = 6 sec APCT = 7. 5 sec shifts = 2 2800 C/T = 65 -73 sec C/O = 1 hr uptime = 90% yield = 90% #operator = 1 © 2013 ZOGG All rights reserved. Subassembly C/T = 60 sec C/O = 0 uptime = 95% yield = 99% #operator = 2 900 Final Assembly C/T = 62 -66 sec C/O = 5 min uptime = 95% yield = 85% #operator = 1 Shipping 2800
VSM Current State 价值流图当前状态 Step 1. 4: Map the Information Flow 将信息流画出 6 Week Forecast 30/60/90 Day Forecasts Production Control Suppliers Weekly Fax MRP Weekly Schedule Weekly Daily Saw Cutting Part A = 1000/wk Part B = 500/wk Part C = 500/wk (400 pcs/day) Stamping 8 Days Coils C/T = 4 sec #mach = 1 uptime = 85% #shifts = 2 C/O = 1 hr 1600 10 Days Bar Stock #mach = 2 pcs/ cycle = 1 C/T = 120 sec C/O = 0 uptime = 90% PCT = 60 sec APCT = 66. 7 sec yield = 99% 800 Weekly Washing Welding 1800 #mach = 1 pcs/ cycle = 60 C/T = 360 sec C/O = 0 uptime = 80% PCT = 6 sec APCT = 7. 5 sec shifts = 2 Customer Daily Orders 2800 C/T = 65 -73 sec C/O = 1 hr uptime = 90% yield = 90% #operator = 1 © 2013 ZOGG All rights reserved. Subassembly C/T = 60 sec C/O = 0 uptime = 95% yield = 99% #operator = 2 900 Final Assembly C/T = 62 -66 sec C/O = 5 min uptime = 95% yield = 85% #operator = 1 Shipping 2800
VSM Current State 价值流图当前状态 Step 1. 5: Calculate Total Production Lead time计算产品生产周期 Ø Draw a “stepped line” at the bottom of the map 在底部画出阶梯图 Ø Under each inventory location, list the days/shifts on hand 在存货处,列出多少天的库存在手 © 2013 ZOGG All rights reserved.
VSM Current State 价值流图当前状态 Step 1. 5: Calculate Total Product cycle time计算产品生产周期 Ø On the right hand side of the chart: 在价值流图右下侧: – Calculate the Value Created Time by adding all the cycle times 计算价值增值时间 – Calculate the Total Production Lead Time by adding the Inventory on hand quantities and the Cycle times – 计算总的生产提前期 Ø Determine the “Opportunity Time” 确定机会时间 © 2013 ZOGG All rights reserved.
VSM Current State 价值流图当前状态 Step 1. 5 : Calculate Total Product cycle time计算产品生产周期 6 Week Forecast 30/60/90 Day Forecasts Production Control Suppliers Weekly Fax Daily Orders MRP Weekly Schedule Weekly Part A = 1000/wk Part B = 500/wk Part C = 500/wk (400 pcs/day) Stamping 800 8 Days Coils C/T = 4 sec #mach = 1 uptime = 85% #shifts = 2 C/O = 1 hr Customer Path 1 Daily Saw Cutting Washing 1600 10 Days Bar Stock #mach = 2 pcs/ cycle = 1 C/T = 120 sec C/O = 0 uptime = 90% PCT = 60 sec APCT = 66. 7 sec yield = 99% Path 2 10 Days Welding 1800 #mach = 1 pcs/ cycle = 60 C/T = 360 sec C/O = 0 uptime = 80% PCT = 6 sec APCT = 7. 5 sec shifts = 2 4 Days 120 Secs Weekly 2800 C/T = 65 -73 sec C/O = 1 hr uptime = 90% yield = 90% #operator = 1 4. 5 Days 360 Secs Subassembly C/T = 60 sec C/O = 0 uptime = 95% yield = 99% #operator = 2 7 Days 65 -73 Secs © 2013 ZOGG All rights reserved. 900 Shipping 2800 C/T = 62 -66 sec C/O = 5 min uptime = 95% yield = 85% Path 1 = #operator = 1 8+2+7+2. 3+7 =26. 3 Path 2 = 10+4+4. 5+7+2. 3+7=34. 8 2. 3 Days 120 Secs Final Assembly Lead Time 7 Days = 34. 8 days Processing Time 62 -68 Secs = 727 -741 secs
Creative Thinking 创造性思维 Ø Creativity is about breaking down prior assumptions and making new connections for new ideas. Ø At the foundation of the creative process are three major principles: – Separate idea generation from evaluation – Challenge assumptions – Break and make connections – Avoid groupthink © 2013 ZOGG All rights reserved.
Lean Tools Deployment By Loop Ø Loop 1 (create continuous flow) – 5 S – Continuous Flow Manufacturing – Total Productive Maintenance – Set-up Reduction – Error Proofing – Standardized Work Ø Loop 2 (schedule customer demand) – Pull System (pitch) Ø Loop 3 (pull from shared resources and suppliers) – Pull System (kanban and FIFO) © 2013 ZOGG All rights reserved.
Completed Current State Map Loop 3 6 Week Suppliers Forecast 30/60/90 Day Forecasts Production Control Weekly Fax MRP Part A = 1000/wk Part B = 500/wk Part C = 500/wk (400 pcs/wk) Weekly Schedule Weekly Stamping 800 8 Days Coils C/T = 4 sec #mach = 1 uptime = 85% #shifts = 2 C/O = 1 hr Daily Saw Cutting 10 Days 120 Secs Welding 1800 #mach = 1 pcs/ cycle = 60 C/T = 360 sec C/O = 0 uptime = 80% PCT = 6 sec APCT = 7. 5 sec shifts = 2 4 Days 2800 C/T = 65 -73 sec C/O = 1 hr uptime = 90% yield = 90% #operator = 1 4. 5 Days 360 Secs Weekly Loop 1 Washing 10 Days 1600 Bar Stock #mach = 2 pcs/ cycle = 1 C/T = 120 sec C/O = 0 uptime = 90% PCT = 60 sec APCT = 66. 7 sec yield = 99% Customer Daily Orders Subassembly C/T = 60 sec C/O = 0 uptime = 95% yield = 99% #operator = 2 7 Days 65 -73 Secs © 2013 ZOGG All rights reserved. Final Assembly 900 C/T = 62 -66 sec C/O = 5 min uptime = 95% yield = 85% #operator = 1 2. 3 Days 120 Secs Shipping 2800 Loop 2 Lead Time 7 Days = 34. 8 days Processing Time 62 -68 Secs = 727 -741 secs
Value Stream States & Questions 价值流的状态&疑问 © 2013 ZOGG All rights reserved.
精益价值流的特征(提问) Lean VSM Characters(Check List) 1. Arrange production base on Tack time 按照节拍时间生产 – 对意外问题作出的快速反应 – 消除意外故障的原因 – 降低下游 装配 序的换模时间 2. Connect process by one-piece flow as possible as you can 尽可能创建连续流 – How can you flow with maximum velocity (EPED) within each process? – 如何在每个过程以最大速度流动 © 2013 ZOGG All rights reserved.
精益价值流的特征(提问) Lean VSM Characters(Check List) 3. “Where will you need to use supermarket pull systems? ” 在连续流程无法向上游扩展时,建立超市超市拉动系统 – Does each “customer” pull from its supplier? – 每个客户都从供应商处拉动吗? 4. “At what single point in the production chain will you schedule production? ”下达订单到一个点 选择定拍 序 © 2013 ZOGG All rights reserved.
Future State Questions 未来状态问题 5. “How will you level the production mix? ” 你如何平衡混合式生产(是否在定拍 序,均衡地安排多种产品的生产); Is final customer demand (ordering if build to order or buying if build to inventory) level? 最终客户的需求是稳定的吗? – Does/can the final build sequence match actual demand? 最终生产顺序与实际需求匹配吗? – Does/can the build sequence match operations’ capability? 生产顺序与运作能力匹配吗? 6. Release production requirement lowly & consistently release and take away? ” 持续地向定拍 序下达小批量的生产指令; – Are you or can you use milk run logistics? 你能使用无风险供应吗? © 2013 ZOGG All rights reserved.
Future State Questions 未来状态问题 7. 在定拍 序的上游,开发每天生产每种零件的能力 (希望到每班、每小时、每个托盘) 8. “What process improvements will be necessary? ” 还有什么过程改进是需要来提高快速响应的速度及生产的稳定性? – Can every process in the value stream build Every Product Every Day? 价值流的每个过程每天都能生产每一种产品吗? – Where can you reduce inventory to cut lead time? 哪里你能降低库存以减少提前期 § § 1. Cut WIP first, then先减少在制品,然后 2. Raw Material, then原材料,然后 3. Finished Goods成品 4. SMED 快速换型 – Overwhelming process improvement need illustrated by Value Stream Mapping. 强制性的过程改善应在价值流程图中表示 – Fix the Information system!搞定信息系统 © 2013 ZOGG All rights reserved.
Example–Current State VSM 当前价值流诊断例 6 Week Suppliers Forecast 30/60/90 Day Forecasts Production Control Weekly Fax Daily Orders MRP Weekly Schedule Weekly 800 Path 1 Daily Saw Cutting Path 2 Welding 1800 #mach = 1 pcs/ cycle = 60 C/T = 360 sec C/O = 0 uptime = 80% PCT = 6 sec APCT = 7. 5 sec shifts = 2 4 Days 120 Secs U-Shape Flow Cell Washing 10 Days 1600 Bar Stock #mach = 2 pcs/ cycle = 1 C/T = 120 sec C/O = 0 uptime = 90% PCT = 60 sec APCT = 66. 7 sec yield = 99% 10 Days Part A = 1000/wk Part B = 500/wk Part C = 500/wk (400 pcs/day) Stamping 8 Days Coils C/T = 4 sec #mach = 1 uptime = 85% #shifts = 2 C/O = 1 hr 2800 C/T = 65 -73 sec C/O = 1 hr uptime = 90% yield = 90% #operator = 1 4. 5 Days 360 Secs Customer Subassembly C/T = 60 sec C/O = 0 uptime = 95% yield = 99% #operator = 2 7 Days 65 -73 Secs © 2013 ZOGG All rights reserved. Weekly 900 Shipping 2800 C/T = 62 -66 sec C/O = 5 min uptime = 95% yield = 85% Path 1 = #operator = 1 8+2+7+2. 3+7 =26. 3 Path 2 = 10+4+4. 5+7+2. 3+7=34. 8 2. 3 Days 120 Secs Final Assembly Total Lead Time 7 Days = 34. 8 days Total VA Time 62 -68 Secs = 727 -741 secs
Example–Current State VSM 当前价值流诊断例 Process Boxes Kaizen Bursts Pink makes it easy to see inventory in the process © 2013 ZOGG All rights reserved.
A Plan to Get There 到达目标的计划 Plan and Ø Don’t Wait Implementation 不要等待 Ø To “manage the exceptions” you need to plan 为了‘达到期望’,你需要计划。 – Tie into business objectives和业务目标紧密结合 – Break your future state into “loops”将未来状态分成几个圈 – Make a VS Plan: What to do by when什么时候做什么 – Now relate the FS Map to your layout将未来状态图与你的布局 图联系起来 – VS Manager completes VS Review form in advance价值流经 理完成价值流评估表 – Conduct VS Reviews walking the flow沿着流程评估价值流 © 2013 ZOGG All rights reserved.
Suggest 提示 Ø Challenges挑战 – Distinction between flow of material and flow of information 物流和信息流的差别 • Information moves with material信息和物流一起流动。 • Try to use them all anyway尽量使用所有的概念 § Takt time, Flow, Pull, Triggers, etc. 节拍,流,拉动,触发 Ø Data boxes数据盒 – What data is important? 什么数据是重要的 – Group needs to decide this 小组必须作出决定 © 2013 ZOGG All rights reserved.
Value Stream States 价值流的状态 To Complete the Cycle, It Helps to Understand the Past and Envision the Future 完成全部状态图会帮助理解过去和想象未来 Ø Current state (where you are now) 当前状态(你在那里) Ø Future state (where you can be in 3 months, or at least this year) 未来状态(3个月后或至少今年内会在哪里) Ø Ideal state ( = all value & no muda, a North Star!) 理想状态 (指南针) © 2013 ZOGG All rights reserved.
Implementation via Kaizen 通过改善来提高 Future State Map 未来状态图 Eraser橡皮擦 Process Point Kaizen 指出改善点 Value Stream Manager 价值流经理 © 2013 ZOGG All rights reserved.
Action Plan and Priority(Example) 行动计划及优先等级 ACTION ITEM LIST 1 Checklist for site survey 2 Sales to coordinate & initiate site visit to include vendors for quote WHO WHEN Impact on Business (1 -10) Bill House 5/15/2005 5 7 35 John Whitehead 5/15/2005 5 8 40 6/28/05 8 4 32 6/28/2005 9 5 45 6/28/05 8 4 32 Michael Wide 7/31/2005 10 2 20 Suzanne Weyer 6/28/2005 9 1 9 John Mc. Quillin 5/30/2005 9 7 63 John Whitehead 7/31/05 10 1 10 Dave Masek 6/28/05 6 3 18 10 = high impact 10 = easy to do 1 = low impact 1= difficult to do 3 Develop vendor scopes of work Bob Braun 4 Parts & material sourcing database John Whitehead Standardize and centralize 5 proposal templates & forms Standard pricing program with 6 standard labor units Communicate customer need for 7 more responsive legal review 8 Validate VSM with accurate data Develop a business case for 9 centralized quotations 10 Hand off checklist George Giben © 2013 ZOGG All rights reserved. Easy to Do Total (1 -10)
未来价值流 © 2013 ZOGG All rights reserved.
Value Stream Mapping Icons 价值流图图标 These are the standard Value Stream map flow icons. See the Index of Icons for a more detailed list. Value Stream Icons价值流图标 Customer/Supplier Marketplace 客户/供应商 市场 这些是标准的价值流图的图标 Process Step 流程步骤 Tugger Route 拖拉路线 Information Flow Icons 信息流图标 Material Flow(push) 物流(推动) Data Box 数据盒 Information Flow 信息流 Production Pull Signal Kanban Replenish Pull (to user) 信号看板 补充拉动(给使用者) Material Flow (pull) Electronic Info. Flow 物流(拉动) 电子信息流 生产拉动 Bulk Storage 大量储存 I Inventory 存货 © 2013 ZOGG All rights reserved.
Material Flow Icons 物流图标 Icon图标 Assembly Represents代表 Process 序框 Notes注释 One box equals an area of continuous flow. Label all processes. Also used for depts. Like production control 每个盒子等于连续流中的一个区域, 也用作表示部门,如生产控制 XYZ Corporation Outside Entities外部实体 Use to show customer, suppliers and external manufacturing processes 用来表示客户供应商和外部制造过 程 C/T = 45 sec. C/O = 30 min 3 shifts Data Box数据箱 2% Scrap 80% Uptime Used to record information concerning a manufacturing process, department, etc. 用来记录与制造过程,部门相关的 信息 Material Source: “Learning to See” Appendix A © 2013 ZOGG All rights reserved.
Material Flow Icons 物流图标 Icon Represents Notes Inventory 存货 I 数量和时间应当记录 300 Pieces, 1 day In Out Count and time should noted Supermarket Direction of legs indicate in and out 超市 方向表示进出 Buffer or safety stock 缓冲或安全库存 Buffer or safety stock must be noted on the drawings 缓冲或安全库存必须表示在图上 Truck Shipment Note frequency of shipments 卡车运输 表示运输的频率 © 2013 ZOGG All rights reserved.
Material Flow Icons 物流图标 Icon Max. 20 pcs FIFO Represents Notes Movement of Finished Goods 成品的运动 Also shows movement of raw material and components from suppliers 同时表示来自供应商的原材料和配件 “Push” material movement 推动物料运动 Identifies material pushed by the supplier not pulled by the consumer 识别由供应商推动的物料而不是由客户拉 动的。 Physical pull物理拉动 Pull of materials from a supermarket 从超市拉动物料 Transfer of controlled quantities of material between processes in a first in first out sequence用先进 先出的顺序转移控制数量 的物料 Indicates a device to limit quantity and ensure FIFO flow of material between processes. Max quantity should be indicated. Use downstream pacemaker processes only! 表示一个有数量限制的装置和确保先进先 出的物流,应当表示最大数量. 使用在向 下流动的带动过程 © 2013 ZOGG All rights reserved.
Material Flow Icons 物流图标 Icon Represents Notes Tugger route. Place symbol over the physical pull arrow line or the dotted withdrawal kanban line拖动路线,将该 符号放在物理拉动箭号线或 虚线拉动看板线上 Used for a motorized vehicle of some type to deliver materials on a timed sequenced route Hand cart route. Place symbol over the physical pull arrow line or the dotted withdrawal kanban line 手推车 Used for a hand powered vehicle of some type to deliver materials on time sequenced route. 用于手动的定时的顺序物料输送 Use only for current state 仅用于当前状态 © 2013 ZOGG All rights reserved. 用于机动的定时的顺序物料输送 Used only in a push environment 仅用于推动的环境
Information Flow Icons 信息流图标 Icon Represents Manual information flow 手 信息流 Notes Example: production schedule to shipping 例如: 出货生产排程 Example: EDI to suppliers例如: 与供应 Electronic information flow 商的电子数据交换 电子信息流 Weekly Schedule Captures information 获取的信息 “Go See” production scheduling 去看生产排程 © 2013 ZOGG All rights reserved. Used to describe an information flow 用来表示信息流 Adjusting scheduling based on checking inventory level. Not a true pull. Used in current state diagrams only 依据存货水平调整排程,不是真正的 拉动,仅用在当前状态图
Information Flow Icons 信息流图标 Icon Represents 20 20 Production Kanban (dotted line indicates Kanban flow. Also shows standard pack quantity 生产看板(虚线表示看板流,也 表示标准包装数 Withdrawal Kanban. Indicates standard pack quantity 拉动看板,也可表示标准包装数 Kanban (pull signal) post 看板(拉动信号)展示板 © 2013 ZOGG All rights reserved. Notes Tells a process how many of what can be produced and gives permission to do so 告诉一个生产过程可以生产 多少和允许这样做。 Tells how many of what can be withdrawn (from the supermarket) and gives permission to do so 告诉可以从超市中拉动多少 和允许这样做。 Place wherever Kanban are collected and held for return to sender 收集与返回看板给发送者的 收集点
Information Flow Icons 信息流图标 Icon Represents Signal kanban 信号看板 XOXOXO Notes Production kanban used with batch processing (ie molding) to signal when a re-order point has been reached and it is time to produce another batch 生产看板用于批量生产以给信号何 时再生产另一批 负荷平衡装置 Used to level the volume and mix of kanban over a specified period of time. Creates a repetitive sequencing of production of parts in pre-determined quantities of each 在一段特定时间内, 按一定的生产顺 序, 用于平衡混合看板生产负荷 Sequenced pull (ball or wheel)顺序拉动(球或轮 子) Used in fabrication processes to level load. Gives permission to produce a pre-determined quantity in sequence用于制造过程平衡负荷 Load leveling mechanism © 2013 ZOGG All rights reserved.
General Icons 通用图标 Icon Represents Operator操作员 Kaizen lightening burst 改善点 Notes Represents a person viewed from above 从上往下看 Highlights a critical improvement needs at specific processes. Indicates an area of critical need in the implementation process 显示在特定过程的关键改善点 © 2013 ZOGG All rights reserved.
General Icons 通用图标 Supermarket Kanban Path Production Kanban arriving in batches Withdrawal Kanban Withdrawal Signal Kanban Post Max. 50 pcs FIFO First-in first-out flow Changeover OXOX Leveling, mix and/or volume © 2013 ZOGG All rights reserved. Kaizen Lightening Burst
VSM绘制的规则 © 2013 ZOGG All rights reserved.