Value Chain Analysis of Calamansi citrus madurencis Phil
 Phil. DHRRA – LSFM Project June 8,")


 but")

 - 1997 Item Cost")
 Item Crate")
 Php 26, 000 (US $ 604) Production (/ha)")


 Price 2000 2001 2002 2003 2004 2005 Ave. Farmgate 11. 02 8.")

: 1. 2. 3.")


 Phil. DHRRA – LSFM Project June 8,")
- Slides: 19
Value Chain Analysis of Calamansi (citrus madurencis) Phil. DHRRA – LSFM Project June 8, 2008 Hanoi, Vietnam
Outline 1. 2. 3. 4. 5. 6. 7. Background of the Study Calamansi in Philippine context Production, Costs and Returns Trading and Marketing Prices The simple Value Chain Framework Next Steps
Background of the Study 1. 2. 3. 4. Part of the research component of the LSFM project Describe the market chain and chain actors involved Understand the dynamics in the calamansi market Limited to Phase 1 of the VCA only
Calamansi in Philippine Context 1. 2. 3. 4. 5. One of the major fruit crops and is excellent source of Vitamin C Sold as fresh product to markets and commercial buyers Processed into syrups, juices, concentrates, powder and purees, and has many medicinal uses Has contributed to agricultural export market, but not a major export crop Major source is Central Philippines and some portions of Mindanao
Production, Costs and Returns n n n Calamansi production was decreasing (2000 -2004) but reversed this trend in 2005 onwards Yields averaged 9 tons per hectare in the last 7 years (2000 -2006) Major source is in Oriental Mindoro province (60%), but they can only harvest 4 -6 months in a year Southern Philippines (Mindanao) contribute only 15% of total production, but they can harvest year-round Average farm size is ¼ hectare, although 20% of calamansi farmers cultivate more than 1 hectare of land
Production, Costs and Returns Two ways of looking at costs: 1. Cash – Non-Cash and Imputed COSTS 2. VARIABLE and FIXED COSTS
Production, Costs and Returns Cash Cost Approach in Calamansi (Php) - 1997 Item Cost / ha Cost / kg % to total cost 17, 616 2. 66 67. 4% Non-cash costs 599 0. 10 Imputed costs 7, 910 1. 19 30. 3% Total costs 26, 125 3. 95 100. 0% Cash costs 2. 3%
Production, Costs and Returns Production Costs (Case study in Zamboanga Sibugay, 2005) Item Crate Picking Pruning Cost/ha Cost/kg % to total cost 5, 886 0. 78 23. 5% 8, 066 1. 07 32. 3% 3, 500 0. 47 14. 0% Fertilizing 4, 800 0. 64 19. 2% Others 2, 750 0. 37 11. 0% Total cost 25, 002 3. 32 100. 0%
Production, Costs and Returns Costs (/ha) Php 26, 000 (US $ 604) Production (/ha) 9 tons/hectare (average) Farmgate Price Php 116, 700/ton (US$ 2, 714/ton) Revenue Php 90, 000/ton (US$ 2, 090/ton)
Trading and Marketing Disposition of the Product: 97. 5% 1. 2% 1. 3% Sold Wastage/Shrinkage Payments (Rents/loans/shares)
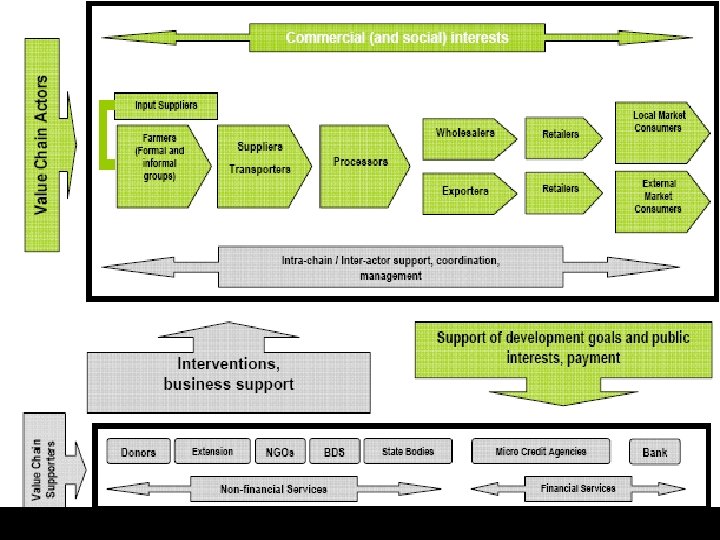
Trading and Marketing Calamansi Simple Chain Actors Farmer Assembler / Distributor Retailer Consumer
Trading and Marketing What we know: 1. 2. 3. 4. 5. The major trading hub is Metro Manila All producers supply outside of their province Direct marketing of fresh calamansi can be profitable for farmers Engaging in processed calamansi is more profitable Entering the industrial use market will be more exciting
Prices (Php) Price 2000 2001 2002 2003 2004 2005 Ave. Farmgate 11. 02 8. 06 14. 93 11. 09 11. 67 13. 23 11. 67 Wholesale 21. 31 19. 66 20. 37 19. 49 18. 41 20. 14 19. 90 Retail 30. 50 28. 43 29. 32 29. 28 28. 08 30. 87 29. 41
Simple Value Chain Ave. production cost: Ph. P 3. 95/kg Farmer Ave. marketing cost: Ph. P 4. 56/kg Assembler/ Distributor Ave. farmgate price: Ph. P 11. 67/kg Retailer Ave. wholesale price: Ph. P 19. 90/kg Consumer Ave. retail price: Ph. P 29. 41/kg
Trading and Marketing What we have to find out (Phase 2): 1. 2. 3. Who are the players in the industrial market use? How much is the market segmentation? What are the price differentiation in each industrial market segment?
Next Steps 1. 2. Do Primary Data-Gathering in 2 provinces Complete the data-gaps in the VCA a) b) c) 3. Industrial market Product inventory Capacity-assessment of calamansi farmers Initiate capacity-building activities
THANK YOU!
Value Chain Analysis of Calamansi (citrus madurencis) Phil. DHRRA – LSFM Project June 8, 2008 Hanoi, Vietnam