Validation of HSAF Precipitation Products Boena apeta Silvia

Validation of H-SAF Precipitation Products Bożena Łapeta, Silvia Puca and Precipitation Validation Team Satellite Remote Sensing Centre, Institute of Meteorology and Water Management, Kraków, Poland (In the presentation materials from H-SAF PVR documents were used)

Presentation Overview • H-SAF prcipitation products validated • Validation with ground data: – methodology – results • Conclusions NOAA Training on “New and Emerging Technologies, Sensors, and Datasets for Precipitation” 15 -17 October 2012, Sao Jose dos Campos, Brazil
 Coordination : DPC (Italy) The PRECIPITATION PRODUCT VALIDATION GROUP")
Precipitation Products Validation Group (PPVG) Coordination : DPC (Italy) The PRECIPITATION PRODUCT VALIDATION GROUP is composed by 24 experts in hydrology, rain gauge data, radar data, and meteorology coming from 8 countries. Silvia Puca Coordination silvia. puca@protezionecivile. it IRM Emmanuel Roulin Pierre Baguis emmanuel. Roulin@oma. be pierre. baguis@oma. be NIMH Gergana Kozinarova gkozinarova@gmail. com Georgy Koshinchanov georgy. koshinchanov@meteo. bg Italy DPC Belgium Bulgaria Germany Bf. G Peter Krahe krahe@bafg. de Hungary OMSZ Kereney Judit kerenyi. j@met. hu Italy DPC Silvia Puca silvia. puca@protezionecivile. it Gianfranco Vulpiani gianfranco. vulpiani@protezionecivile. it Emanuela Campione emanuela. campione@protezionecivile. it Alexander Toniazzo alexander. toniazzo@protezionecivile. it Uni. Ferrara Federico Porcù porcu@fe. infn. it Lisa Milani milani@fe. infn. it CIMA Simone Gabellani simone. gabellani@cimafoundation. org Nicola Rebora nicola. rebora@cimafoundation. org Bozena Łapeta Bozena. Lapeta@imgw. pl Rafal Iwanski Rafal. Iwanski@imgw. pl Jan Kanak jan. kanak@shmu. sk Marian Jurasek marian. jurasek@shmu. sk Luboslav Okon luboslav. okon@shmu. sk ahmet oztopal Ibrahim Sonmez ahmetoztopal@yahoo. com isonmez@dmi. gov. tr Poland Slovakia Turkey IMWM SHMÚ ITU TSMS
 Cycle (Europe) Timeliness Precipitation rate at ground by MW")
Precipitation products Product Resolution (Europe) Cycle (Europe) Timeliness Precipitation rate at ground by MW conical scanners (H 01) 10 km (with CMIS) 6 h (with CMIS only) 15 min 15 km (with other GPM) 3 h (with full GPM) Precipitation rate at ground by MW cross-track scanners (H-02) 10 km 6 h 5 min Precipitation rate at ground by GEO/IR supported by LEO/MW (H-03) 8 Km 15 min 3 h 15 min Cumulated rain 3 and 24 h (H -05) 10 km (from merged MW + IR) NOAA Training on “New and Emerging Technologies, Sensors, and Datasets for Precipitation” 15 -17 October 2012, Sao Jose dos Campos, Brazil

H-SAF validation methodology 1. The Common Validation is the result of the validation activities done by all the Institutes involved in the HPPVG: – both rain gauges (4100 posts) and radar data (40 C band radars) are used; – it is based on statistical scores evaluated on multi-categorical and continuous statistics; – the statistical scores are monthly averages; – the same up-scaling techniques by all the institutes (if proposed by developers). 2. Specific validation Each Institute in addition to the common validation methodology has developed a specific validation methodology based on its own knowledge and experience. – lightning data, numerical weather prediction and nowcasting product – case studies: convective/stratiform precipitation, day/night, land/ocean NOAA Training on “New and Emerging Technologies, Sensors, and Datasets for Precipitation” 15 -17 October 2012, Sao Jose dos Campos, Brazil

How to compare satellite products with ground data? Comparison between the satellite data and ground data were done on the satellite product native grid. There are several approach to bring the observations comparable: • to compare untransformed data, e. g. comparing areal data to observations at a nearest gauge station. • to upscale the reference observations to areal averages corresponding to the resolution of the precipitation products but in an equal-area map projection (interpolation of RG data; averaging of radar data within the product pixel) NOAA Training on “New and Emerging Technologies, Sensors, and Datasets for Precipitation” 15 -17 October 2012, Sao Jose dos Campos, Brazil

How to combine satellite products with ground data? Radar and rain gauge instruments provide many measurements within a single satellite IFOV, those measurements were averaged following the satellite antenna pattern of AMSU-B, SSMI and SEVIRI. Gaussian filter used to average ground data within satellite H-02 pixels NOAA Training on “New and Emerging Technologies, Sensors, and Datasets for Precipitation” 15 -17 October 2012, Sao Jose dos Campos, Brazil
 Data Sources Instrument characteristics Time domain (near real time/ case")
Rain Gauges network (4100) Data Sources Instrument characteristics Time domain (near real time/ case studies) I will put the most actual map Time resolution (15 Jakub) min, 30 min) (from Spatial distribution (whole national territory/ limited area) Raingauges Telemetric and mechanic Near real time, case studies 10 – 30 min (telemetric), 3 – 24 h (mechanic) Whole national territory ~390 mechanic (RMI) Number of station + 12 telemetric (RMI) (please attach a + 4160 telemetric map) (SETHY) Operational/ for research only Operational (RMI) + research (other networks) Telemetric: automatically checked Data quality check / mechanic: autom. + manually checked NOAA Training on “New and Emerging Technologies, Sensors, and Datasets for Precipitation” 15 -17 October 2012, Sao Jose dos Campos, Brazil
 Data Sources Instrument characteristics Time domain (near real time/ case")
Radar network (40 C-band) Data Sources Instrument characteristics Time domain (near real time/ case studies) Raingauges Telemetric and mechanic Near real time, case studies Time resolution (15 min, 30 min) 10 – 30 min (telemetric), 3 – 24 h (mechanic) Spatial distribution (whole national territory/ limited area) Whole national territory ~390 mechanic (RMI) Number of station + 12 telemetric (RMI) (please attach a + 4160 telemetric map) (SETHY) Operational/ for research only Operational (RMI) + research (other networks) Telemetric: automatically checked Data quality check / mechanic: autom. + manually checked NOAA Training on “New and Emerging Technologies, Sensors, and Datasets for Precipitation” 15 -17 October 2012, Sao Jose dos Campos, Brazil

H-SAF validation methodology Main steps of the common validation: • • Selection of satellite pixels falling into the region of interest; Taking into account quality index information (to be implemented); Radar: selection of the radar data synchronous with the satellite ones; Rain gauge: selection of the radar data synchronous with the satellite ones and spatial interpolation of rain gauge data; • Up-scaling of ground data at the resolution of the native satellite grid, or nearest-neighbour matching; • Statistical score calculation. The common validation is now performed by means of a unified software developed at DPC, Italy (contact person: A. Rinollo, angelo. rinollo@protezionecivile. it) H-SAF Precipitation Products Validation and Application, Training Course 6 th IPWG Workshop Sao Jose dos Campos, Brazil 15 -19 October,

Common methodology MC statistic: – ACCURACY – POD – FAR – BIAS – ETS – OR – HSS Plots: - Scatter plot - Probability density function CS statistic: - Number of points - observed Mean rain (rate or cumulated) - Satellite Mean rain (rate or cumulated) - Observed Maximum rain (rate or cumulated) - Satellite Maximum rain (rate or cumulated) - Mean error - Multiplicative bias - Mean absolute error - Root mean square error - correlation coefficient - Standard deviation Period: January 2009 - March 2010 NOAA Training on “New and Emerging Technologies, Sensors, and Datasets for Precipitation” 15 -17 October 2012, Sao Jose dos Campos, Brazil

The PP Validation System BELGIUM -RMI BULGARY -NIMH GERMANY -BFG HUNGARY -HMS ITALY -Uni. Fe POLAND -IMWM SLOVAKIA SHMU TURKEY -ITU, TSMS comparison national radar and rain gauge data with precipitation products on satellite native grid using common software • evaluation of the monthly continuous scores and contingency tables for the precipitation classes • evaluation of PDF producing numerical files called ‘DIST’ files and plots • numerical files called ‘CS’ and ‘MC’ files • numerical files called ‘DIST’ files and plots ITALY -DPC The PP validation leader collect all the validation files (MC, CS and DIST files), verify the consistency of the results and evaluate the monthly common statistical results NOAA Training on “New and Emerging Technologies, Sensors, and Datasets for Precipitation” 15 -17 October 2012, Sao Jose dos Campos, Brazil

Some references on validation Further information about validation technique, ground data quality calculation, ground data interpolation and upscaling, and unified software can be found in: S. Puca et al. , The validation service of the Hydrological SAF geostationary and polar satellite precipitation products, NHESS, 2012 (submitted paper). A. Rinollo et al. , A common protocol for the validation of satellite rainfall estimations using radar data over the European territory, NHESS, 2012 (submitted paper). S. Puca et al. , The Hydrological SAF validation service of geostationary and polar products, Proc. EUMETSAT conference, 2012 (in progress). A. Rinollo et al. , A quality index for radar-based rainfall estimation and the impact of its introduction on the validation of H-SAF satellite precipitation products, Proc. EUMETSAT conference, 2012 (in progress). NOAA Training on “New and Emerging Technologies, Sensors, and Datasets for Precipitation” 15 -17 October 2012, Sao Jose dos Campos, Brazil

Example of H-01 product NOAA Training on “New and Emerging Technologies, Sensors, and Datasets for Precipitation” 15 -17 October 2012, Sao Jose dos Campos, Brazil

Results for H-01 1 0. 8 0. 6 0. 4 POD 0. 2 FAR 0 Spring Summer Autumn Winter 2009/10 NOAA Training on “New and Emerging Technologies, Sensors, and Datasets for Precipitation” 15 -17 October 2012, Sao Jose dos Campos, Brazil

Results for H-01 NOAA Training on “New and Emerging Technologies, Sensors, and Datasets for Precipitation” 15 -17 October 2012, Sao Jose dos Campos, Brazil

Example of H-02 product NOAA Training on “New and Emerging Technologies, Sensors, and Datasets for Precipitation” 15 -17 October 2012, Sao Jose dos Campos, Brazil

Results for H-02 0. 6 0. 4 0. 2 POD 0 FAR Spring 2009 Summer Autumn Winter 2009/10 NOAA Training on “New and Emerging Technologies, Sensors, and Datasets for Precipitation” 15 -17 October 2012, Sao Jose dos Campos, Brazil

Results for H-02 NOAA Training on “New and Emerging Technologies, Sensors, and Datasets for Precipitation” 15 -17 October 2012, Sao Jose dos Campos, Brazil

Example of H-03 product NOAA Training on “New and Emerging Technologies, Sensors, and Datasets for Precipitation” 15 -17 October 2012, Sao Jose dos Campos, Brazil

Results for H-03 NOAA Training on “New and Emerging Technologies, Sensors, and Datasets for Precipitation” 15 -17 October 2012, Sao Jose dos Campos, Brazil

Results for H-03 NOAA Training on “New and Emerging Technologies, Sensors, and Datasets for Precipitation” 15 -17 October 2012, Sao Jose dos Campos, Brazil

Example of H-05 3 h product NOAA Training on “New and Emerging Technologies, Sensors, and Datasets for Precipitation” 15 -17 October 2012, Sao Jose dos Campos, Brazil

Example of H-05 24 h product NOAA Training on “New and Emerging Technologies, Sensors, and Datasets for Precipitation” 15 -17 October 2012, Sao Jose dos Campos, Brazil

Results for H-05 NOAA Training on “New and Emerging Technologies, Sensors, and Datasets for Precipitation” 15 -17 October 2012, Sao Jose dos Campos, Brazil

Results for H-05 NOAA Training on “New and Emerging Technologies, Sensors, and Datasets for Precipitation” 15 -17 October 2012, Sao Jose dos Campos, Brazil

Conclusions Variability with geographical area It may be observed that the performances are rather consistent across the various geographical areas, especially for heavy (> 10 mm/h) and medium (1 -10 mm/h) precipitation. This has been favoured by the adoption of a common validation methodology across the various participating Institutes. Even for inner lands and coastal areas the performance are rather similar. Variability with validation tool The performances resulting from validation by radar and those by rain gauges are rather similar. This is very important because User should not mind about which tool has been used for the validation: the information on the performance is regarded as a property of the product, not of the ground truth. NOAA Training on “New and Emerging Technologies, Sensors, and Datasets for Precipitation” 15 -17 October 2012, Sao Jose dos Campos, Brazil

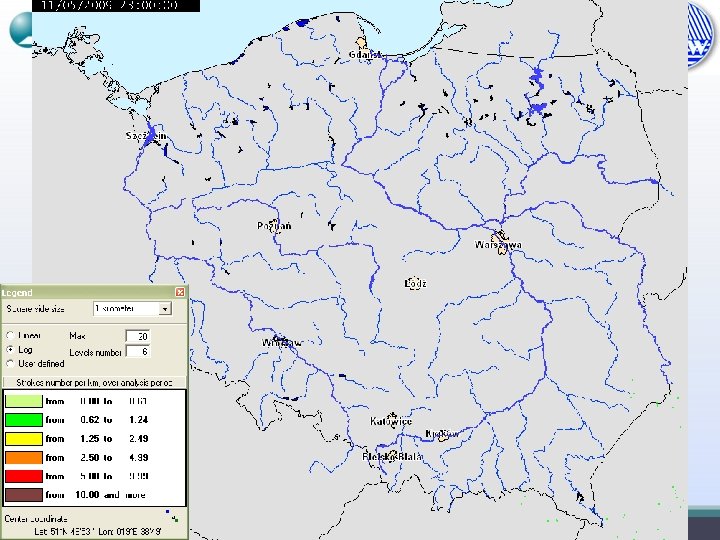
Cases Study Ø High RG measurements connected with heavy precipitation. Ø Days when H 01 and H 02 products were available more or less at the same time (max time span - 30 min); 11 May 2009 - convective precipitation on the frontline moving across Poland. The meteorological situation resulted in heavy convective precipitation that occurred in the afternoon, at the South of Poland. The 6 hour cumulated precipitation measured at the SYNOP stations exceeded 60 mm. NOAA Training on “New and Emerging Technologies, Sensors, and Datasets for Precipitation” 15 -17 October 2012, Sao Jose dos Campos, Brazil
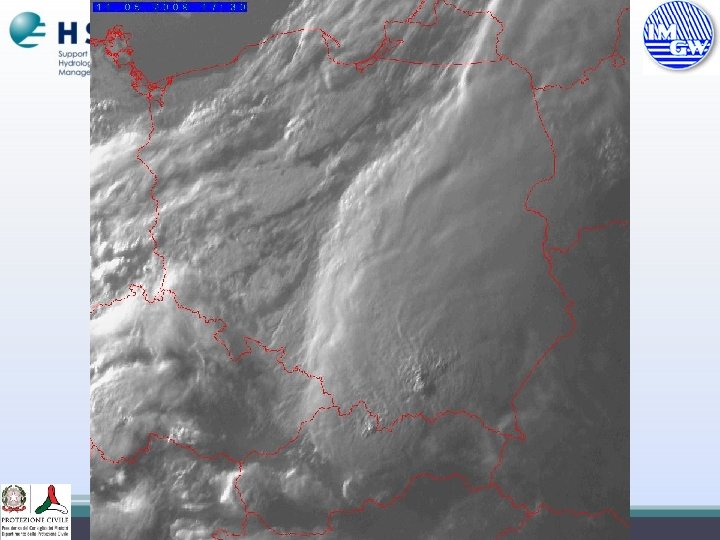

11 May 2009

11 May 2009

11 May 2009 NOAA Training on “New and Emerging Technologies, Sensors, and Datasets for Precipitation” 15 -17 October 2012, Sao Jose dos Campos, Brazil

11 May 2009 NOAA Training on “New and Emerging Technologies, Sensors, and Datasets for Precipitation” 15 -17 October 2012, Sao Jose dos Campos, Brazil

11 May 2009 NOAA Training on “New and Emerging Technologies, Sensors, and Datasets for Precipitation” 15 -17 October 2012, Sao Jose dos Campos, Brazil
![11 May 2009 H-01 [mm/h] H-02 [mm/h] H-03 [mm/h] Max RG 45. 6 20.](http://slidetodoc.com/presentation_image_h/2e8c5388b3042cff31bd687198b80a51/image-36.jpg "11 May 2009 H-01 [mm/h] H-02 [mm/h] H-03 [mm/h] Max RG 45. 6 20.")
11 May 2009 H-01 [mm/h] H-02 [mm/h] H-03 [mm/h] Max RG 45. 6 20. 7 79. 2 Max SAT 51. 5 15. 0 28. 9 Mean RG 3. 6 2. 5 3. 3 Mean SAT 4. 7 1. 8 2. 4 ME 1. 1 -0. 7 -1. 0 St. Dev 5. 9 3. 2 5. 9 RMSE 6. 0 3. 3 6. 0 RMSE % 4. 6 2. 3 3. 3 Parameter NOAA Training on “New and Emerging Technologies, Sensors, and Datasets for Precipitation” 15 -17 October 2012, Sao Jose dos Campos, Brazil

11 May 2009 NOAA Training on “New and Emerging Technologies, Sensors, and Datasets for Precipitation” 15 -17 October 2012, Sao Jose dos Campos, Brazil

Conclusions § The ability of H-SAF rain rate products in convective precipitation recognition was found to be very good for H-01 and quite good for H-02. For H-03, values of POD and FAR are the same. It should be also mentioned that ACC values are very high for all products. § The spatial distribution of convective precipitation was well described by H-01 and H-02 products, however, the size of precipitation area was slightly overestimated. On the other hand, the maximum values of rainfall were properly localised by H-01. § The H-03 product seems to be too rainy - the precipitation area was significantly overestimated. Moreover, distribution of rainfall intensity was found to be too homogeneous and the spots with heavy rainfall were missed. These features can be also seen in the results obtained for the analysis of temporal variability of rain rate performed for selected H-03 pixels NOAA Training on “New and Emerging Technologies, Sensors, and Datasets for Precipitation” 15 -17 October 2012, Sao Jose dos Campos, Brazil

Thank you for your attention! NOAA Training on “New and Emerging Technologies, Sensors, and Datasets for Precipitation” 15 -17 October 2012, Sao Jose dos Campos, Brazil
- Slides: 39