Validation of Gravity Models from CHAMPGRACE Gravity Missions


 Units are in cm Model (+EGM 96) EGM 96")
 Units are in cm Model (+EGM 96) EGM 96")

 Units are in cm Model (+EGM 96) EGM 96")
 Units are in cm Model (+EGM 96) EGM 96")


- Slides: 17
Validation of Gravity Models from CHAMP/GRACE Gravity Missions Using the GPS/leveling Data from the Continental US Yan M. Wang and D. R. Roman National Geodetic Survey NOAA Potsdam, Germany, July 5 -9, 2004
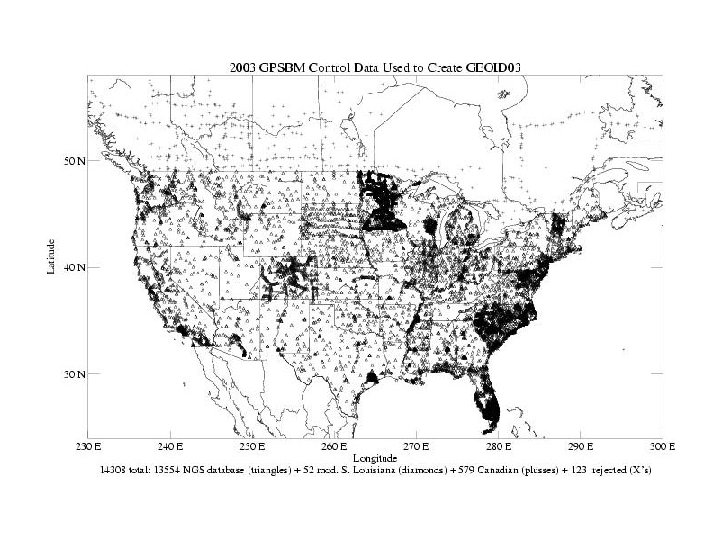
Overview • • Validate GGM 01 S/C & EIGEN_3 P against 14460 GPS/leveling implied geoid undulations scattered over the U. S. and parts of Canada Compare GGM 01 S/C & EIGEN_3 P to geoid changes deduced from 10 years of TOPEX/Poseidon altimetry data over the Great Lakes
GPS/leveling Comparisons Comparison description: • Geoid is computed from coefficient models in full degree and order and to degree and order 90, then augmented with EGM 96 to degree 360 • GPS/leveling data are converted from NAVD 88 to ITRF 96, then compared with models
Statistics of Differences Units are in cm Model No. of Pts. STD GGM 01 S (n=120) GGM 01 C (n=200) 14145 47. 3 14181 39. 2 EIGEN_3 P (n=140) 13818 55. 9 (+EGM 96)
Statistics of Differences Units are in cm Model No. of Pts. STD GGM 01 S (n=90) GGM 01 C (n=90) 14183 36. 5 14182 38. 1 EIGEN_3 P (n=90) 14124 47. 7 (+EGM 96)
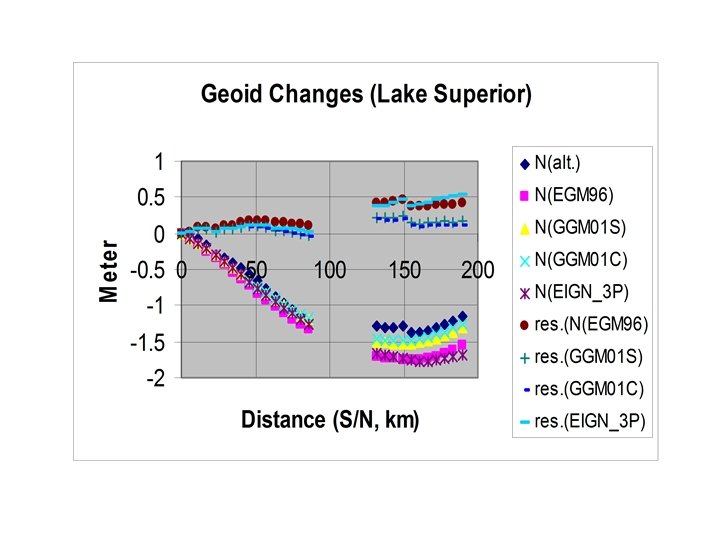
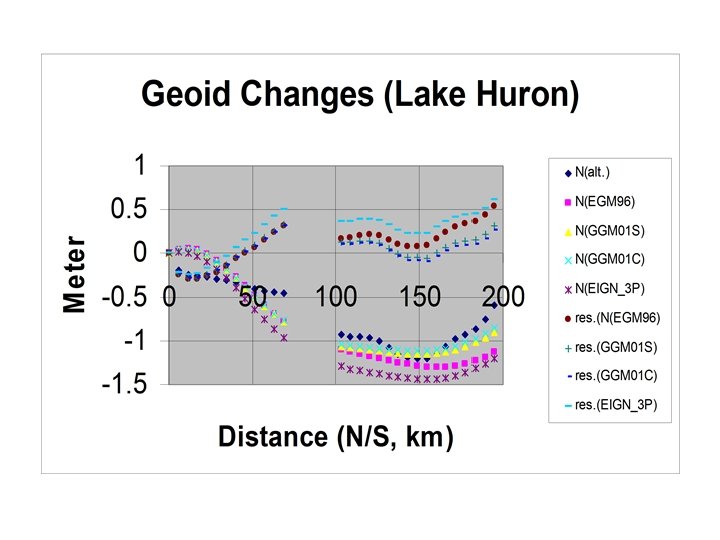
Lake Geoid Comparisons Comparison description: • Lake surface is an equipotential surface • 10 years of TOPEX/Poseidon altimeter data provide accurate mean lake surface with 2 -3 cm accuracy (Beckley, private communication) • Geoid changes are compared over two tracks (Lake Superior and Huron)
T/P Tracks Over Lake Superior
Statistics of Differences (Lake Superior) Units are in cm Model (+EGM 96) EGM 96 No. of Pts. Mean/RMS 27 0. 231/0. 277 GGM 01 S (N=120) GGM 01 C (N=200) EIGEN_3 P (N=140) 27 0. 149/0. 168 27 0. 159/0. 189 27 -0. 132/0. 159
Statistics of Differences (Lake Superior) Units are in cm Model (+EGM 96) EGM 96 No. of Pts. Mean/RMS 27 0. 231/0. 277 GGM 01 S (N=90) GGM 01 C (N=90) EIGEN_3 P (N=90) 27 0. 098/0. 125 27 0. 071/0. 096 27 0. 212/0. 286
T/P Tracks Over Lake Huron
Statistics of Differences (Lake Huron) Units are in cm Model (+EGM 96) EGM 96 No. of Pts. Mean/RMS 31 0. 121/0. 257 GGM 01 S (N=120) GGM 01 C (N=200) EIGEN_3 P (N=140) 31 -0. 300/0. 415 31 -0. 358/0. 406 31 0. 510/0. 644
Statistics of Differences (Lake Huron) Units are in cm Model (+EGM 96) EGM 96 No. of Pts. Mean/RMS 31 0. 121/0. 257 GGM 01 S (N=90) GGM 01 C (N=90) EIGEN_3 P (N=90) 31 0. 045/0. 176 31 0. 022/0. 162 31 0. 246/0. 346
Conclusions • Cutoff degree and orders at 90 for all models and augmented by EGM 96 to 360 improves the comparisons • GGM 01 S (n<=90)+EGM 96 performs the best in GPS/leveling comparisons • GGM 01 C performs the best in lake surface comparisons • Recommendations: GGM 01 S (n<=90)+EGM 96 is recommended
Web Information • Lake monitoring program supported by USDA: http: //www. pecad. fas. usda. gov/cropexplorer/ global_reservoir