
Valence Bond State Crossing Diagrams Sason Shaik Addy
Valence Bond State Crossing Diagrams Sason Shaik, Addy Pross A Valence Bond Model for Reactivity
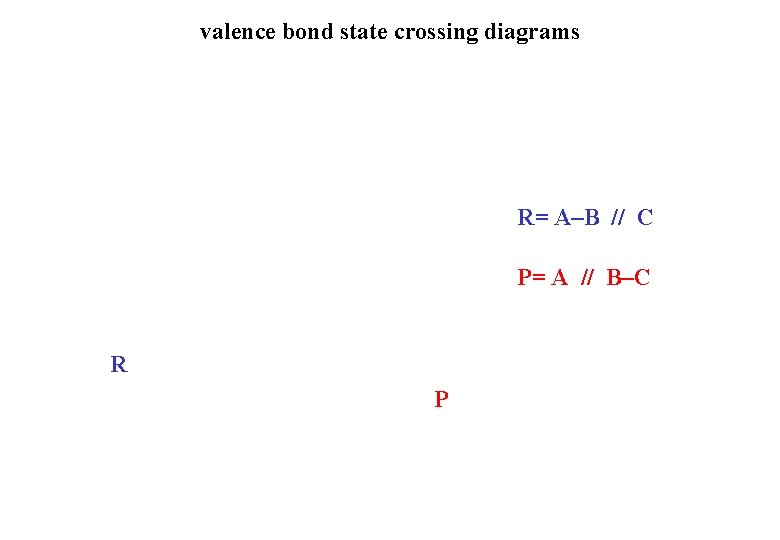
valence bond state crossing diagrams R= A–B // C P= A // B–C R P
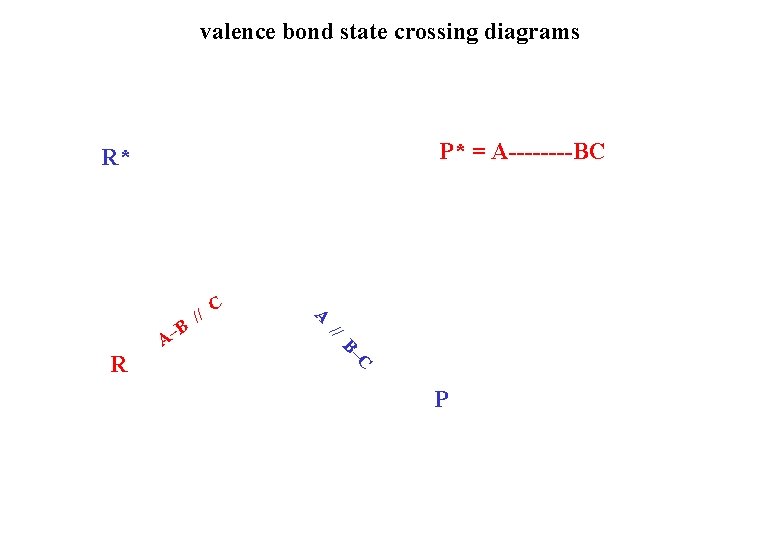
valence bond state crossing diagrams P* = A----BC R* // C B– R C A B A– // P
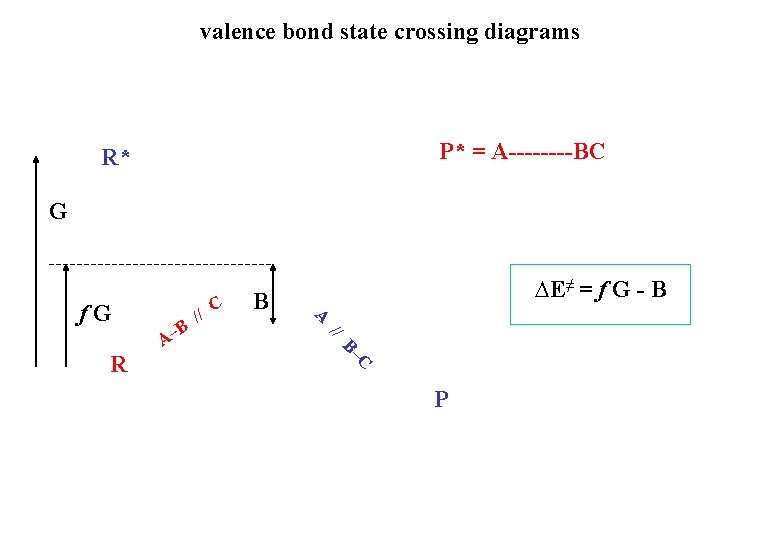
valence bond state crossing diagrams P* = A----BC R* G C B // C B– R B A– // A f. G ∆E≠ = f G - B P

valence bond state crossing diagrams R* G ∆E≠ = f G - B f = curvature factor // B– B = resonance energy C R B A– G = property of reactants B A f. G C // P
Radical reaction X • + A-Y X–A + Y •
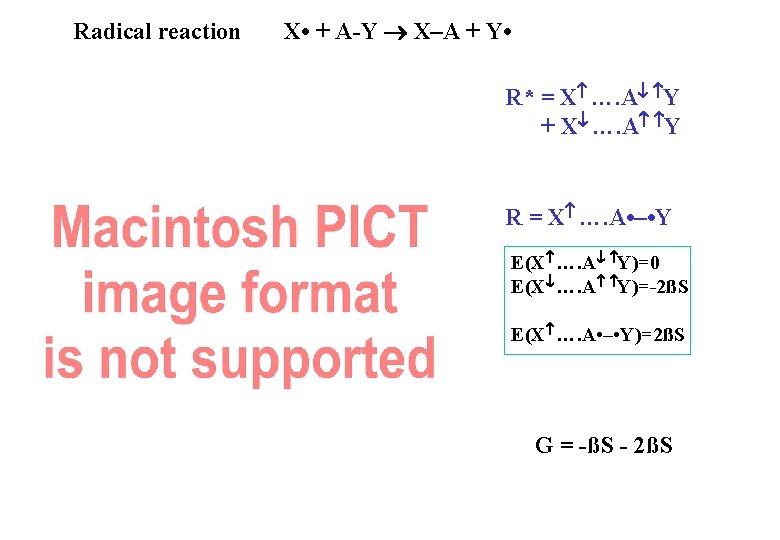
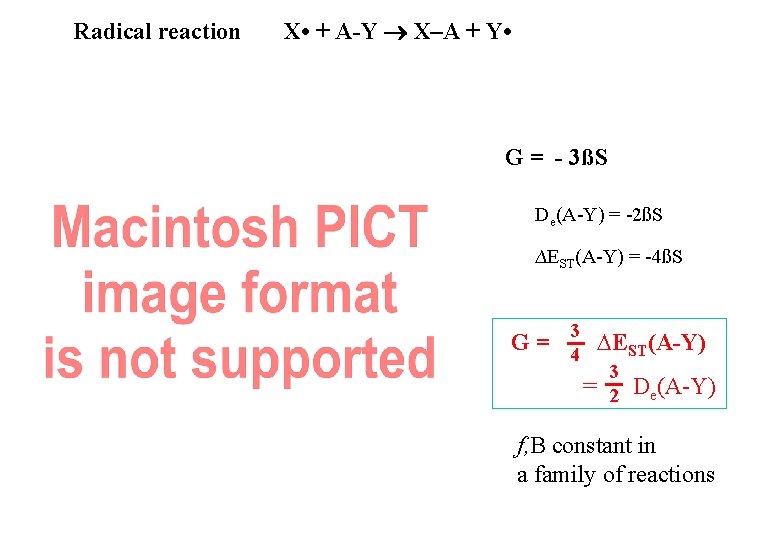
Radical reaction X • + A-Y X–A + Y • G = - 3ßS De(A-Y) = -2ßS ∆EST(A-Y) = -4ßS 3 G = 4 ∆EST(A-Y) 3 = 2 De(A-Y) f, B constant in a family of reactions
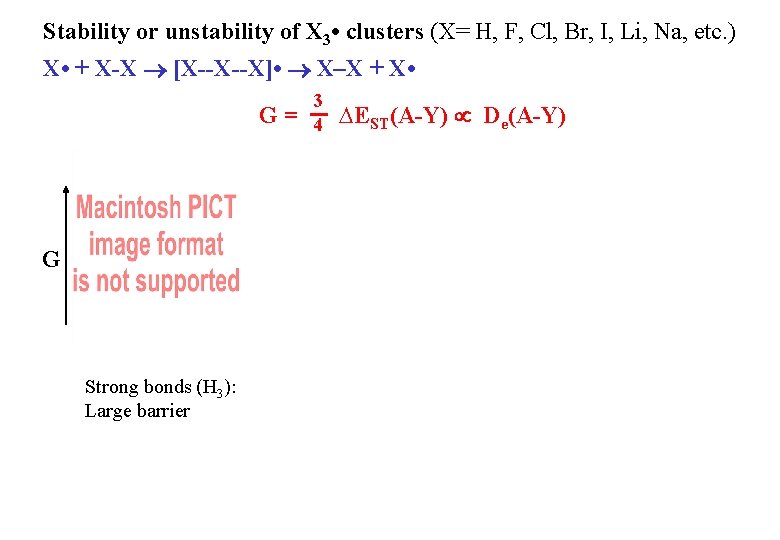
Stability or unstability of X 3 • clusters (X= H, F, Cl, Br, I, Li, Na, etc. ) X • + X-X [X--X--X] • X–X + X • G= G Strong bonds (H 3): Large barrier 3 4 ∆EST(A-Y) De(A-Y)
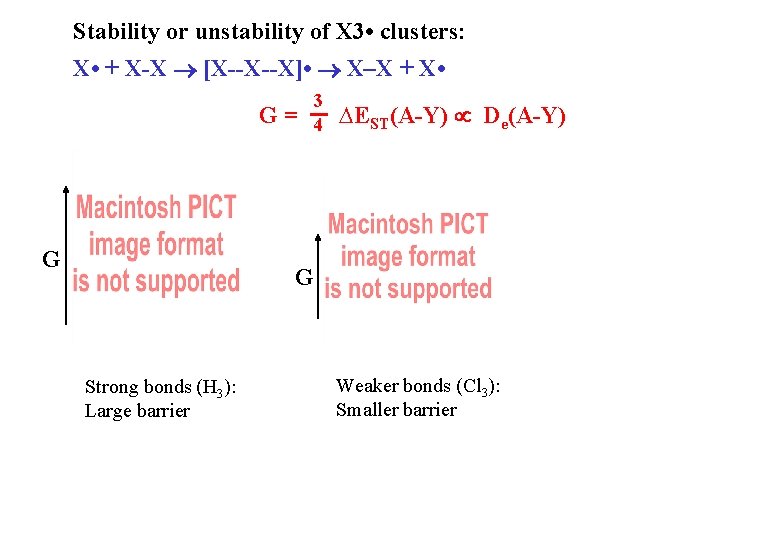
Stability or unstability of X 3 • clusters: X • + X-X [X--X--X] • X–X + X • G= G 3 4 ∆EST(A-Y) De(A-Y) G Strong bonds (H 3): Large barrier Weaker bonds (Cl 3): Smaller barrier
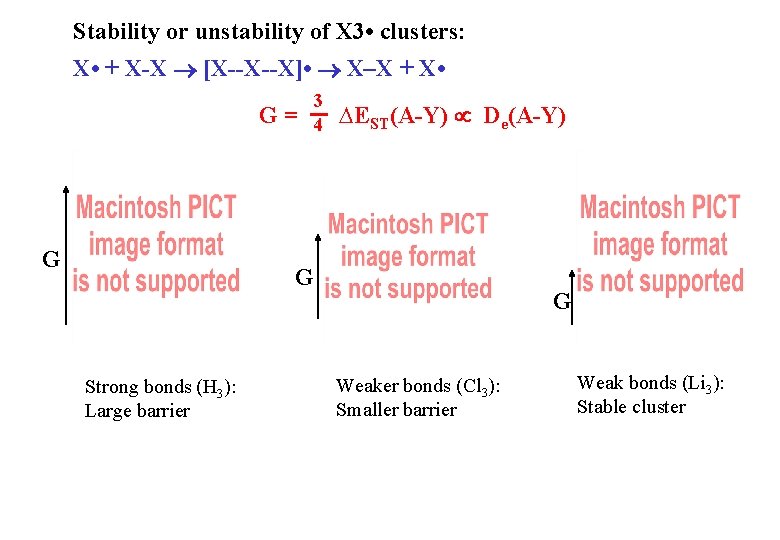
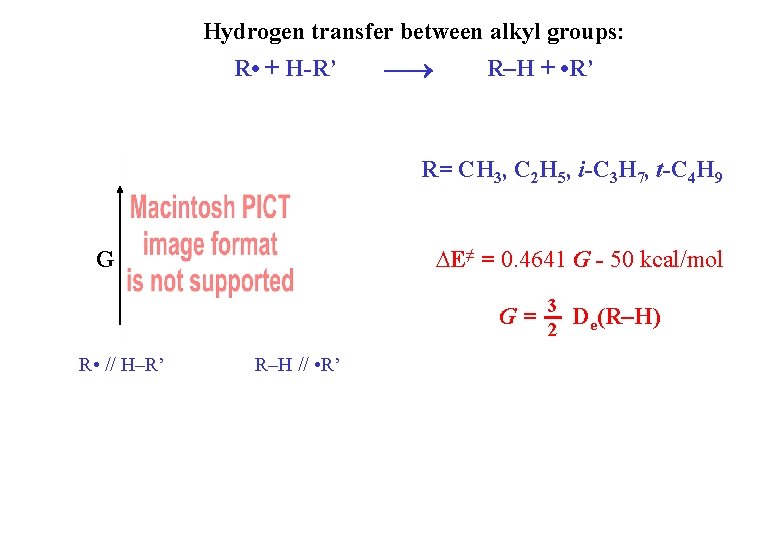
Stability or unstability of X 3 • clusters: X • + X-X [X--X--X] • X–X + X • G= G 3 4 ∆EST(A-Y) De(A-Y) G Strong bonds (H 3): Large barrier G Weaker bonds (Cl 3): Smaller barrier Weak bonds (Li 3): Stable cluster
Hydrogen transfer between alkyl groups: R • + H-R’ R–H + • R’ R= CH 3, C 2 H 5, i-C 3 H 7, t-C 4 H 9 G ∆E≠ = 0. 4641 G - 50 kcal/mol G= R • // H–R’ R–H // • R’ 3 2 De(R–H)
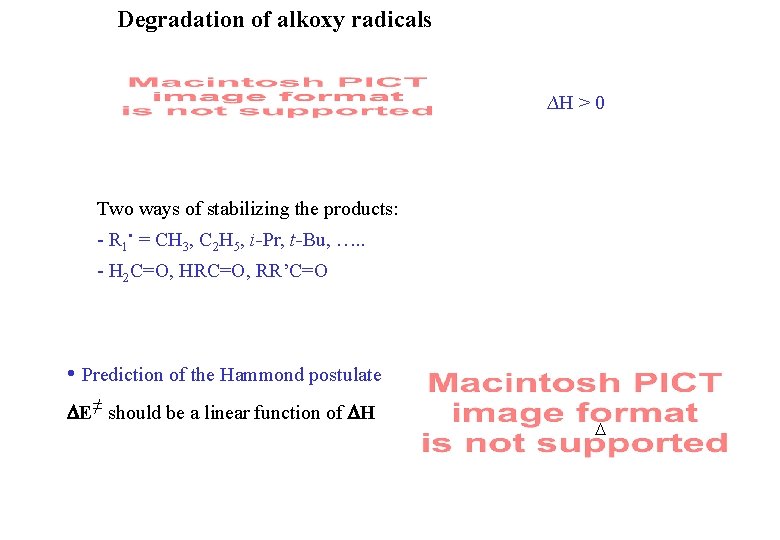
Degradation of alkoxy radicals ∆H > 0 Two ways of stabilizing the products: - R 1 • = CH 3, C 2 H 5, i-Pr, t-Bu, …. . - H 2 C=O, HRC=O, RR’C=O • Prediction of the Hammond postulate DE≠ should be a linear function of DH D
Degradation of alkoxy radicals ∆E > 0 • Experimentally, two different laws: - If one stabilizes the products by substituting R 1 • : DE≠ = 1. 20 DH + cte - If one stabilizes the products by substituting C=O: DE≠ = 0. 4 DH + cte (law #1 ) (law #2 )
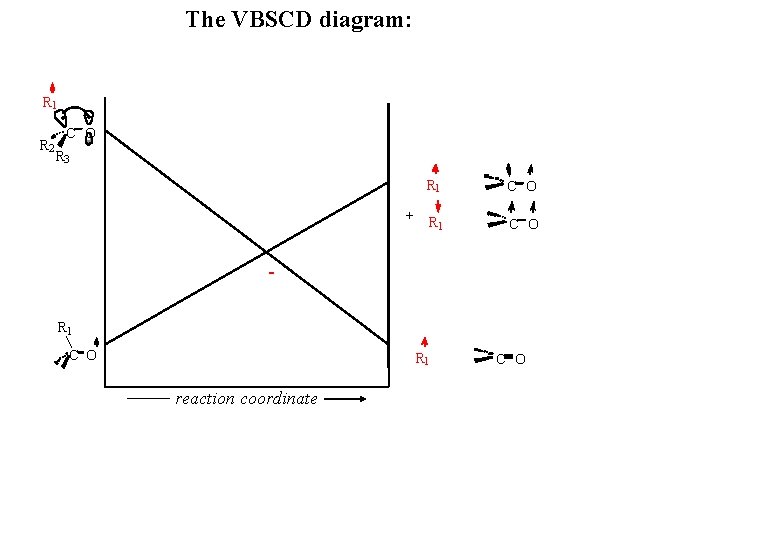
The VBSCD diagram: R 1 R 2 • • C O R 3 R 1 C O + R 1 C O R 1 reaction coordinate C O
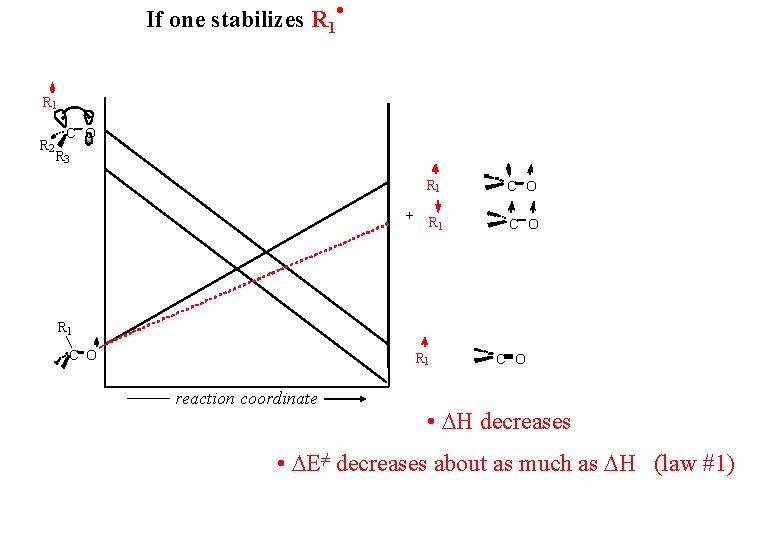
If one stabilizes R 1 • R 1 R 2 • • C O R 3 R 1 C O + R 1 C O R 1 reaction coordinate C O • DH decreases • DE≠ decreases about as much as DH (law #1)
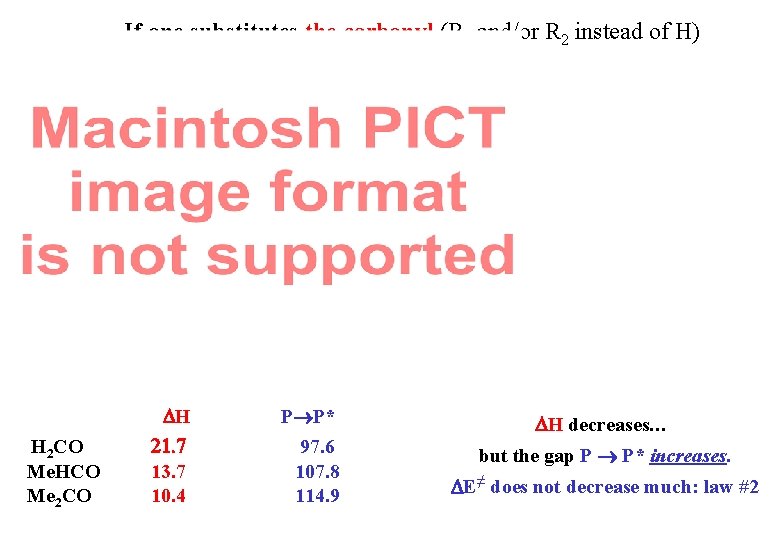
If one substitutes the carbonyl (R 1 and/or R 2 instead of H) H 2 CO Me. HCO Me 2 CO DH 13. 7 10. 4 P P* 97. 6 107. 8 114. 9 DH decreases… but the gap P P* increases. DE≠ does not decrease much: law #2
Why does the gap P P* increase upon carbonyl substitution? 1 2
Why does the gap P P* increase upon carbonyl substitution? 1 2 • Effect of R on the triplet state 1 The doubly occupied π MO of R is delocalized on the carbonyl’s π system: Delocalization does not stabilize the triplet
Why does the gap P P* increase upon carbonyl substitution? 1 2 • Effect of R on the triplet state 1 The doubly occupied π MO of R conjugates with the carbonyl’s π electrons: Delocalization does not stabilize the triplet • Effect of R on the non-bonding state 2 Delocalization increases repulsion P* is destabilized, P P* increases
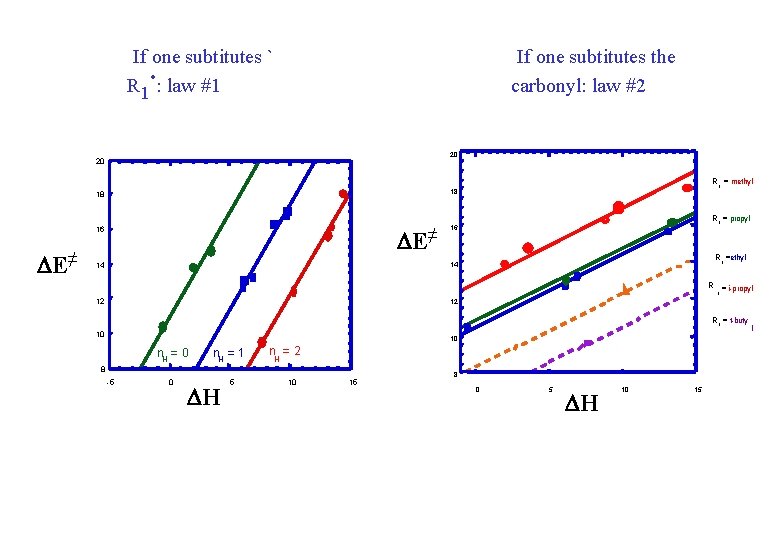
If one subtitutes ` R 1 • : law #1 If one subtitutes the carbonyl: law #2 20 20 18 DE≠ 16 R 1 = propyl 16 14 14 12 12 R 1 =ethyl R = i-propyl 1 R 1 = t-buty 10 10 n. H = 1 n =2 H 8 -5 0 DH 5 10 15 8 0 5 DH 10 15 l DE≠ R 1 = methyl 18
Nucleophilic reaction (SN 2) X: + A-Y X–A + : Y - G = IP(X ) -EA(AY)
Nucleophilic reaction (SN 2) X: + A-Y X–A + : Y - G = IP(X ) -EA(AY) Delocalized X • : large f factor Localized X • : small f factor

Nucleophilic reaction (SN 2) First set: - X: = F , CN , HOO CF 3 CH 2 O , CH 3 O , DE≠ = f 1(IP(X-)) + cte Second set: - Ph. S , Ph. O , N 3 , NO 2 , Ac. O DE≠ = f 2(IP(X-)) + cte f 2 > f 1
Nucleophilic reaction (SN 2) DE≠ = f 1(IP(X-)) + cte
Nucleophilic reaction (SN 2) DE≠ = f 2(IP(X-)) + cte DE≠ = f 1(IP(X-)) + cte
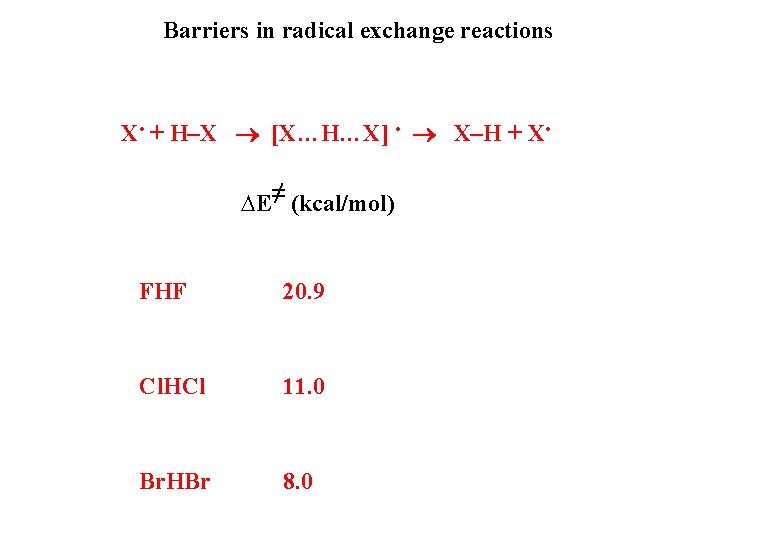
Barriers in radical exchange reactions X • + H–X [X…H…X] • X–H + X • ∆E≠ (kcal/mol) FHF 20. 9 Cl. HCl 11. 0 Br. HBr 8. 0
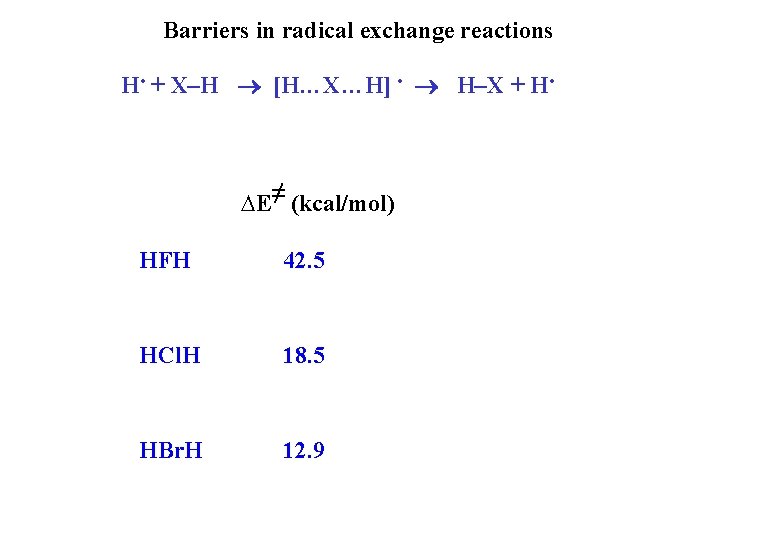
Barriers in radical exchange reactions H • + X–H [H…X…H] • H–X + H • ∆E≠ (kcal/mol) HFH 42. 5 HCl. H 18. 5 HBr. H 12. 9
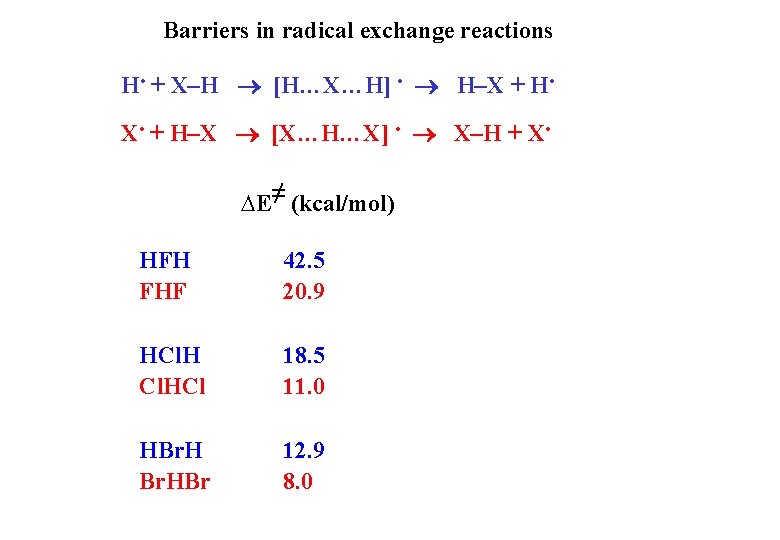
Barriers in radical exchange reactions H • + X–H [H…X…H] • H–X + H • X • + H–X [X…H…X] • X–H + X • ∆E≠ (kcal/mol) HFH FHF 42. 5 20. 9 HCl 18. 5 11. 0 HBr 12. 9 8. 0
VB statecrossing diagrams
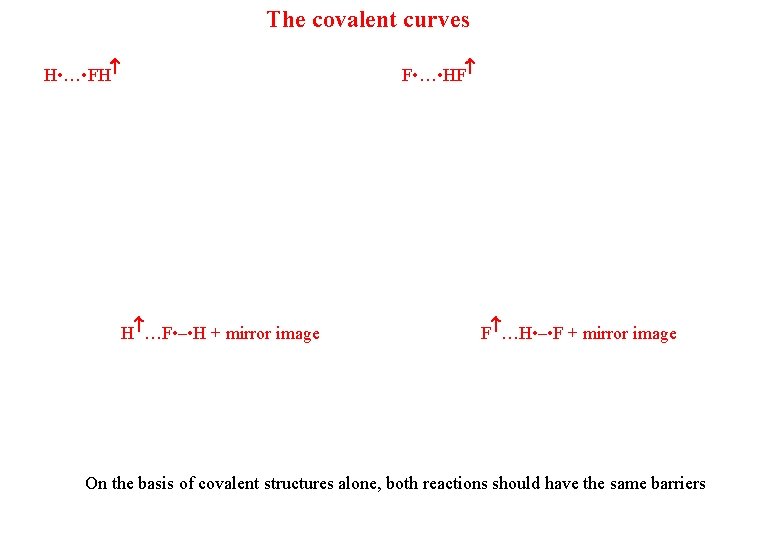
The covalent curves H • … • FH F • … • HF H …F • – • H + mirror image F …H • – • F + mirror image On the basis of covalent structures alone, both reactions should have the same barriers
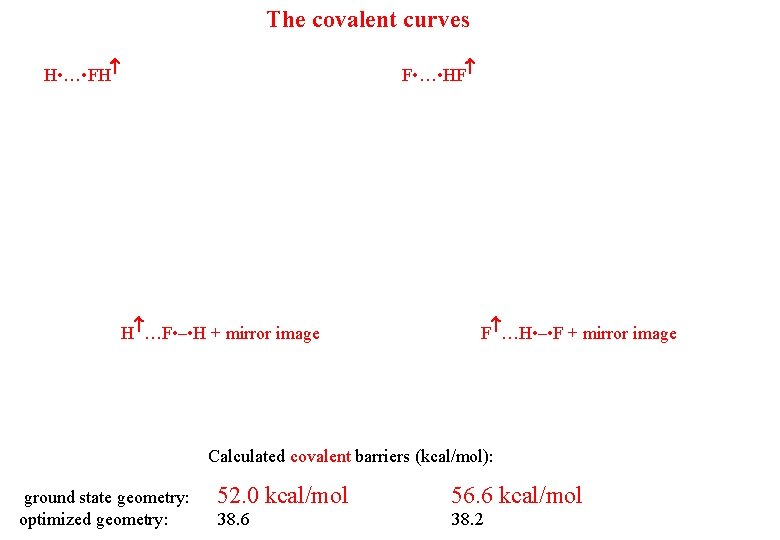
The covalent curves H • … • FH F • … • HF H …F • – • H + mirror image F …H • – • F + mirror image Calculated covalent barriers (kcal/mol): ground state geometry: optimized geometry: 52. 0 kcal/mol 56. 6 kcal/mol 38. 6 38. 2
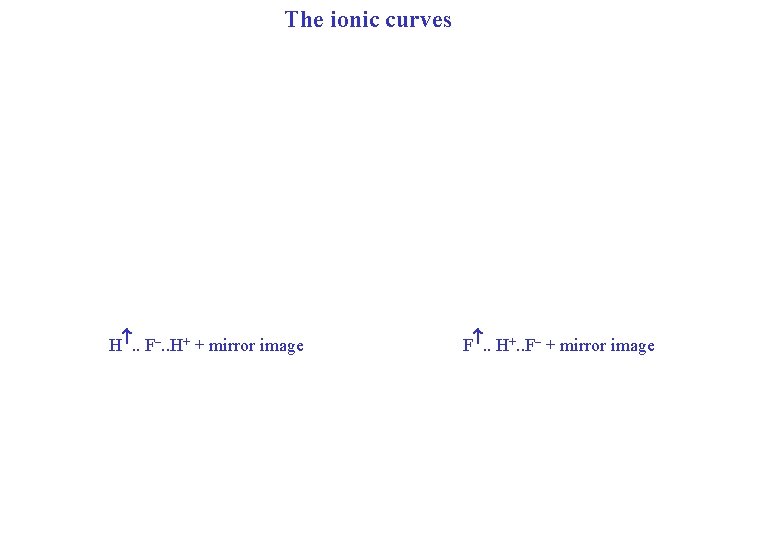
The ionic curves H. . F–. . H+ + mirror image F. . H+. . F– + mirror image
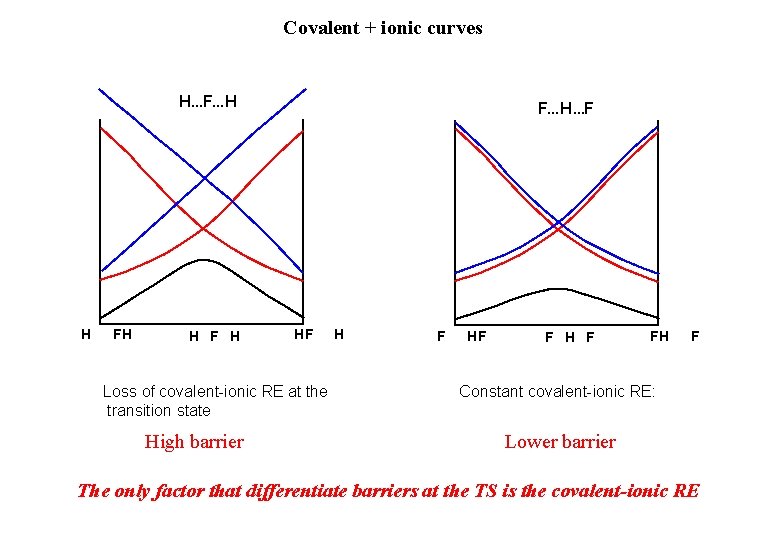
Covalent + ionic curves H. . . F. . . H H F H F. . . H. . . F HF Loss of covalent-ionic RE at the transition state => high barrier H F HF F H F FH F Constant covalent-ionic RE: lower barrier Lower barrier The only factor that differentiate barriers at the TS is the covalent-ionic RE
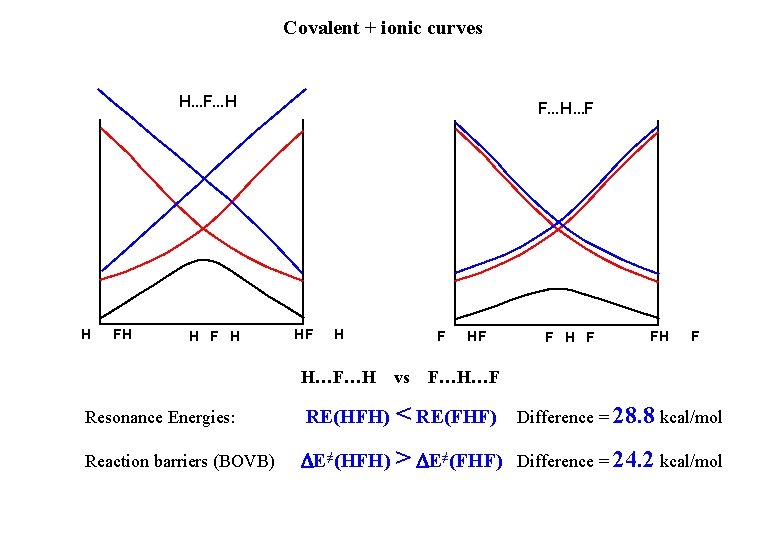
Covalent + ionic curves H. . . F. . . H H F H F. . . H. . . F HF H H…F…H F vs HF F H F F…H…F Resonance Energies: RE(HFH) < RE(FHF) Reaction barriers (BOVB) DE≠(HFH) > DE≠(FHF) Difference = 24. 2 kcal/mol Difference = 28. 8 kcal/mol
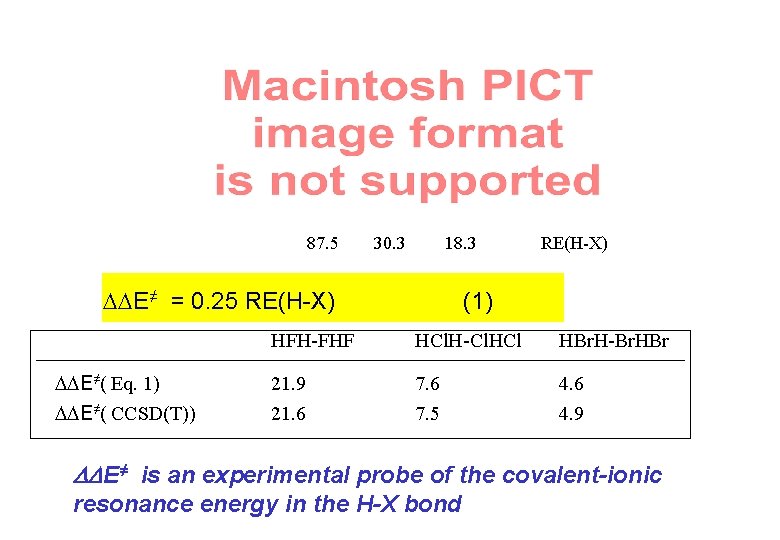
87. 5 30. 3 18. 3 DDE≠ = 0. 25 RE(H-X) DDE≠( Eq. 1) DDE≠( CCSD(T)) RE(H-X) (1) HFH-FHF HCl. H-Cl. HCl HBr. H-Br. HBr 21. 9 21. 6 7. 5 4. 6 4. 9 DDE≠ is an experimental probe of the covalent-ionic resonance energy in the H-X bond
Valence bond state correlation diagrams • A general model for reactivity. - Nucleophilic, electrophilic, radical, pericyclic… -Insightful (reaction mechanism) -Predicts barrier tendencies from properties of reactants • No calculations required - qualitative reasonings, - a few elementary interaction energies to be known • Complementary to Woodward-Hoffmann
Valence Bond State Crossing Diagrams Sason Shaik Avital Shurki What happens to Molecules as They React? S. Shaik, J. Amer. Chem. Soc. 1981, 103, 3692 VB Diagrams and Chemical Reactivity S. Shaik and A. Shurki, Angew. Chem. Int. Ed. 1999, 38, 586 -625
- Slides: 38